XPS vs AES vs SIMS: A Comprehensive Guide to Surface Analysis Techniques for Biomedical Research
This article provides a detailed comparative analysis of three cornerstone surface analysis techniques—X-ray Photoelectron Spectroscopy (XPS), Auger Electron Spectroscopy (AES), and Time-of-Flight Secondary Ion Mass Spectrometry (ToF-SIMS).
XPS vs AES vs SIMS: A Comprehensive Guide to Surface Analysis Techniques for Biomedical Research
Abstract
This article provides a detailed comparative analysis of three cornerstone surface analysis techniques—X-ray Photoelectron Spectroscopy (XPS), Auger Electron Spectroscopy (AES), and Time-of-Flight Secondary Ion Mass Spectrometry (ToF-SIMS). Tailored for researchers, scientists, and drug development professionals, it explores the fundamental principles, methodological applications, and common challenges associated with each technique. The scope ranges from foundational knowledge and material-specific selection to troubleshooting experimental artifacts and validating findings through complementary use. By synthesizing current capabilities and emerging trends, this guide aims to empower professionals in making informed decisions to advance biomedical and clinical research, from optimizing medical implants and drug delivery systems to characterizing novel biomaterials.
Understanding Surface Analysis: Core Principles of XPS, AES, and SIMS
Understanding the elemental and chemical composition of material surfaces is fundamental in fields ranging from drug development to advanced battery and semiconductor research. Among the most powerful techniques for such analysis are X-ray Photoelectron Spectroscopy (XPS), Auger Electron Spectroscopy (AES), and Secondary Ion Mass Spectrometry (SIMS). These methods probe the topmost atomic layers of a sample, providing critical information that bulk analysis techniques cannot capture. XPS operates by irradiating a sample with X-rays and measuring the kinetic energy of emitted photoelectrons to identify elements and their chemical states. AES uses an electron beam to excite atoms, resulting in the emission of Auger electrons whose energies are characteristic of the emitting element. SIMS, in contrast, uses a focused primary ion beam to sputter material from the surface, and the ejected secondary ions are mass-analyzed to determine the surface composition.
Each technique has its own physical basis, strengths, and limitations. XPS is renowned for its excellent quantitative capabilities and sensitivity to chemical state information. AES offers high spatial resolution, making it ideal for microanalysis and failure analysis. SIMS provides extremely high sensitivity (down to parts-per-billion for some elements) and the ability to detect all elements, including hydrogen and isotopes. The choice between them depends on the specific analytical requirements, such as the need for spatial resolution, chemical sensitivity, or detection limits. This guide provides a objective, data-driven comparison of these three core surface analysis techniques to inform researchers and scientists in their methodological selections.
Theoretical Foundations and Physical Processes
Photoelectron Emission (XPS)
The XPS process is initiated when a sample is irradiated with X-rays of a known energy. These X-rays can cause the photoemission of core-level electrons from atoms within the top 1-10 nanometers of the material [1]. The kinetic energy (KE) of the emitted photoelectron is measured by the spectrometer, and the electron's binding energy (BE) is calculated using the equation: BE = hν - KE - Φ, where hν is the energy of the incident X-ray photon and Φ is the work function of the spectrometer. The binding energy is a unique characteristic of both the element and the specific electron orbital from which it originated, and it is sensitive to the chemical environment of the atom. This chemical shift allows XPS to identify not only the presence of elements but also their oxidation states and the local bonding arrangements. As a surface-sensitive technique, the information depth of XPS is limited by the escape depth of the photoelectrons, which is typically a few nanometers, making it exquisitely sensitive to surface composition [2].
The Auger Effect (AES)
The Auger process is a competing mechanism to photoelectron emission that occurs when an atom relaxes following the removal of a core-level electron. This initial ionization is typically caused by a focused electron beam in AES, though it can also be induced by X-rays. The resulting core-hole is filled by an electron from a higher energy level, and the energy released in this transition can either be emitted as a characteristic X-ray (fluorescence) or transferred to another electron, which is then ejected from the atom. This ejected electron is known as an Auger electron. Its kinetic energy, which is characteristic of the element and independent of the incident beam energy, is what is measured in AES. The Auger process involves three electrons and is described using X-ray notation, such as KL₁L₂₃, indicating the initial hole and the subsequent transitions involved. Like XPS, AES is highly surface-sensitive due to the short inelastic mean free path of the emitted Auger electrons [3].
Sputtered Ion Emission (SIMS)
SIMS is fundamentally different from both XPS and AES, as it is based on the interaction of a primary ion beam (typically O₂⁺, Cs⁺, or Ga⁺) with the sample surface. When these high-energy ions (typically 1-30 keV) strike the surface, they transfer their momentum to the atoms of the sample through a series of collisions in a process known as the collision cascade. This can lead to the ejection (sputtering) of atoms, molecules, and molecular fragments from the top one or two atomic layers of the surface. A small fraction of these sputtered particles are ionized (positive or negative), and these secondary ions are then extracted into a mass analyzer (e.g., a time-of-flight or quadrupole mass spectrometer) where they are separated according to their mass-to-charge ratio (m/z) and detected [4] [5]. The intensity of a specific secondary ion provides a measure of the concentration of that species in the surface, while the mass spectrum provides a detailed map of the surface's molecular and elemental composition.
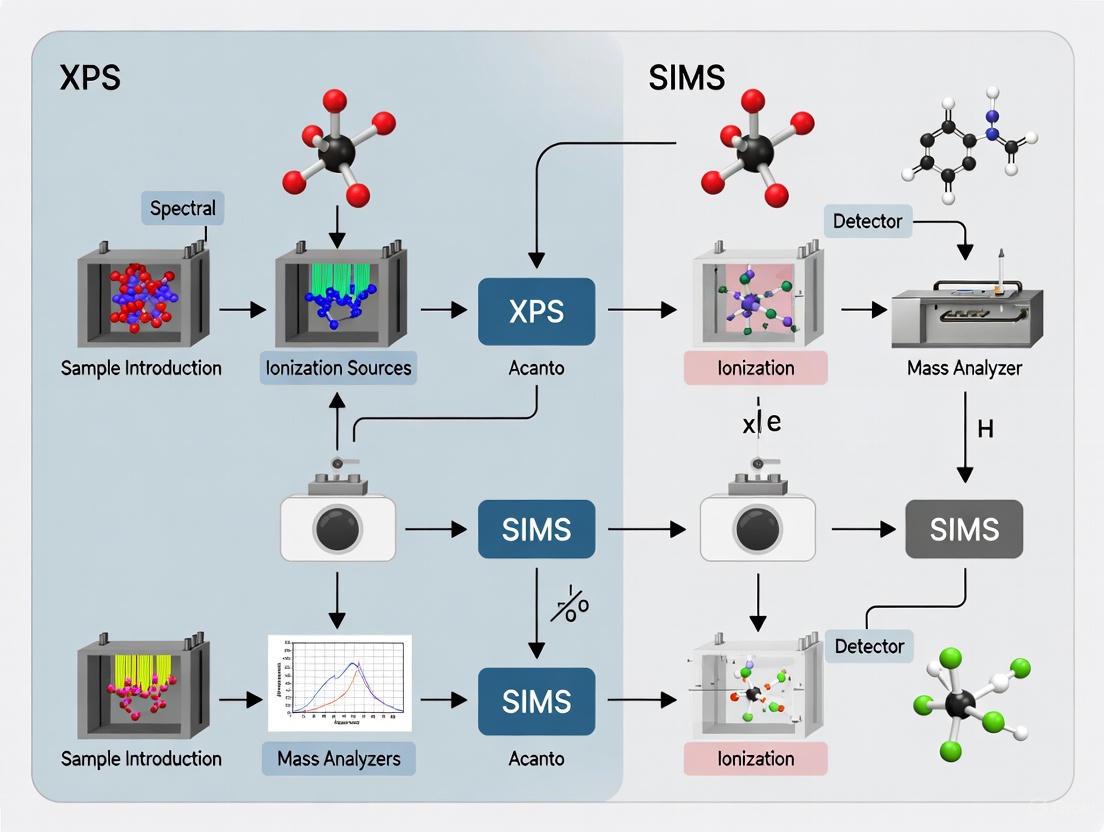
Diagram 1: Core physical processes in XPS, AES, and SIMS, showing the different incident probes and emitted particles used for surface analysis.
Technical Comparison and Performance Data
The following tables provide a consolidated, quantitative comparison of the core capabilities, performance metrics, and practical considerations for XPS, AES, and SIMS, based on experimental data and established technical specifications.
Table 1: Core Technical Capabilities and Performance Metrics
| Feature | XPS | AES | SIMS |
|---|---|---|---|
| Primary Probe | X-rays | Electron Beam | Ion Beam |
| Detected Signal | Photoelectrons | Auger Electrons | Sputtered Ions |
| Information Depth | 1-10 nm [1] | 1-5 nm [6] | 1-2 monolayers [5] |
| Lateral Resolution | 1-10 μm [2] (≥150 nm at synchrotrons) | 10-50 nm | < 100 nm |
| Detection Limits (Atomic %) | 0.1 - 1% | 0.1 - 1% | ppm - ppb [5] |
| Elements Detected | All except H and He [2] | All except H and He [2] | All, including H and isotopes [2] |
| Chemical State Information | Excellent | Good (e.g., carbon on metals) [2] | Limited (via cluster ions) |
| Quantitative Accuracy | Excellent (±5-10%) | Good (±10-15%) | Poor (requires standards) |
| Destructive to Sample? | Essentially Non-destructive | Potentially destructive (e-beam damage) [7] | Destructive |
Table 2: Analytical Strengths, Weaknesses, and Common Applications
| Parameter | XPS | AES | SIMS |
|---|---|---|---|
| Key Strengths | Simple quantification, excellent chemical state info, low damage [2] | High-spatial resolution elemental mapping, fast analysis | Ultimate sensitivity, isotope detection, full elemental coverage, molecular information (ToF-SIMS) [2] [8] |
| Main Limitations | Poor lateral resolution vs. AES/SIMS, no H detection, charging on insulators | E-beam damage [7], poorer chemical state info vs. XPS, charging | Complex spectra, strong matrix effects, semi-destructive |
| Typical Applications | Surface chemistry, functional group identification, oxidation states, thin film composition | Micro-contamination analysis, grain boundary chemistry, failure analysis | Trace element mapping, dopant profiling, organic surface analysis (ToF-SIMS), isotope tracing [8] |
Experimental Protocols and Methodologies
Standard Analysis Protocol for XPS
A typical XPS analysis begins with sample introduction, preferably via a load-lock system to maintain ultra-high vacuum (UHV) conditions and minimize air exposure. The sample is often secured to a holder using conductive tape or clips to mitigate charging. The analysis is performed in a UHV chamber (base pressure typically < 1 × 10⁻⁸ mbar) to prevent surface contamination and allow the emitted electrons to travel to the detector without scattering. A survey spectrum is first acquired over a wide binding energy range (e.g., 0-1200 eV) to identify all elements present. This is followed by high-resolution regional scans over the core-level peaks of the identified elements to extract chemical state information. For insulating samples, a low-energy electron flood gun is used to neutralize positive charge buildup on the surface. Peak fitting of the high-resolution spectra is then performed using appropriate software, applying constraints based on known chemical physics (e.g., fixed peak separations and area ratios for spin-orbit doublets) to accurately identify chemical species and their relative abundances [2]. It is critical to note that a common pitfall, observed in about 40% of published papers, is the incorrect fitting of peaks, such as using symmetrical peaks for inherently asymmetrical metallic line shapes [2].
Depth Profiling with Ion Sputtering
To analyze composition as a function of depth, XPS and AES are often combined with ion sputtering. A beam of inert gas ions (typically Ar⁺) is used to sequentially remove layers of material, with analysis performed intermittently between sputtering cycles. This process, however, introduces artefacts that must be carefully considered. These include atomic mixing (ion bombardment smears the original interface), preferential sputtering (one element is removed faster than others, altering the measured composition), ion-induced roughening (which degrades depth resolution), and chemical reduction (e.g., reduction of oxides to their metallic states) [1] [7]. To mitigate some of these effects, particularly roughening, sample rotation during sputtering has been successfully applied in AES and SIMS. However, in XPS, the large analyzed area can make the technique more susceptible to crater-edge effects, which can still degrade resolution even with rotation [9]. Cluster ion sources (e.g., Arₙ⁺) are now increasingly used for depth profiling of organic materials and inorganic interfaces as they cause less chemical damage and reduce atomic mixing compared to monoatomic ions [1].
Combined XPS and TOF-SIMS Protocol for Complex Materials
For the analysis of complex, multi-component systems like battery electrodes, a combined approach using XPS and Time-of-Flight SIMS (TOF-SIMS) is highly effective [8]. The experimental workflow is as follows:
- Sample Transfer: Electrodes are extracted from cycled cells in an inert atmosphere (e.g., an Ar-filled glovebox) to preserve the native solid-electrolyte interphase (SEI).
- Initial XPS Analysis: Samples are transferred via an airtight vessel to the XPS instrument. Large-area survey and high-resolution spectra (e.g., of C 1s, O 1s, F 1s, and transition metals) are acquired to determine the average surface chemistry and identify key chemical states.
- SXI and Spectral Mapping: Scanning X-ray-induced secondary electron (SXI) imaging provides an overview of the surface morphology. Following this, high-resolution XPS spectral maps (mosaics) of specific regions of interest are collected to correlate chemistry with morphology.
- TOF-SIMS Analysis: The same sample is transferred to the TOF-SIMS instrument. The surface is interrogated with a pulsed primary ion beam (e.g., Bi₃⁺). The high-lateral resolution mass spectral data provides detailed 2D and 3D maps of the distribution of specific molecular and elemental ions (e.g., organic fragments, LiF, phosphates) identified by XPS.
- Data Correlation: The complementary datasets are overlayed, with XPS providing positive chemical identification and TOF-SIMS revealing the spatial distribution of these components with high sensitivity. This protocol has proven essential for understanding how engineered coatings stabilize battery cathode interfaces [8].
Diagram 2: Integrated XPS and TOF-SIMS workflow for analyzing air-sensitive functional materials like battery electrodes.
The Scientist's Toolkit: Essential Research Reagents and Materials
Table 3: Key Research Reagents and Materials for Surface Analysis
| Reagent/Material | Function/Application | Technique |
|---|---|---|
| Argon Gas (Monoatomic) | Sputter source for surface cleaning and conventional depth profiling. | XPS, AES, SIMS |
| Argon Gas (Cluster, Arₙ⁺) | Sputter source for reduced damage depth profiling of delicate organics and inorganic interfaces. | XPS, AES |
| C₆₀ Fullerene | Thermal deposition source for a consistent, conductive carbon reference layer for binding energy calibration on challenging samples. | XPS [7] |
| Gold (Au) Wire | Evaporation source for depositing a thin, conductive coating on insulating samples to mitigate charging; also used as a BE reference. | XPS, AES |
| Adventitious Carbon | Ubiquitous hydrocarbon contamination used as an internal reference for charge correction (C 1s at ~284.8 eV). Use with caution on reactive surfaces. | XPS |
| Ionic Liquid Electrolytes | Model systems for studying electrode-electrolyte interfaces and solid electrolyte interphase (SEI) formation under near-ambient conditions. | XPS, AES [7] |
| Engineered Particle (Ep) Electrodes | Model battery electrodes with controlled surface coatings to study interfacial stabilization mechanisms. | XPS, TOF-SIMS [8] |
| Ni/Cr Multilayer Thin Film | Standard reference material for evaluating and optimizing depth resolution in sputter depth profiling experiments. | XPS, AES [9] |
XPS, AES, and SIMS are complementary pillars of modern surface analysis, each founded on distinct physical principles. XPS excels in providing straightforward quantitative analysis and detailed chemical state information with minimal damage. AES offers superior spatial resolution for elemental mapping at the nanoscale. SIMS delivers unparalleled sensitivity for trace element and isotopic analysis, with TOF-SIMS extending this to molecular surface mapping. The choice of technique is not a question of which is best, but which is most appropriate for the specific analytical question. For complex, real-world problems in advanced materials and drug development, a multi-technique approach—such as the combined use of XPS and TOF-SIMS—is often the most powerful strategy, leveraging the respective strengths of each method to build a comprehensive picture of surface composition and chemistry.
Surface analysis is a critical component in materials science, chemistry, and drug development, providing essential information about the outermost layers of a material that dictate its properties and behavior. Among the most powerful techniques in this field are X-ray Photoelectron Spectroscopy (XPS), Auger Electron Spectroscopy (AES), and Secondary Ion Mass Spectrometry (SIMS). Each technique offers unique capabilities and limitations for probing elemental composition, chemical states, and molecular information from surface and near-surface regions. Understanding their complementary strengths is essential for selecting the appropriate analytical method for specific research questions, particularly in pharmaceutical development where surface properties can significantly influence drug efficacy, stability, and delivery mechanisms.
Each technique operates on different physical principles: XPS relies on the photoelectric effect, AES utilizes the Auger emission process, and SIMS is based on sputtering and ionization of surface atoms. These fundamental differences result in varying capabilities for elemental detection, chemical state information, molecular analysis, detection sensitivity, spatial resolution, and depth profiling. This guide provides a comprehensive comparison of these techniques, supported by experimental data and protocols, to enable researchers to make informed decisions for their specific analytical needs.
Technical Comparison of XPS, AES, and SIMS
The following table summarizes the key characteristics and capabilities of XPS, AES, and SIMS for surface analysis:
Table 1: Comparison of Surface Analysis Techniques
| Parameter | XPS | AES | SIMS |
|---|---|---|---|
| Primary Information | Elemental identity & chemical state [10] | Elemental composition [11] [12] | Elemental, isotopic, & molecular composition [13] [14] |
| Chemical State Information | Excellent [10] | Minimal [11] | Limited (except in Static SIMS) [13] |
| Molecular Information | Indirect through chemical shifts | Very limited | Excellent, especially Static SIMS [13] |
| Detection Limits | 0.1-1 at% (can reach 0.01 at% in favorable cases) [15] | 0.1-1 at% [11] | ppm to ppb range [13] [14] |
| Depth Resolution | ~5-10 nm [10] | Top 3-10 nm [11] | 1-2 nm [13] |
| Lateral Resolution | 10-200 μm (can reach 200 nm with synchrotron) [10] | ≥10 nm [11] | Down to 40 nm [14] |
| Elements Detected | All except H and He [10] [16] | All except H and He [11] | All elements including H [13] [14] |
| Primary Damage | Low to moderate (X-ray degradation) [10] | Moderate (electron beam damage) | High (sputtering inherent) [13] |
| Quantitative Accuracy | Excellent (90-95% for major peaks) [10] | Semi-quantitative [11] | Requires standards due to matrix effects [13] |
Table 2: Detection Limits Comparison for Selected Elements
| Element | XPS | AES | SIMS |
|---|---|---|---|
| Light Elements (C, N, O) | 0.1-1 at% [15] | 0.1-1 at% [11] | ppb range [14] |
| Heavy Elements in Light Matrix | ~0.01 at% [15] | ~0.1 at% [11] | ppt-ppb range [13] |
| Light Elements in Heavy Matrix | ~3 at% [15] | ~1 at% [11] | ppb-ppm range [13] |
Experimental Protocols and Methodologies
X-Ray Photoelectron Spectroscopy (XPS) Protocol
XPS operates based on the photoelectric effect, where X-rays irradiate a sample, ejecting photoelectrons whose kinetic energies are measured to determine binding energies and elemental identification [10]. A standard XPS experimental protocol involves multiple well-defined steps:
Sample Preparation: Samples must be compatible with ultra-high vacuum (UHV) conditions (typically 10⁻⁶ to 10⁻⁹ Pa) [10]. Conducting samples can be mounted directly, while insulating materials may require charge compensation methods such as low-energy electron floods. Sample size is instrument-dependent, with modern systems handling samples from millimeters to several centimeters in dimension [10] [16].
Instrument Setup: Select appropriate X-ray source (typically monochromatic Al Kα at 1486.7 eV or Mg Kα at 1253.7 eV) [10]. The choice depends on the elements of interest and potential overlaps with Auger peaks. Configure the analyzer pass energy based on required resolution (higher pass energy for survey scans, lower for high-resolution regions).
Data Acquisition:
- Begin with a survey scan (0-1100 or 0-1400 eV binding energy) to identify all detectable elements, typically requiring 1-20 minutes [10].
- Acquire high-resolution regional scans for elements of interest with sufficient signal-to-noise ratio, typically requiring 1-15 minutes per region [10].
- For depth profiling, combine with argon ion sputtering (monoatomic or cluster ions) to remove surface layers sequentially [1]. Cluster ions are preferred for organic materials to reduce damage.
Data Analysis: Process data using peak fitting with appropriate background subtraction (e.g., Shirley or Tougaard backgrounds). Quantification is performed using peak areas corrected with relative sensitivity factors (RSFs) [10] [15].
Auger Electron Spectroscopy (AES) Protocol
AES utilizes a focused electron beam (3-25 keV) to excite atoms, which then relax through the emission of Auger electrons [11] [12]. The standard AES protocol includes:
Sample Preparation: Similar to XPS, samples must be UHV-compatible. AES is particularly challenging for insulators due to charging effects, and the technique is generally not recommended for bulk insulating materials [17]. Samples should be sufficiently conducting to dissipate the electron beam charge.
Instrument Setup: Select primary beam energy (typically 3-25 keV) and current based on required spatial resolution and analytical sensitivity. Higher beam energies provide better spatial resolution but may increase sample damage. Configure the electron energy analyzer (typically cylindrical mirror analyzer) [12].
Data Acquisition:
- Locate areas of interest using secondary electron imaging [11].
- Acquire point spectra from specific locations or perform mapping by rastering the electron beam.
- Auger spectra are often displayed in derivative mode (dN(E)/dE) to enhance visibility of small peaks on a high background [12].
- For depth profiling, combine with inert gas sputtering (typically argon) to remove material sequentially [11].
Data Analysis: Elemental identification based on characteristic kinetic energies. Semi-quantitative analysis using sensitivity factors, with more accurate quantification requiring comparison to standard samples of known composition [11] [12].
Secondary Ion Mass Spectrometry (SIMS) Protocol
SIMS uses a focused primary ion beam to sputter material from the surface, with a fraction of the ejected particles being ionized and analyzed by a mass spectrometer [13] [14]. The protocol varies significantly between static and dynamic modes:
Sample Preparation: Samples must be UHV-compatible. SIMS can analyze any solid material, including insulators, semiconductors, and metals [14]. Careful consideration of electrical properties is needed for insulating samples to maintain surface potential stability.
Instrument Setup: Select primary ion species based on application:
- Oxygen primary ions (O₂⁺, O⁻) enhance positive secondary ion yields [14].
- Cesium primary ions (Cs⁺) enhance negative secondary ion yields [14].
- Liquid metal ion guns (LMIG) with Ga, Au, or Bi provide high spatial resolution (<50 nm) [13].
- Cluster ion sources (C₆₀⁺, Ar₇₀₀⁺) reduce damage for organic analysis [13].
Data Acquisition:
- Static SIMS: Use very low primary ion dose density (<10¹³ ions/cm²) to preserve molecular information from the top monolayer [13]. Typically uses time-of-flight (ToF) mass analyzers for simultaneous detection of all masses.
- Dynamic SIMS: Use higher primary ion currents for depth profiling, sacrificing surface molecular information but enabling bulk composition analysis and depth distribution measurements of trace elements [14].
Data Analysis: Mass spectra are interpreted based on mass-to-charge ratios. Quantification requires comparison with matrix-matched standards due to strong matrix effects on ion yields. Use relative sensitivity factors (RSFs) derived from standards for quantitative analysis [14].
Figure 1: Surface analysis technique selection workflow based on primary information requirements.
Essential Research Reagent Solutions
Successful surface analysis requires not only sophisticated instrumentation but also appropriate reference materials and reagents for calibration and quantification. The following table outlines essential research reagents and their functions:
Table 3: Essential Research Reagents for Surface Analysis
| Reagent/Material | Function | Application Notes |
|---|---|---|
| Certified Standard Reference Materials | Quantification calibration | Required for accurate SIMS quantification; useful for AES and XPS [13] [14] |
| Argon Gas (High Purity) | Sputtering for depth profiling | Used in all three techniques for depth profiling [16] [1] |
| Conductive Coatings (Au, C) | Charge compensation for insulating samples | Used cautiously in AES and XPS; problematic for SIMS [17] |
| Relative Sensitivity Factors (RSFs) | Quantitative analysis | Database required for XPS and AES quantification; matrix-specific for SIMS [10] [14] [15] |
| Charge Compensation Flood Sources | Neutralizing surface charge | Essential for analyzing insulating samples in XPS; challenging for AES [10] [17] |
| Primary Ion Beams (O₂, Cs, C₆₀, Ar clusters) | Sputtering and ionization | SIMS requires specific primary ions tailored to application [13] [14] |
Advanced Applications and Case Studies
Combined XPS and TOF-SIMS Analysis of Battery Materials
A compelling case study demonstrating the complementary nature of these techniques involves the analysis of engineered particle (Ep) battery cathodes [8]. Researchers combined XPS and Time-of-Flight SIMS (TOF-SIMS) to understand how specialized coatings stabilize cathode-electrolyte interfaces in high-voltage lithium cobalt oxide (LCO) systems. In this workflow:
- XPS provided chemical state information of the transition metals and oxidation states at the cathode surface before and after electrochemical cycling [8].
- TOF-SIMS delivered high-resolution mapping of organic and inorganic species distribution across the electrode surface, identifying spatial distribution of degradation products [8].
- The combination revealed how Ep coatings create more uniform interfaces that reduce side reactions and transition metal dissolution, leading to improved battery performance and longevity [8].
This approach exemplifies how technique synergy provides insights unattainable by any single method, particularly for complex, multi-component systems.
Depth Profiling of Thin Films and Interfaces
Depth profiling represents a critical application for all three techniques, with each offering distinct advantages:
XPS Depth Profiling: When combined with argon cluster ion sputtering, XPS can provide chemical state information as a function of depth with minimal damage, particularly valuable for organic materials and polymers [1]. The main challenges include ion-induced mixing, preferential sputtering, and surface roughening that must be accounted for during data interpretation [1].
AES Depth Profiling: AES offers excellent spatial resolution for depth profiling of small features, with the ability to characterize particles and defects smaller than 25 nm [11]. This makes it invaluable for failure analysis in microelectronics and investigation of grain boundary chemistry in metallurgical applications [11] [17].
SIMS Depth Profiling: Dynamic SIMS provides the highest sensitivity for trace element depth distribution, with detection limits reaching ppb levels [14]. This exceptional sensitivity makes it the technique of choice for dopant and contaminant profiling in semiconductors, with depth resolution reaching sub-nanometer levels when using low-energy primary ions [14].
Technique Selection Guidelines
Selecting the appropriate surface analysis technique requires careful consideration of research objectives, sample properties, and information requirements. The decision process should address the following key questions:
What is the primary information needed?
What are the detection limit requirements?
What is the sample type?
Is depth information required?
What is the required spatial resolution?
For complex analytical challenges, a combined approach utilizing multiple techniques often provides the most comprehensive understanding of material properties and behavior.
This guide provides a comparative analysis of three principal surface analysis techniques: X-ray Photoelectron Spectroscopy (XPS), Auger Electron Spectroscopy (AES), and Secondary Ion Mass Spectrometry (SIMS). For researchers and drug development professionals, selecting the appropriate technique is critical for characterizing material surfaces, thin films, and interfaces. The following data, protocols, and visualizations will aid in making an informed choice based on key performance metrics.
Comparative Performance Metrics at a Glance
The table below summarizes the core performance characteristics of XPS, AES, and SIMS, providing a high-level overview for initial technique evaluation [18] [19] [5].
| Performance Metric | XPS (X-ray Photoelectron Spectroscopy) | AES (Auger Electron Spectroscopy) | SIMS (Secondary Ion Mass Spectrometry) |
|---|---|---|---|
| Information Depth | ~3 monolayers (≈10 Å) [18] | ~3 monolayers (≈10 Å) [18] | ~10 monolayers [18] |
| Detection Limits | ~0.1 at% (1000 ppm) [19] [5] | ~0.1 at% (1000 ppm) [19] [5] | Parts-per-billion (ppb) to parts-per-million (ppm) range [18] |
| Spatial Resolution | Tens of micrometers (conventional); sub-micrometer (small-spot systems) [9] | Can be better than 5 nm [18] | High (elemental mapping capability) [18] |
| Chemical State Information | Yes, a key strength [20] | Limited [5] | Limited, complex due to ion-induced effects |
| Depth Profiling | Yes, with sputtering; maximal depth ~500 nm [18] | Yes, excellent with sample rotation [9] | Yes, inherent to the technique [18] |
| Typical Sputtering Rate | Slow (nm/min) [18] | Not specified in results | Slow (nm/min) [18] |
Detailed Metrics and Experimental Protocols
Beyond the high-level overview, a deeper understanding of each metric and how it is determined is essential for rigorous experimental planning.
Analysis Depth & Depth Profiling
The analysis depth defines the thickness of the surface layer from which the analytical signal originates. For depth profiling, this involves repeated surface removal and analysis to characterize layered structures.
- XPS & AES Information Depth: The analysis depth for XPS and AES is limited by the escape depth of the ejected electrons, which is typically on the order of a few nanometers (≈3-10 monolayers) [18]. This makes them highly surface-sensitive.
- SIMS Information Depth: SIMS can probe slightly deeper, up to about 10 monolayers, as the analysis involves the ejection of atoms from the surface [18].
- Experimental Protocol for Depth Profiling:
- Sputter Ion Beam Setup: A focused ion beam (often Ar⁺) is directed at the sample surface to erode material. The ion energy and current density must be optimized to balance sputtering rate and depth resolution [9].
- Data Acquisition Cycle: The instrument alternates between sputtering for a fixed time to remove a layer and performing surface analysis (XPS, AES, or SIMS) on the newly exposed surface.
- Sample Rotation (for AES/XPS): For AES and XPS, sample rotation during sputtering is a critical methodological improvement. It reduces ion-beam-induced topography (e.g., roughening, ripples) by continuously changing the angle of incidence, leading to a higher depth resolution that is independent of the sputtered depth [9].
- Crater Edge Effects: A key challenge in XPS depth profiling is the large analyzed area, which can lead to signal distortion from the sloping sides of the sputter crater. Precise alignment of the X-ray probe, analyzed spot, ion beam, and rotation axis is crucial to mitigate this [9].
Sensitivity & Detection Limits
Sensitivity refers to the minimum amount of an element or isotope that can be detected.
- SIMS Superiority: SIMS offers the highest sensitivity of the three techniques, with detection limits in the parts-per-billion (ppb) to parts-per-million (ppm) range across the periodic table. This is due to its high efficiency in ejecting and detecting ions from the topmost layers [18].
- XPS and AES: These techniques have more modest detection limits, typically around 0.1 atomic percent (1000 ppm) [19] [5].
- Experimental Protocol for Determining Detection Limits:
- Calibration Standards: Use a series of reference materials with known, low concentrations of the analyte in a relevant matrix.
- Signal Measurement: Acquire multiple spectra from the standard materials under identical, optimized instrument conditions.
- Calibration Curve: Plot the measured signal intensity against the known concentration.
- Limit Calculation: The detection limit is typically calculated as the concentration that yields a signal three times the standard deviation of the background signal from a blank or ultra-low concentration sample.
Spatial Resolution
Spatial resolution defines the smallest feature size that can be chemically resolved on the sample surface.
- AES Superiority: AES can achieve the highest spatial resolution, with modern field-emission systems capable of resolutions on the order of 5 nm. This is because the incident electron beam can be focused to a very small spot [18].
- XPS Limitations: Conventional XPS analyzes an area of tens of micrometers. While "small-spot" XPS systems exist, the analyzed area is still generally much larger than in AES, which also makes it more susceptible to crater-edge effects during depth profiling [9].
- SIMS: SIMS also provides high spatial resolution, sufficient for creating element-specific maps of the sample surface [18].
- Experimental Protocol for Spatial Resolution Measurement:
- Standard Sample: Use a certified reference material with well-defined, small-scale features, such as a gold-coated diffraction grating.
- Line Scan: Perform a high-magnification image or a line scan across a sharp edge between two chemically distinct phases.
- Data Analysis: The spatial resolution is often reported as the distance over which the signal intensity changes from 16% to 84% (or 20% to 80%) when scanning across the sharp edge.
Technique Selection Workflow
The following diagram illustrates a logical decision-making process for selecting the most appropriate surface analysis technique based on primary research questions. This workflow synthesizes the comparative performance data to guide researchers.
The Scientist's Toolkit: Essential Research Reagents & Materials
Successful surface analysis requires not only sophisticated instruments but also a suite of essential materials and reagents for sample preparation, calibration, and analysis.
| Item Name | Function & Application |
|---|---|
| Argon Gas Supply | High-purity argon is used in ion guns for sputtering during depth profiling in XPS and AES, and as the sputtering gas in GDOES comparisons [18]. |
| Primary Ion Source (e.g., Cesium, O₂⁺) | These ion beams are used in SIMS to sputter and eject secondary ions from the sample surface. The choice of ion species can significantly enhance the yield of positive or negative secondary ions [18]. |
| Conductive Adhesive Tapes | Used for mounting insulating samples to prevent surface charging during analysis with electron or ion beams. Crucial for non-conductive samples in AES and XPS [18]. |
| Certified Reference Materials | Standards with known composition and concentration are essential for quantitative analysis, calibrating instrument response, and determining detection limits for all techniques. |
| Sample Stubs & Holders | Specialized holders are designed for specific instruments to ensure good electrical contact, precise positioning, and, where applicable, sample rotation during depth profiling [9]. |
| Charge Neutralization Filament | A low-energy electron flood gun is used in XPS to neutralize charge buildup on insulating samples, ensuring accurate binding energy measurements [18] [20]. |
The choice between XPS, AES, and SIMS is not a matter of identifying a single "best" technique, but rather selecting the right tool for a specific analytical question. XPS is unparalleled for quantifying chemical states. AES provides superior spatial resolution for nanoscale analysis. SIMS offers the ultimate sensitivity for detecting trace elements and isotopes. Modern research often benefits from a complementary approach, using two or more techniques on the same sample to build a comprehensive picture of its surface composition and chemistry.
Surface analysis techniques are fundamental to advancements in materials science, nanotechnology, and semiconductor development. These techniques provide critical information about the outermost layers of a material, where crucial interactions occur that dictate properties like adhesion, corrosion resistance, and electronic functionality [21]. Among the most prominent methods are X-ray Photoelectron Spectroscopy (XPS), Auger Electron Spectroscopy (AES), and Secondary Ion Mass Spectrometry (SIMS). The landscape of these techniques is continuously evolving, driven by technological innovations and shifting research demands. This guide provides an objective comparison of XPS, AES, and SIMS, framing their performance within current publication and adoption trends. It is designed to assist researchers and scientists in selecting the optimal technique for their specific analytical challenges by presenting structured data, detailed methodologies, and a clear framework for decision-making.
Comparative Analysis of Surface Techniques
A comprehensive understanding of the strengths and limitations of XPS, AES, and SIMS is essential for effective technique selection. The following table summarizes their core characteristics based on current technological capabilities.
Table 1: Technical Comparison of XPS, AES, and SIMS
| Feature | XPS/ESCA | AES | SIMS |
|---|---|---|---|
| Primary Information | Elemental composition, chemical state, empirical formula [22] [21] | Elemental composition, some chemical information [23] | Elemental, isotopic, and molecular species; depth profiling [23] [24] |
| Detection Limits | ~0.1 atomic % (parts per thousand) [25] | Parts per thousand (ppt) range [23] | Parts per billion (ppb) to parts per million (ppm) [23] |
| Depth Resolution | ~10 nm information depth; depth profiling with sputtering [21] | ~ nm scale for depth profiling [23] | Excellent (nm scale); 1-3 monolayers (static); down to 1 nm (profiling) [23] [24] |
| Lateral Resolution | >10 µm; imaging down to ~1 µm [21] | <10 nm [23] | Sub-micrometer (down to 0.2 µm) [23] [24] |
| Chemical State Info | Excellent, via chemical shifts [23] [21] | Moderate, via Auger peak shapes [23] | Limited, as sputtering breaks molecular bonds [23] |
| Quantitation | Straightforward and quantitative [23] [25] | Straightforward, with corrections [23] | Difficult; requires calibrated standards [23] |
| Elements Detected | All except hydrogen and helium [23] [25] | Cannot detect hydrogen or helium [23] | Full periodic table, including H, plus molecular species [23] [24] |
| Sample Environment | Ultra-high vacuum [22] [25] | High vacuum [23] | Ultra-high vacuum [23] [24] |
| Sample Damage | Less destructive (photon excitation) [23] | Can cause beam damage (electron excitation) [23] | Destructive (sputtering process) [23] |
Key Technological and Adoption Trends
The application of these techniques is influenced by broader market and research trends. The global surface analysis market is a multi-billion dollar industry, projected to grow at a CAGR of 5.18% [26]. Specific trends impacting XPS, AES, and SIMS include:
- Automation and AI Integration: The integration of artificial intelligence and machine learning for data interpretation and automation is enhancing precision and efficiency, transforming operational workflows [27] [26]. Automation in XPS sample loading has reduced turnaround time by 42% in high-volume testing centers [27].
- Multi-Technique Platforms: There is a growing trend of 22% in the use of multi-technique platforms that integrate XPS, AES, and SIMS to address cross-correlation needs for advanced nanostructure verification [27].
- Demand for High-Resolution: Demand for high-resolution monochromatic XPS systems has risen by 34% within three years due to growing requirements for surface chemistry analysis in nanotechnology [27].
- Semiconductor Drive: The relentless drive for semiconductor miniaturization, with nodes advancing below 7 nm, is a key driver. This requires extremely precise surface characterization, as contamination layers under 0.5 nm can disrupt device yields [27].
Experimental Protocols for Technique Validation
To ensure reliable and reproducible results, standardized experimental protocols must be followed. Below are detailed methodologies for key analyses cited in comparative studies.
XPS for Chemical State Identification
Objective: To determine the elemental composition and chemical bonding states of a silicon-based sample (e.g., a wafer with a thermal oxide layer).
Materials & Reagents:
- Sample: Silicon wafer piece (< 1x1 cm).
- Mounting: Conductive double-sided tape or a dedicated sample stub.
- Charge Neutralizer: Low-energy electron flood gun, required for insulating samples.
Procedure:
- Sample Preparation: Clean the sample with solvents (e.g., isopropanol) to remove atmospheric contaminants and dry in a clean environment. Mount the sample securely on the holder.
- Loading: Introduce the sample into the ultra-high vacuum (UHV) introduction chamber of the XPS instrument (pressure ≤ 1×10⁻⁹ Torr) [25].
- Pump-down: Allow the system to reach UHV in the analysis chamber.
- Data Acquisition:
- Select an analysis area (e.g., 500 x 500 µm).
- Excite the surface with a monochromatic Al Kα X-ray source (1486.6 eV).
- Acquire a wide energy range survey scan (e.g., 0-1100 eV binding energy) to identify all elements present.
- Acquire high-resolution, narrow scans for the elements of interest (e.g., Si 2p, O 1s, C 1s).
- Data Analysis:
- Use software to calibrate the spectrum to a known peak (e.g., adventitious carbon C 1s at 284.8 eV).
- Identify elements from the peak positions in the survey scan.
- Analyze the high-resolution Si 2p spectrum. Deconvolute the peak to identify contributions from elemental silicon (Si⁰, ~99.3 eV) and silicon dioxide (Si⁴⁺, ~103.3 eV) based on their chemical shifts [22].
SIMS for High-Sensitivity Depth Profiling
Objective: To obtain a depth profile of a dopant (e.g., Boron) in a semiconductor layer structure with high sensitivity and depth resolution.
Materials & Reagents:
- Sample: Semiconductor cross-section.
- Primary Ion Source: Cs⁺ or O⁻ ion source for enhanced negative or positive secondary ion yields, respectively.
- Reference Standard: A matrix-matched standard with a known concentration of the dopant for quantification.
Procedure:
- Sample Preparation: Cleave or cross-section the sample to expose the region of interest. Ensure it is clean and mount securely.
- Loading: Load the sample into the UHV chamber of the SIMS instrument.
- Instrument Setup:
- Select a primary ion beam (e.g., Cs⁺ for analyzing Boron as B⁻ secondary ions).
- Raster the primary beam over a defined area (e.g., 200 x 200 µm).
- Set the mass spectrometer to detect the specific isotope of interest (e.g., ¹¹B⁻).
- Define the data collection cycle time.
- Data Acquisition:
- Start the primary ion beam to begin sputtering a crater into the sample.
- Continuously monitor the secondary ion signal of the dopant and the substrate matrix as a function of time.
- Data Conversion:
- After the analysis, measure the crater depth with a profilometer.
- Convert the sputtering time to depth using the measured crater depth and the total sputter time.
- Convert the secondary ion counts to concentration using the Relative Sensitivity Factor (RSF) derived from the standard [23].
AES for High-Spatial Resolution Mapping
Objective: To map the lateral distribution of a specific element on a metallized sample with sub-micron resolution.
Materials & Reagents:
- Sample: Conductive or charge-coated sample with micro-features.
- Electron Gun: Field emission gun for high spatial resolution.
Procedure:
- Sample Preparation: The sample must be conductive. If insulating, apply a thin, continuous conductive coating (e.g., carbon).
- Loading: Introduce the sample into the high vacuum chamber of the AES instrument.
- Instrument Setup:
- Select a primary electron beam energy (e.g., 10 keV) and a small beam current to achieve a probe size < 10 nm.
- Locate the area of interest using secondary electron imaging.
- Data Acquisition:
- Select the specific Auger transition peak for the element of interest (e.g., Cu LMM at ~920 eV).
- Perform a raster scan of the focused electron beam over the selected area.
- At each pixel, acquire the Auger electron spectrum or the signal intensity at the specific energy, creating an elemental map.
- Data Analysis:
- Overlay the elemental map on the secondary electron image to correlate elemental distribution with surface topography.
Table 2: Essential Research Reagent Solutions
| Item | Primary Function | Application Notes |
|---|---|---|
| Conductive Tape/Stub | Sample mounting for electrical and thermal contact. | Essential for preventing charging in XPS/AES on insulators. |
| Charge Neutralizer (Flood Gun) | Compensates for surface charging on insulating samples. | Critical for analyzing polymers, ceramics, or oxides with XPS. |
| Primary Ion Source (Cs⁺, O⁻, Ga⁺) | Sputters the sample surface for depth profiling (SIMS, XPS, AES) or primary excitation (SIMS). | The ion species (atomic vs. cluster) affects sputter rate, damage, and molecular information retention. |
| Matrix-Matched Reference Standards | Enables quantitative analysis by providing a calibration reference. | Absolutely essential for achieving accurate quantification in SIMS. |
| Monatomic/Cluster Ion Source (Arn+) | Provides gentle sputtering for organic depth profiling in XPS and SIMS. | Preserves chemical information while depth profiling soft materials. |
A Decision Framework for Technique Selection
The choice between XPS, AES, and SIMS is not a matter of which technique is superior, but which is most appropriate for the specific analytical question. The following diagram and explanation provide a logical pathway for this decision.
Diagram 1: Surface analysis technique selection guide.
Navigating the Decision Tree:
- Pursue XPS when the analytical problem requires definitive information on chemical bonding states, oxidation, or empirical formula determination. It is the preferred tool for quantifying surface composition and understanding chemical reactions at interfaces, such as in corrosion studies, catalyst analysis, or polymer surface modification [28] [21].
- Choose SIMS when the highest sensitivity for trace elements or isotopes is needed, or when detailed depth profiling with excellent depth resolution is the primary requirement. Its ability to detect hydrogen and its ppm to ppb detection limits make it indispensable for dopant profiling in semiconductors and contamination analysis [23] [24].
- Select AES when high spatial resolution for elemental analysis is paramount, such as for analyzing individual grain boundaries, sub-micron particles, or specific defects on a surface [23].
- Opt for a Combined Approach for the most comprehensive understanding. Many advanced research problems require correlative data. For example, using XPS to determine the chemical state of a surface layer and then using SIMS to profile the same layer to see how that chemistry changes with depth [27] [23].
XPS, AES, and SIMS are powerful, complementary techniques that form the cornerstone of modern surface analysis. XPS excels in quantitative chemical state analysis, SIMS offers unparalleled sensitivity and depth resolution, and AES provides superior spatial resolution for elemental mapping. The evolving landscape is characterized by the integration of these techniques into multi-modal platforms, enhanced by automation and AI-driven data analysis. As materials and devices continue to become more complex, particularly in fields like semiconductors and nanotechnology, the synergistic use of XPS, AES, and SIMS will be crucial for driving innovation and ensuring product quality and performance. Researchers are empowered to make informed decisions by applying the comparative data and the logical selection framework provided in this guide.
Choosing the Right Tool: Application-Oriented Analysis of XPS, AES, and SIMS
XPS for Biomaterial Biocompatibility and Chemical State Analysis
The biological performance of a biomaterial is fundamentally determined by its surface properties. Biocompatibility starts at the surface, where interactions with proteins, cells, and biological fluids occur. The chemical composition, molecular orientation, presence of functional groups, and microdomain distribution at the topmost layer of a material directly influence critical processes like protein adsorption, cell attachment, and biofilm formation [29] [30]. Consequently, detailed surface chemical analysis is indispensable for understanding and controlling the biological response to synthetic materials.
Among the available analytical techniques, X-ray Photoelectron Spectroscopy (XPS), also known as Electron Spectroscopy for Chemical Analysis (ESCA), has emerged as a cornerstone for biomaterial characterization. Its exceptional sensitivity to elemental composition and chemical state information makes it particularly powerful. This guide objectively evaluates the performance of XPS against other major surface analysis techniques—Auger Electron Spectroscopy (AES) and Secondary Ion Mass Spectrometry (SIMS)—within the context of biomaterial research. The comparison focuses on their capabilities in providing the data necessary to ensure biocompatibility and optimize material performance for drug delivery systems, medical implants, and other biomedical applications [31] [32] [33].
Comparative Analysis of XPS, AES, and SIMS
Each surface analysis technique offers unique strengths and limitations. The choice between them depends on the specific information required, such as elemental vs. molecular data, surface vs. depth sensitivity, or qualitative vs. quantitative analysis.
Table 1: Overall Technique Comparison for Biomaterial Analysis
| Feature | XPS (ESCA) | AES | SIMS |
|---|---|---|---|
| Primary Information | Elemental composition, empirical formula, chemical state, electronic state [31] [32] | Elemental composition, focusing on Auger transitions [34] | Elemental and molecular structure, isotopic information [29] [30] |
| Underlying Principle | Photoelectric effect [34] | Auger effect [34] | Emission of secondary ions via ion sputtering [5] |
| Depth of Analysis | Top few nanometers (highly surface-sensitive) [34] | Slightly deeper than XPS, but still surface-sensitive [34] | Top monolayer (static SIMS) to deep depth profiling (dynamic SIMS) |
| Spatial Resolution | High lateral and depth resolution [34] | Good lateral resolution, may have lower depth resolution than XPS [34] | High spatial resolution, capable of high-resolution imaging [30] |
| Quantitative Capability | Excellent; provides quantitative data on elemental composition and chemical states [32] | Good for elemental composition [5] | Semi-quantitative; can be hampered by matrix effects [5] |
| Chemical State Info | Excellent; directly identifies oxidation states and functional groups [31] | Limited; less effective for chemical state analysis compared to XPS [5] | Good; fragments can indicate molecular structure and functional groups [29] |
| Key Biomaterial Applications | Surface functionalization, implant analysis, protein adsorption, biocompatibility studies [32] | Metallurgy, semiconductor analysis, thin-film characterization [34] | Characterization of surface-bound proteins, polymer additives, and biological spatial distributions [29] [30] |
Key Performance Differentiators
- Chemical State Information: XPS excels at determining the chemical state of elements, which is crucial for understanding surface functionality. For instance, it can distinguish between C-C/C-H, C-O/C-N, and O=C-O/O=C-N bonds in polymers or proteins, providing insight into surface chemistry that directly affects biocompatibility [30] [32]. AES provides limited chemical state information, while SIMS infers chemistry from molecular fragment patterns [29] [5].
- Detection Sensitivity and Quantification: XPS is highly reliable for quantitative analysis of elemental surface composition. AES also provides good quantitative data. In contrast, SIMS, while extremely sensitive (often to ppm/ppb levels), suffers from matrix effects that can make quantification challenging without standardized reference materials [5].
- Depth Profiling and Spatial Resolution: For in-depth analysis, SIMS is the superior technique for depth profiling of multi-layered structures. AES can also perform effective depth profiling. While XPS can perform depth profiling via ion sputtering, it is less refined for this purpose compared to SIMS and AES [5]. AES typically offers the best lateral resolution for elemental mapping, followed by SIMS and then XPS [34].
Experimental Protocols for Biomaterial Analysis
Standardized protocols are essential for obtaining reliable and reproducible surface analysis data, especially for complex biological interfaces.
Sample Preparation for Hydrated Biomaterials
A significant challenge in analyzing biomaterials is that they function in hydrated environments, while techniques like XPS and SIMS require ultra-high vacuum (UHV). Simply drying the sample can alter its surface structure. To address this, cryogenic preparation methods have been developed [35] [30].
- Fast-Freezing: The hydrated biomaterial sample is rapidly frozen in a suitable medium, a process that vitrifies the water, preserving the spatial structure and composition of the surface.
- Transfer and Analysis: The frozen-hydrated sample is transferred under vacuum to the spectrometer stage, which is maintained at cryogenic temperatures (e.g., liquid nitrogen). Analysis is then performed on the frozen surface, preventing dehydration-induced artifacts [35].
Protocol for Protein Adsorption Studies
Understanding protein adsorption is a cornerstone of biocompatibility assessment. A powerful multi-technique protocol involves:
- Surface Modification: Create a series of model surfaces with controlled functionalities (e.g., -CH3, -OH, -COOH) using methods like self-assembled monolayers (SAMs) or plasma polymerization [30].
- Protein Exposure: Incubate these surfaces in a solution containing a single protein or complex mixture (e.g., blood plasma) for a defined time and temperature.
- Radiolabeling (Quantification): Use 125I radiolabeling of proteins as the "gold standard" to determine the absolute amount of protein adsorbed onto the surface [30].
- XPS Analysis (Thickness and Composition): Analyze the protein-coated surfaces with XPS. The atomic % nitrogen (N) signal, which is unique to the protein layer, can be used to calculate film thickness. The radiolabeling data calibrates the XPS composition, enabling accurate thickness determination [30].
- SIMS Analysis (Molecular Information): Perform static ToF-SIMS analysis on the same samples. The unique fragmentation patterns from different amino acids can help identify the proteins present and provide clues about their conformation and orientation on the surface [30].
Table 2: Essential Research Reagent Solutions for Biomaterial Surface Analysis
| Reagent/Material | Function in Research |
|---|---|
| Self-Assembled Monolayers (SAMs) | Creates well-defined, chemically controlled model surfaces to systematically study the effect of specific functional groups on protein adsorption and cell adhesion [30]. |
| Polymeric Biomaterials (e.g., Polyurethanes, PMMA) | Representative classes of biopolymers used as test substrates for surface modification and to correlate surface characterization with bio- and blood-compatibility [29]. |
| 125I-Radiolabeled Proteins | Provides an absolute quantitative measure of the amount of protein adsorbed onto a material surface, used to calibrate data from XPS and other techniques [30]. |
| Trehalose Coating | A sample preparation method where a disaccharide (trehalose) is used to coat and preserve the native state of biological samples (e.g., cells, proteins) for analysis under UHV conditions [30]. |
| Cryogenic Preparation Stage | A specialized instrument accessory that allows for the fast-freezing and analysis of hydrated biomaterials, preventing structural collapse and preserving the interface as it exists in an aqueous environment [35]. |
Protocol for Surface Contamination and Cleanliness Analysis
Surface contamination can severely compromise biomaterial performance. XPS provides a direct method for assessment.
- Survey Scan: Acquire a wide energy range scan (e.g., 0-1200 eV binding energy) to identify all elements present on the surface.
- High-Resolution Scans: Perform high-resolution scans on key elements (like C 1s, O 1s, N 1s) to determine their chemical states.
- Data Interpretation: A high-resolution C 1s spectrum is particularly informative. A dominant C-C/C-H peak often indicates hydrocarbon contamination. Peaks for C-O, C=O, and O-C=O confirm the presence of organic contaminants and can help identify their source. The absence of expected elements or the presence of unexpected ones (like Si on a polymer surface) indicates issues with processing or handling [29] [32].
Analytical Workflows and Data Interpretation
The integration of multiple techniques often provides the most comprehensive understanding of a biomaterial's surface. The following diagram illustrates a typical workflow for a full surface characterization project.
Case Study: Characterizing a Coated Titanium Implant
Consider a titanium alloy (e.g., Ti6Al4V) implant with a surface coating designed to enhance bone integration.
- XPS Analysis: First, XPS would be used to confirm the successful application of the coating. It would verify the elemental composition and, crucially, prove the formation of the desired chemical states. For a titanium dioxide-based coating, XPS can distinguish the presence of TiO2 from other oxides of alloying elements and confirm its oxidation state, which is critical for its photocatalytic and bioactive properties [35].
- SIMS Analysis: Subsequently, ToF-SIMS would be employed to image the homogeneity of the coating at a micron or sub-micron scale and to detect any trace-level contaminants or dopants that might have been incorporated during processing. The molecular ion signals can confirm the identity of the coating material.
- AES Analysis (if needed): If the implant had micro-scale features and required very high-resolution elemental mapping of the coating-substrate interface, AES could be used to provide nanoscale information about the distribution of Ti, O, and coating elements.
This multi-technique approach provides a robust dataset to confidently link the implant's surface properties to its in-vitro and in-vivo performance.
XPS, AES, and SIMS are powerful, complementary techniques in the biomaterial scientist's toolkit. XPS stands out for its excellent quantitative capabilities and unparalleled ability to provide chemical state information directly, which is fundamental for understanding surface functionality and biocompatibility. While SIMS offers superior sensitivity, molecular specificity, and imaging capabilities, and AES provides high spatial resolution, XPS remains the primary workhorse for comprehensive surface composition analysis.
The future of biomaterial surface analysis lies in the continued integration of these techniques, along with the development of more advanced sample handling methods like cryo-XPS [35] and sophisticated data analysis protocols such as multivariate analysis (MVA) for ToF-SIMS data [30]. By leveraging the complementary strengths of XPS, AES, and SIMS, researchers can obtain an unprecedentedly detailed view of the biomaterial-biology interface, accelerating the development of safer and more effective medical devices and therapies.
AES for High-Resolution Surface Mapping and Nanoscale Contaminant Identification
Auger Electron Spectroscopy (AES) is a powerful surface-sensitive analytical technique that provides quantitative elemental information from the top surface of solid materials. With an average analysis depth of approximately 5-10 nanometers and lateral spatial resolution as fine as 8 nanometers, AES delivers exceptional capabilities for high-resolution surface mapping and nanoscale contaminant identification [36] [37] [38]. The technique is particularly valuable for industrial and research applications where surface or thin film composition critically determines material performance, including semiconductors, nanomaterials, catalysis, corrosion studies, and thin film coatings [37]. Modern AES instruments, such as the PHI 710 Scanning Auger Nanoprobe, achieve SEM-like ultra-high resolution elemental characterization, making them indispensable tools for advanced materials research and failure analysis [36].
This guide objectively compares AES with two other major surface analysis techniques: X-ray Photoelectron Spectroscopy (XPS) and Secondary Ion Mass Spectrometry (SIMS). Understanding the relative strengths and limitations of these techniques enables researchers to select the optimal methodology for specific analytical challenges, particularly in pharmaceutical development and materials science where surface composition and contamination critically influence product performance and safety.
Technical Comparison of Surface Analysis Techniques
The table below summarizes the key technical parameters of AES, XPS, and SIMS for surface analysis applications:
Table 1: Comparison of Surface Analysis Techniques
| Parameter | AES | XPS | SIMS |
|---|---|---|---|
| Primary Excitation Source | Focused electron beam (2-25 keV) [36] [38] | X-rays [9] [18] | Focused ion beam (2-5 keV) [18] |
| Detected Species | Auger electrons [38] | Photoelectrons [18] | Secondary ions [18] |
| Analysis Depth | 0.4-10 nm [38] | ~3 monolayers (≈10 Å) [18] | ~10 monolayers [18] |
| Lateral Resolution | <8 nm [36] [37] | Larger than AES (even small-spot instruments) [9] | Typically higher than XPS [39] |
| Elemental Range | All elements except H and He [38] | All elements except H [18] | All elements including H [18] |
| Detection Limits | ~0.1-0.5 at% [38] [40] | ~0.1-1 at% | Parts-per-billion to parts-per-million [18] |
| Chemical Bonding Information | Limited | Excellent [18] | Limited molecular information |
| Quantitative Analysis | Semi-quantitative with sensitivity factors [38] | Good with sensitivity factors [18] | Difficult due to matrix effects [18] |
| Depth Profiling | Yes, with monoatomic Ar⁺ sputtering [36] [38] | Yes, with alternating sputtering and XPS analysis [18] | Inherent to technique [18] |
| Sample Environment | Ultra-high vacuum (<10⁻⁹ torr) [38] | Ultra-high vacuum [18] | High vacuum (<10⁻⁷ torr) [18] |
Key Differentiating Factors
Spatial Resolution vs. Analytical Area: AES excels with sub-10 nm spatial resolution for elemental mapping, while XPS analyzes much larger areas even in small-spot instruments, making AES superior for nanoscale feature analysis [9] [36]. This capability enables identification of contaminants on the scale of individual nanoparticles.
Chemical State Information: XPS provides comprehensive chemical bonding information, whereas AES primarily delivers elemental composition with limited chemical state data [18]. This makes XPS preferable for studying surface reactivity and oxidation states.
Detection Sensitivity: SIMS offers superior detection limits (ppb-ppm range) compared to AES and XPS (~0.1 at%), making it ideal for trace element and dopant analysis [18].
Experimental Protocols and Methodologies
AES for Nanoscale Contaminant Identification
Sample Preparation:
- Samples must be solids compatible with ultra-high vacuum (UHV) conditions [36]. Non-volatile, stable materials under electron beam irradiation are essential to prevent decomposition during analysis.
- For insulating samples, specialized charge compensation methods are required since traditional conductive coatings interfere with AES analysis [38]. Approaches include using small samples mounted on indium substrates, conductive Si wafers with colloidal graphite paint, or analysis at low beam voltages (1-3 keV) [38].
- Surface cleaning via low-energy Ar⁺ sputtering (typically 0.5-5 keV) removes adventitious carbon contamination present on most "as-received" samples [38].
Data Acquisition:
- High-resolution SEM imaging (up to 20,000× magnification) identifies regions of interest using the electron beam [40].
- Auger elemental maps are acquired by scanning the focused electron beam (typically 2-25 keV) across the sample surface while monitoring specific Auger electron energies characteristic of target elements [36] [38].
- For quantitative analysis, multiplex mode monitors specific energy windows corresponding to elements of interest while sputtering to determine depth profiles [38].
- The PHI 710 instrument achieves 8 nm resolution for AES maps and 3 nm for secondary electron images, enabling precise nanoscale characterization [36].
Data Interpretation:
- Auger spectra typically display the differentiated signal (dN(E)/dE) to enhance peak visibility against the background [38].
- Elemental identification relies on the characteristic kinetic energies of Auger electrons, with quantification using published sensitivity factors or comparison with standards [38].
- Spatial elemental distributions are visualized through color overlays of individual element maps, clearly showing contaminant localization [37].
Comparative Experimental Data
Table 2: Experimental Performance Comparison in Applied Studies
| Application | AES Performance | XPS Performance | SIMS Performance |
|---|---|---|---|
| Thin Film Analysis | Excellent for layer thickness and interfacial analysis [38] | Good for chemical state information at interfaces [18] | Excellent for trace impurities at interfaces [18] |
| Catalyst Characterization (PtNiCo Nanowires) | High-resolution imaging and elemental mapping of individual nanowires [39] | Reveals chemical states influencing surface reactivity [39] | Detects surface-level contamination critical to electrocatalytic activity [39] |
| Depth Profiling (Ni/Cr Multilayer) | High depth resolution independent of sputtered depth with sample rotation [9] | Degradation of depth resolution with sputtered depth due to crater-edge effects [9] | Not specifically reported in search results |
| Oxide Layer Analysis | Light element sensitivity advantageous for oxide characterization [38] | Excellent for chemical state identification in oxides [18] | Matrix effects complicate oxide analysis [18] |
Multi-Technique Approach
Complementary use of multiple techniques provides comprehensive surface characterization. For example, in fuel cell catalyst research (PtNiCo nanowires):
- AES offers high-resolution imaging and elemental mapping of individual nanowires [39].
- XPS reveals chemical states that influence surface reactivity [39].
- TOF-SIMS detects surface-level contamination critical to electrocatalytic activity [39].
This integrated approach delivers insights into surface and subsurface composition, bonding, and contamination essential for optimizing material performance.
Technique Selection Guide
Decision Framework
The following workflow diagram illustrates the technique selection process for surface analysis applications:
Application-Specific Recommendations
Pharmaceutical Contaminant Identification: For particulate contamination on medical devices or drug delivery systems, AES provides unambiguous elemental identification at the nanoscale, crucial for determining contaminant source and composition [37]. When chemical state information is required for understanding reactivity or toxicity, complement with XPS.
Thin Film Pharmaceutical Coatings: AES depth profiling effectively characterizes coating thickness, uniformity, and interfacial layers in controlled-release formulations [38]. The combination with XPS provides additional chemical environment information for polymer-based coatings.
Catalyst and Nanomaterial Development: A multi-technique approach using AES for elemental distribution, XPS for surface chemistry, and SIMS for trace impurities offers comprehensive characterization of advanced nanomaterials [39].
Corrosion and Surface Modification Studies: AES excels in mapping elemental redistribution during corrosion processes and characterizing surface treatments on medical implants [38].
The Scientist's Toolkit: Essential Research Reagents and Materials
Table 3: Essential Materials and Equipment for AES Analysis
| Item | Function/Application | Technical Specifications |
|---|---|---|
| PHI 710 Scanning Auger Nanoprobe | High-resolution AES analysis with SEM imaging | Sub-8 nm spatial resolution, 25 kV max electron beam, UHV compatibility [36] |
| Field Emission Electron Source | Produces finely focused electron beam for high spatial resolution | Enables spot sizes >25 nm, critical for nanoscale mapping [38] [40] |
| Cylindrical Mirror Analyzer (CMA) | Detects and energy-analyzes Auger electrons | High collection efficiency and energy resolution [38] |
| Argon Ion Sputter Gun | Surface cleaning and depth profiling | Monoatomic Ar⁺ source for controlled material removal [36] [38] |
| Indium Mounting Substrates | Sample preparation for insulating materials | Conductive, malleable substrate minimizes charging [38] |
| Conductive Colloidal Graphite Paint | Sample mounting for difficult-to-analyze materials | Provides electrical connection without interfering with analysis [38] |
| Ultra-High Vacuum System | Maintains necessary vacuum for electron detection | Pressure <10⁻⁹ torr to prevent electron absorption and surface contamination [38] |
| Integrated EDS Detector | Complementary bulk elemental analysis | Provides simultaneous bulk composition data [38] |
| Focused Ion Beam (FIB) Attachment | Cross-sectional analysis and sample preparation | Enables subsurface feature access and in situ cross-sections [37] |
AES establishes itself as the premier technique for high-resolution surface mapping and nanoscale contaminant identification when spatial resolution at the sub-10 nm scale is required. Its exceptional capabilities in elemental mapping, combined with depth profiling functionality, make it invaluable for pharmaceutical development, materials science, and failure analysis. However, AES has limitations in chemical speciation and detection sensitivity compared to XPS and SIMS respectively.
The optimal surface analysis approach often involves complementary use of multiple techniques, leveraging the strengths of each method. For comprehensive material characterization, researchers should consider integrated workflows combining AES for nanoscale elemental distribution, XPS for chemical state information, and SIMS for ultimate detection sensitivity. This multi-technique strategy provides the most complete understanding of surface composition and contamination essential for advancing drug development and materials innovation.
ToF-SIMS for 3D Molecular Imaging and Drug Distribution in Complex Systems
In the field of material and life sciences, understanding the molecular composition and distribution within complex systems is paramount. Among the suite of surface analysis techniques available, Time-of-Flight Secondary Ion Mass Spectrometry (ToF-SIMS) has emerged as a powerful tool for label-free molecular imaging, particularly for applications requiring high spatial resolution and detailed chemical information. While X-ray Photoelectron Spectroscopy (XPS) and Auger Electron Spectroscopy (AES) are well-established for elemental and chemical state analysis, ToF-SIMS provides unparalleled capabilities in molecular identification and 3D distribution mapping. XPS is the most commonly used surface technique due to its simpler spectra and ease of quantification, but it does not directly detect hydrogen and helium and offers lower spatial resolution than ToF-SIMS or AES [2]. AES can provide superior chemical information for some systems, like carbon on metals, but both XPS and AES have limitations for molecular analysis compared to ToF-SIMS [2]. The unique strength of ToF-SIMS lies in its high sensitivity, ability to detect all elements including isotopes, and its capacity to provide 3D molecular characterization of organic and biological materials, making it indispensable for advanced research in drug development and complex system analysis.
Technique Comparison: ToF-SIMS vs. XPS vs. AES
The selection of an appropriate surface analysis technique depends heavily on the specific information required. The table below provides a comparative overview of the key characteristics of ToF-SIMS, XPS, and AES.
Table 1: Comparison of Key Surface Analysis Techniques
| Feature | ToF-SIMS | XPS | AES |
|---|---|---|---|
| Primary Probe | Pulsed Primary Ions (e.g., Bin+, Aun+, C60+) [41] | X-rays [28] | Electrons [2] |
| Detected Signal | Secondary Ions (positive or negative) [41] | Photoelectrons [28] | Auger Electrons [2] |
| Chemical Information | Elemental, isotopic, and molecular fragment information [41] [2] | Elemental composition and chemical bonding/oxidation state [28] [2] | Primarily elemental, with some chemical state information [2] |
| Spatial Resolution | Tens to hundreds of nanometers [41] | ~1-10 μm (can be 150 nm at synchrotrons) [2] | Higher than XPS, can be focused to small areas [2] |
| Detection Limits | ppm to ppb range [41] | Typically ~0.1 - 1 at% | Varies, but generally high surface sensitivity |
| Strength in Pharma/Bio | 3D molecular imaging of APIs, lipids, and metabolites [41] [42] | Quantifying elemental surface composition and chemical states [28] | High-resolution elemental mapping and surface chemistry |
The Analytical Power of ToF-SIMS: Principles and Instrumentation
ToF-SIMS operates on the principle of bombarding a sample surface with a pulsed, high-energy primary ion beam. This interaction causes the emission of secondary ions (SIs) from the uppermost atomic layers of the sample. These SIs are then analyzed by a time-of-flight mass spectrometer, where their mass-to-charge ratio (m/z) is determined by measuring their flight time [41] [43]. A key advantage of the ToF analyzer is its ability to acquire a full mass spectrum from a single ion pulse, maximizing ion utilization efficiency and enabling the static analysis of sensitive biological and organic samples [43].
The development of cluster ion sources (e.g., Aun+, Bi3+, C60+) has been a major advancement for biological and organic analysis using ToF-SIMS. Unlike earlier mono-atomic ion beams (e.g., Ga+), cluster ions distribute their kinetic energy over many atoms, resulting in lower energy per atom and significantly reduced damage to organic molecules. This leads to a higher yield of diagnostic molecular ions and larger fragments, enabling the analysis of more complex biological systems [41].
The fundamental output of a ToF-SIMS analysis is a mass spectrum that provides a detailed chemical fingerprint of the sample surface. By rastering the primary ion beam across the sample, a spectrum can be collected at each pixel, allowing for the reconstruction of 2D images showing the spatial distribution of any ion of interest. Furthermore, by combining this with a sputter ion beam that etches the sample, a series of 2D images can be acquired as a function of depth. This depth profiling capability allows for the creation of 3D chemical maps, revealing the internal molecular architecture of a sample with a best-case depth resolution of less than 1 nm [41].
Table 2: Common Primary Ion Sources in ToF-SIMS Bioimaging
| Primary Ions | Cluster Size | Energy | Imaging Resolution | Selected Application Area |
|---|---|---|---|---|
| Aun+ | 3–400 | ~10 keV | < 100 nm | Biological and polymer material imaging, molecular depth profiling [41] |
| Bin+ | 3, 5, 7... | Information Missing | Information Missing | High-resolution molecular imaging [41] |
| C60+ | 60 | Information Missing | Information Missing | Organic and molecular depth profiling [41] |
| (H2O)n+ | Information Missing | Information Missing | Information Missing | Reduced damage for sensitive biological samples [41] |
Experimental Protocols for ToF-SIMS Analysis
Protocol 1: 3D Drug Distribution on Powder Carriers
This protocol details the methodology for determining the 3D distribution of an Active Pharmaceutical Ingredient (API) and a lubricant on inhalation carrier particles, as exemplified in a recent study [42].
- Objective: To determine the 3D distribution of budesonide (API) and magnesium stearate (Mg-stearate) on the surface of lactose carrier particles in a dry powder inhalation formulation.
- Sample Preparation: Adhesive mixture formulations of lactose carrier particles, budesonide, and Mg-stearate are prepared. Particles are mounted on a suitable substrate (e.g., double-sided adhesive tape) for ToF-SIMS analysis.
- Data Acquisition: ToF-SIMS imaging is performed using a pulsed primary ion beam (e.g., a Bi cluster ion source) combined with an argon gas cluster sputter source for depth profiling. The analysis ion beam collects 2D chemical maps from the surface, and the sputter beam then etches away a thin layer of material. This cycle is repeated to build a 3D data cube.
- Data Analysis: The 3D data set is processed to reconstruct the spatial distribution of signals characteristic of budesonide, Mg-stearate, and lactose. The depth profiles are analyzed to estimate the thickness of the Mg-stearate overlayer and to observe the exposure of underlying lactose and budesonide particles with increasing sputter cycles. Complementary XPS analysis is used to independently estimate the Mg-stearate overlayer thickness (estimated at ~5 nm in the cited study) [42].
- Key Findings: The experiment revealed that the carrier particles were largely covered by a thin, continuous layer of Mg-stearate, with only small spots of exposed lactose or budesonide. Depth profiling showed that budesonide exists as discrete particles distributed over the lactose surface, with some evidence of smearing. This clarified that the API is largely covered by the lubricant, which is crucial for understanding drug release and performance [42].
ToF-SIMS 3D Depth Profiling Workflow
Protocol 2: Cryo-ToF-SIMS for Volatile Molecule Tracking
This protocol leverages cryogenic conditions and isotopic labeling to track small, volatile molecules within organic matrices, a technique used to study gas-water-membrane interactions [44].
- Objective: To probe the interactions and 3D distribution of CO₂ and water within a PEEK-ionene membrane using isotopically labeled ¹³CO₂ and D₂O.
- Sample Preparation: A PEEK-ionene membrane sample is cut and clamped onto a specialized, thermally conductive copper sample block. The assembled block is placed in a gas loading unit and purged with 300 psig of ¹³CO₂. For water interaction studies, D₂O is used.
- Cryogenic Freezing: After gas loading, the entire unit is rapidly immersed in liquid nitrogen for fast freezing. This step is critical to immobilize volatile compounds and preserve their in-situ distribution.
- Cryo-ToF-SIMS Analysis: The frozen sample is quickly transferred to a pre-cooled (-140 °C to -150 °C) stage within the ToF-SIMS instrument. Analysis is performed with a pulsed primary ion beam, and 2D images and/or depth profiles are acquired for ions such as ¹²C⁻, ¹³C⁻, H⁻, D⁻, and other relevant fragments to map the distribution of the labeled species.
- Data Analysis: The ratios of isotopic signals (e.g., ¹³C/¹²C) are analyzed and compared to controls. The homogeneity of the D₂O signal indicates the nature of water-membrane interaction, while the absence of ¹³C signal enhancement suggests weak CO₂-membrane interactions, as it vaporizes under vacuum even at low temperatures [44].
- Key Findings: The study demonstrated that cryo-ToF-SIMS could clearly distinguish between the behaviors of CO₂ and water in the membrane. Water (D₂O) showed a homogeneous distribution due to stronger hydrogen bonding, while CO₂ was not retained, indicating weaker interactions. This provides direct insight for designing better CO₂ capture membranes [44].
The Scientist's Toolkit: Essential Reagents and Materials
Successful ToF-SIMS analysis, especially for advanced applications, often relies on specific reagents and materials. The following table details key items used in the experimental protocols cited.
Table 3: Key Research Reagents and Materials for ToF-SIMS Experiments
| Item | Function / Rationale | Example Use Case |
|---|---|---|
| Cluster Ion Sources(e.g., Aun+, Bin+, C60+) | Primary ion beam that increases secondary ion yield of large molecules and reduces fragmentation for clearer molecular signal [41]. | Universal requirement for molecular imaging of organic and biological samples. |
| Isotopically Labeled Compounds(e.g., ¹³CO₂, D₂O) | Allows unambiguous tracking of specific molecules against the natural background; essential for studying diffusion, uptake, and metabolic pathways [44]. | Tracking gas and water diffusion in materials (e.g., PEEK-ionene membranes) [44]. |
| Specialized Cryo-Stage | Cools samples to very low temperatures (e.g., -140°C), reducing vapor pressure to immobilize volatile components and preserve native state [44]. | Analysis of hydrated biological samples, frozen liquids, and volatile compounds. |
| Argon Gas Cluster Sputter Source | A sputter ion beam used for gentle, controlled etching of organic materials, enabling high-resolution depth profiling and 3D analysis [42]. | Creating 3D molecular maps of drug distribution in powder formulations [42]. |
| Thermally Conductive Sample Mounts(e.g., Copper Block) | Ensures efficient cooling of the sample for cryo-analysis, maintaining stable temperature and analytical conditions [44]. | Essential for reliable cryo-ToF-SIMS experiments. |
ToF-SIMS establishes itself as a uniquely powerful technique within the surface analysis arsenal, particularly when the research question demands molecular-specific imaging with high spatial resolution and 3D depth profiling capabilities. While XPS remains the premier technique for quantitative elemental surface composition and chemical state analysis, and AES offers high-resolution elemental mapping, ToF-SIMS fills the critical niche of label-free molecular mapping. Its applications in pinpointing drug distribution in pharmaceutical formulations and tracking small molecules in complex materials underscore its significant value in research and development. As instrumentation continues to advance, with improvements in primary ion sources, vacuum systems, and data processing algorithms, the role of ToF-SIMS in accelerating innovation in drug development, material science, and environmental research is poised to expand even further.
The development of next-generation batteries, particularly all-solid-state batteries (ASSBs) and lithium metal batteries, hinges on a deep understanding of the complex interfacial phenomena at electrode surfaces. These interfaces, such as the solid electrolyte interphase (SEI), dictate critical performance parameters including cycling stability, safety, and charge speed [45]. However, these layers are often buried, chemically heterogeneous, and composed of both organic and inorganic species, making them challenging to characterize. No single analytical technique can provide a complete picture. Consequently, a multimodal approach, combining the complementary strengths of multiple surface analysis techniques, has become indispensable for battery research and development [46] [8].
This guide focuses on the combined application of X-ray Photoelectron Spectroscopy (XPS) and Time-of-Flight Secondary Ion Mass Spectrometry (ToF-SIMS). When used together, they provide a powerful, multi-dimensional view of battery interfaces. XPS excels at providing precise chemical state information and is a quantitative technique, while ToF-SIMS enables high-resolution spatial mapping and exceptional sensitivity for tracking elemental and molecular distributions, even for light elements like lithium [45] [47] [48]. This article will objectively compare the performance of XPS and ToF-SIMS, using a case study on engineered cathode particles to illustrate their synergistic application and provide detailed experimental protocols.
Technique Comparison: XPS vs. TOF-SIMS
The choice between XPS and ToF-SIMS, or the decision to use them in concert, depends on the specific analytical requirements. The table below provides a detailed, side-by-side comparison of their fundamental characteristics.
Table 1: Core Technical Comparison of XPS and ToF-SIMS
| Feature | XPS (X-ray Photoelectron Spectroscopy) | ToF-SIMS (Time-of-Flight Secondary Ion Mass Spectrometry) |
|---|---|---|
| Underlying Principle | Measures kinetic energy of electrons ejected by X-ray irradiation [47]. | Measures mass/charge ratio of ions sputtered from surface by primary ion beam [47] [48]. |
| Primary Information | Elemental identity, quantitative atomic concentration, chemical state/oxidation state [47]. | Elemental, isotopic, and molecular structure information; high-mass resolution [47] [48]. |
| Detection Limits | 0.1% to 1% (atomic) [47]. | Parts-per-million (ppm) to parts-per-billion (ppb) range [47] [48]. |
| Spatial Resolution | ~3 μm for imaging [47]. | ~100 nm or better for imaging [47] [48]. |
| Sampling Depth | 2-10 nm, depending on take-off angle [47]. | <1 nm for molecular ions [47]. |
| Destructive? | Essentially non-destructive. | Inherently destructive during depth profiling. |
| Key Strength | Quantitative chemical state analysis; robust for insulators. | Ultra-high sensitivity and lateral resolution; isotope detection; 3D volume analysis [48]. |
| Key Limitation | Lower spatial resolution and sensitivity compared to ToF-SIMS. | Qualitative/semi-quantitative; complex spectral interpretation; matrix effects. |
Beyond their core specs, the techniques differ significantly in their operational capabilities, particularly for probing beneath the surface. The following table compares their depth profiling methods, which are essential for analyzing battery interphases.
Table 2: Comparison of Depth Profiling Capabilities
| Aspect | XPS Depth Profiling | ToF-SIMS Depth Profiling |
|---|---|---|
| Method | Alternating cycles of ion sputtering (e.g., Ar+, Ar clusters) and XPS analysis [1]. | Continuous or quasi-continuous sputtering with simultaneous mass analysis [49]. |
| Depth Resolution | Can be limited by ion-induced artifacts (mixing, roughening) [1]. | Excellent depth resolution; can be optimized by cluster ions (e.g., Ar(_{1500})+) [49]. |
| Chemical Information | Provides full chemical state data at each depth [45]. | Loses detailed chemical state information; identifies species via mass fragments. |
| Sputter Ion Options | Monoatomic (Ar+), Cluster (Ar(_{n})+) to reduce damage [1]. | Cs+, Ar+, O(2)+, Cluster (Ar({1500})+) for organic preservation [49]. |
Case Study: Stabilizing Battery Cathodes with Engineered Particles
Next-generation lithium metal batteries employing high-voltage cathodes like lithium cobalt oxide (LCO) face significant challenges, including unstable electrode-electrolyte interfaces and cathode material degradation [45] [8]. A promising strategy to mitigate these issues is the use of Engineered Particles (Ep) applied as coatings or integrated into the cathode structure. These particles are designed to stabilize interfaces, reduce side reactions, and enhance battery safety and longevity [8]. The objective of this case study is to understand how Ep-coated cathode chemistry and morphology differ from uncoated electrodes and how these properties evolve during electrochemical cycling. This requires a analytical approach capable of correlating surface chemistry with spatial distribution across complex, layered systems.
Experimental Workflow
The multimodal analysis follows a logical, sequential workflow to maximize the information gleaned from a single sample. The process, from sample preparation to correlated data analysis, is outlined in the diagram below.
Detailed Methodologies
XPS Analysis Protocol
- Sample Preparation: Cathode samples are harvested from cycled coin cells or pouches inside an argon-filled glovebox to prevent air exposure. They are typically rinsed with a pure solvent (e.g., dimethyl carbonate) to remove residual electrolyte salts and then transferred to the XPS instrument via an inert transfer vessel [49].
- Instrument Setup: A monochromatic Al Kα X-ray source (1486.6 eV) is used. The analysis is performed at a take-off angle of 45° (relative to the surface normal) for a standard sampling depth of ~5 nm, or at grazing angles (e.g., 15°) for enhanced surface sensitivity (~2 nm) [47].
- Data Acquisition:
- Survey Spectra: Acquired over a wide binding energy range (e.g., 0-1100 eV) to identify all elements present.
- High-Resolution Spectra: Collected for core-level peaks of interest (e.g., C 1s, O 1s, F 1s, transition metals, P 2p) to determine chemical states. Charge compensation is essential for insulating battery materials [47].
- Spatial Mapping: Using scanning X-ray induced secondary electron imaging (SXI) or small-area XPS to identify regions of interest and map chemical heterogeneity over large areas [8].
- Depth Profiling: Achieved by alternating between cycles of argon cluster ion (e.g., Ar(_{1000-2500})+) sputtering and XPS analysis to characterize the composition as a function of depth, crucial for probing the SEI and cathode-electrolyte interphase (CEI) [1].
ToF-SIMS Analysis Protocol
- Sample Preparation: Similar to XPS, ensuring an uncontaminated and air-free transfer is critical.
- Instrument Setup: Selection of the primary ion source is paramount. A Bismuth (Bi({n})+) cluster ion source is typically used for analysis due to its high secondary ion yield. For sputter depth profiling, the choice of sputter ion is optimized:
- Cesium (Cs+): Excellent for inorganic depth profiling and enhances negative ion yield [49].
- Argon Cluster (Ar({1500})+): Preferred for organic materials and delicate interfaces as it minimizes molecular fragmentation and preserves chemical information, ideal for SEI/CEI analysis [49].
- Oxygen (O(_2)+): Enhances positive ion yield [49].
- Data Acquisition:
- Surface Spectra & Imaging: Acquired in static SIMS mode using the Bi({n})+ source to obtain molecular and elemental distribution maps from the top 1-2 nm of the surface with high spatial resolution (<100 nm) [47].
- Depth Profiling: The surface is continuously eroded by the selected sputter ion beam, while the analysis beam periodically interrogates the crater bottom. This builds a 3D chemical map, revealing the in-depth distribution of species like LiF, Li(x)PO(y)F(z), and other electrolyte breakdown products [49].
Key Findings and Data Interpretation
The combined data from XPS and ToF-SIMS provides a comprehensive narrative of the Ep's stabilizing effect.
- XPS Results: Quantitative analysis of the high-resolution F 1s and O 1s spectra reveals that the Ep-coated cathode exhibits a more uniform and inorganic-rich interphase, characterized by a higher concentration of protective LiF and reduced levels of organic polycarbonates compared to the uncoated cathode [8]. This composition is known to lead to lower interfacial resistance and improved Li(^+) transport.
- ToF-SIMS Results: The 3D chemical maps from ToF-SIMS depth profiling visually corroborate the XPS findings. They show a homogeneous and continuous distribution of LiF across the Ep-coated cathode surface, whereas the uncoated cathode displays a patchy and irregular interphase. Furthermore, ToF-SIMS can trace the suppression of transition metal (e.g., Mn, Co) dissolution from the cathode and its migration across the interphase, a key degradation pathway mitigated by the Ep coating [45].
- Correlated Conclusion: The Ep coating functions as a barrier that promotes the formation of a thin, dense, and inorganic-rich interphase. This structure mechanically stabilizes the cathode particle, minimizes continuous electrolyte decomposition, and suppresses transition metal dissolution, collectively leading to the observed enhancement in electrochemical performance, including higher capacity retention and longer cycle life [45] [8].
The Scientist's Toolkit: Essential Research Reagents & Materials
Table 3: Key Materials and Reagents for Battery Surface Analysis Studies
| Item | Function/Relevance |
|---|---|
| Cathode Active Materials (CAM) | LiNixCoyMnzO2 (NCM), LiNiO2 (LNO), LiCoO2 (LCO), LiNi0.75Mn0.25O2 (NMX75). The core subject of analysis for degradation and interphase studies [50]. |
| Sulfide Solid Electrolytes | E.g., Li(6)PS(5)Cl (argyrodite). Used in ASSBs; their interface with the CAM is a major focus of XPS/ToF-SIMS analysis [50]. |
| Engineered Particle (Ep) Coatings | Surface modifiers applied to CAMs to form stable artificial interphases, protecting against decomposition [8]. |
| Lithium Metal Anode | High-capacity anode material. Its unstable SEI is a primary application for ToF-SIMS depth profiling [49]. |
| Carbonate-based Electrolytes | Standard liquid electrolytes (e.g., LiPF(_6) in EC/DEC). Their decomposition products form the SEI/CEI analyzed by XPS and ToF-SIMS [49]. |
| Inert Transfer Vessels | Sealed, argon-filled containers for moving air-sensitive battery samples from gloveboxes to analysis instruments without contamination [49]. |
| Cluster Sputter Ion Sources | Gas cluster ion beams (e.g., Ar(_{1500})+) are crucial for depth profiling fragile, organic-rich interphases with minimal artifact formation [1] [49]. |
The multimodal analysis of battery cathodes using XPS and ToF-SIMS is a powerful paradigm that provides insights unattainable by either technique alone. As demonstrated in the case of Engineered Particles, XPS delivers quantitative, chemical-state-specific information critical for understanding the composition of interfacial layers, while ToF-SIMS offers unmatched sensitivity and spatial resolution for mapping the distribution of key species in 2D and 3D. This synergy is fundamental for deconvoluting the complex degradation mechanisms in next-generation batteries, including all-solid-state and lithium metal systems. The ongoing advancements in these techniques—such as the use of large argon clusters for damage-free depth profiling and the integration of AI for data analysis—will further solidify their role as indispensable tools for accelerating the development of safer, higher-energy-density, and longer-lasting energy storage systems [45] [27] [1].
Overcoming Analytical Challenges: Pitfalls and Best Practices
Managing Ion-Induced Artefacts in Depth Profiling (Mixing, Preferential Sputtering)
Surface depth profiling is a cornerstone of materials science, enabling researchers to elucidate the chemical composition of materials as a function of depth. Techniques such as X-ray Photoelectron Spectroscopy (XPS), Auger Electron Spectroscopy (AES), and Secondary Ion Mass Spectrometry (SIMS) routinely employ ion sputtering to remove surface layers sequentially. However, the interaction between the incident ion beam and the sample surface introduces inevitable artefacts that can distort the true in-depth chemical profile. Understanding and managing these artefacts is critical for accurate data interpretation, particularly in advanced applications like thin-film analysis, nano-layer characterization, and drug development research.
The most prevalent artefacts include ion beam mixing, where incident ions cause the interdiffusion of atomic species across interfaces, blurring sharp compositional changes. Preferential sputtering occurs when different elements in a multi-component material are sputtered at different rates, leading to a surface composition that does not represent the bulk. Furthermore, ion-induced roughness can develop during prolonged sputtering, degrading depth resolution. These effects are inherent to the physical sputtering process but their severity depends on factors such as ion energy, angle of incidence, ion species, and sample properties [51] [1]. This guide provides a comparative analysis of how XPS, AES, and SIMS are impacted by these artefacts and outlines the experimental strategies employed to mitigate them.
Key Artefacts: Mechanisms and Impacts
Ion Beam Mixing
- Mechanism: When incident ions bombard a sample, they transfer kinetic energy to the sample atoms, causing collisional displacement and recoil implantation. This process physically mixes atoms from adjacent layers, leading to an artificial broadening of interfaces.
- Impact on Data: The primary consequence is a significant degradation of depth resolution, making it challenging to pinpoint abrupt interface boundaries with accuracy. Ion mixing is particularly problematic for analyzing nano-scale multilayer structures, where interface widths are critical [1].
- Governing Factors: The extent of mixing is highly dependent on ion energy. Higher ion energies increase the depth range of the ions within the sample, causing mixing at greater depths and worsening the artefact [51].
Preferential Sputtering
- Mechanism: In a material containing multiple elements, the sputter yield (number of atoms removed per incident ion) is inherently different for each element. This results in the element with the lower sputter yield becoming enriched on the surface during the profiling process [51].
- Impact on Data: Preferential sputtering causes the measured surface composition to deviate from the true bulk composition, leading to inaccurate quantitative analysis. In compounds, this can also induce chemical state changes on the altered surface [51] [52].
- Governing Factors: The sputter yield is a function of the elemental species, their chemical state, and the mass of the primary ion [51].
Surface Roughening and Crater Effects
- Mechanism: The sputtering process can induce the development of micro-topography or roughness on an initially smooth surface. This can be due to inhomogeneous sputtering, crystallographic effects, or the presence of impurities. Instrumental factors, such as an ion beam that is not perfectly uniform over the analyzed area, can also lead to a non-flat crater bottom [51].
- Impact on Data: As roughness develops, the analysis is performed over a range of depths simultaneously. This smears out the depth profile and severely degrades resolution, as the signal from different depths is averaged together [51].
- Governing Factors: Material properties (e.g., polycrystalline vs. amorphous) and ion beam conditions (energy, angle) are key drivers. The use of sample rotation during sputtering is a highly effective mitigation strategy [51].
The table below summarizes these core artefacts and their direct impacts on depth profiling data.
Table 1: Key Ion-Induced Artefacts and Their Consequences in Depth Profiling
| Artefact | Underlying Mechanism | Primary Impact on Depth Profile |
|---|---|---|
| Ion Beam Mixing | Collisional cascades and recoil implantation of atoms | Broadens interfaces, degrades depth resolution |
| Preferential Sputtering | Different elemental sputter yields | Alters surface stoichiometry, inaccurate quantification |
| Surface Roughening | Development of topography during sputtering | Smears profile, information averaged over multiple depths |
| Crater Edge Effects | Redeposition of sputtered material or analysis from non-flat crater bottom | Poor depth resolution, non-representative signal collection |
Comparative Analysis of Techniques: XPS, AES, and SIMS
While XPS, AES, and SIMS all rely on ion sputtering for depth profiling, their fundamental information signals lead to different sensitivities to ion-induced artefacts.
X-Ray Photoelectron Spectroscopy (XPS)
XPS is renowned for its excellent chemical sensitivity and ability to provide quantitative information on chemical bonding states. However, this strength is counterbalanced by a significant vulnerability to sputter-induced damage.
- Sensitivity to Artefacts: The sputtering process can alter the chemical state of the surface, making it difficult to distinguish the original chemistry from ion-beam-induced phases. For instance, ion bombardment can reduce oxides or form new carbides [52]. Furthermore, the relatively large information depth (several nanometers) of XPS, governed by the inelastic mean free path of photoelectrons, intrinsically limits its depth resolution, an effect that is compounded by ion mixing [1] [52].
- Mitigation Strategies: Recent advances focus on using low-energy ions and cluster ion beams (e.g., Ar Gas Cluster Ion Beams) to minimize penetration and mixing, particularly for organic and soft materials [1]. A novel approach involves complex data evaluation that combines TRIDYN simulations of the sputtering process with a calculation of XPS intensities to correct for both sputter-induced alterations and the large information depth [52].
Auger Electron Spectroscopy (AES)
AES offers superior spatial resolution compared to XPS and a shallower information depth, which is advantageous for high-resolution depth profiling.
- Sensitivity to Artefacts: Although AES is also susceptible to ion beam mixing and preferential sputtering, its shallower information depth means it can achieve better depth resolution than XPS under optimized conditions [52]. The electron beam used for analysis can, however, cause beam damage in sensitive materials.
- Mitigation Strategies: Optimizing sputter conditions is well-established for AES. Using low ion energy, grazing incidence angles, and sample rotation are standard practices to minimize roughening and improve interface resolution [52].
Secondary Ion Mass Spectrometry (SIMS)
SIMS boasts extremely high sensitivity (parts-per-billion to parts-per-million) and is capable of mapping elements and isotopes with high spatial resolution. However, it is highly susceptible to matrix effects.
- Sensitivity to Artefacts: The SIMS signal is intensely influenced by the chemical matrix of the sample surface. Since ion bombardment constantly modifies this matrix, it leads to strong matrix effects, where the ion yield for an element can change dramatically with composition, complicating quantification [18]. Preferential sputtering directly alters this matrix, making SIMS particularly vulnerable to this artefact.
- Mitigation Strategies: The high detection sensitivity allows for the use of very low primary ion doses, somewhat reducing damage. For high-resolution mapping, as demonstrated in the analysis of Li in Al-Li alloys, using a fine probe from a radio frequency plasma source or a focused Ga+ ion beam can visualize nanoscale precipitates while managing the sputtered volume [53].
Table 2: Comparative Analysis of XPS, AES, and SIMS for Depth Profiling
| Aspect | XPS | AES | SIMS |
|---|---|---|---|
| Primary Strength | Chemical state information, quantitative | Spatial resolution, shallow information depth | Ultra-high sensitivity, isotope detection |
| Key Artefact Vulnerability | Chemical alteration, large information depth | Ion beam mixing, electron beam damage | Strong matrix effects, preferential sputtering |
| Typical Depth Resolution | Lower (due to IMFP) | Better (due to shallow information depth) | Can be very good with optimized beams |
| Quantitative Ease | Good (with standards) | Moderate | Poor (requires standards, complex) |
| Best Suited For | Chemical composition of layers, oxide states | High-resolution mapping of thin films, interface analysis | Trace element diffusion, dopant profiling, isotope imaging |
Experimental Protocols for Artefact Mitigation
The following section outlines established and emerging experimental methodologies used to manage and correct for ion-induced artefacts.
Protocol for Optimizing Sputter Parameters in XPS/AES
This protocol is fundamental for minimizing physical artefacts during depth profiling in XPS and AES [51].
- Ion Energy Selection: Prioritize the use of low ion energies (e.g., 0.5 keV as used in recent studies [52]). Higher energies increase ion penetration and mixing, degrading depth resolution.
- Incidence Angle Adjustment: Employ grazing incidence angles (with respect to the sample normal). This reduces the depth range of ions within the sample, confining mixing to shallower depths and improving resolution.
- Ion Species Selection: Choose heavier ion species (e.g., Xe+) where possible. Larger ions have a shorter penetration depth, leading to less mixing. Note that noble gases like Xe are more expensive than Ar [51].
- Implement Sample Rotation: Continuous azimuthal rotation of the sample during sputtering is highly effective in suppressing the development of cone structures and ion-induced roughness, leading to a flatter crater bottom.
- Beam and Crater Alignment: Ensure the analyzed area is small compared to the sputtered crater and is perfectly centered on the flat bottom of the crater to avoid contributions from crater walls.
Protocol for a Novel Trial-and-Error XPS Evaluation
A recent groundbreaking methodology overcomes XPS limitations by using a computational trial-and-error procedure to correct for both sputter damage and the large photoelectron information depth [52].
- Assume a Trial Structure: Begin by postulating an initial in-depth concentration distribution for the sample.
- Simulate Ion Sputtering: Use a simulation code like TRIDYN (a dynamic version of the TRIM code) to simulate the ion bombardment process in steps. TRIDYN models the changes in composition and structure introduced by each sputtering cycle, accounting for ion mixing and preferential sputtering.
- Calculate XPS Intensities: After each simulated sputtering step, calculate the expected XPS intensities. This calculation must use composition-dependent inelastic mean free path (IMFP) values to account for the depth from which photoelectrons can escape.
- Iterate to Convergence: Compare the calculated XPS intensities with the experimentally measured profile. Iteratively adjust the trial structure and repeat steps 2 and 3 until the simulated profile matches the experimental data. The final trial structure is considered the corrected in-depth chemical composition.
Protocol for High-Resolution SIMS Mapping of Light Elements
This protocol, derived from the nanoscale mapping of Lithium in an Al-Li alloy, highlights practices for achieving high spatial resolution while managing sputter artefacts [53].
- Source Selection for High Resolution: For NanoSIMS analysis, use a radio frequency (RF) O− plasma primary ion source. This provides a finely focused beam for high-lateral-resolution mapping.
- Alternative FIB-SIMS Setup: As an alternative, employ a Focused Ion Beam (FIB) equipped with a Time-of-Flight (ToF) SIMS detector. A Ga+ liquid metal ion gun in the FIB can be focused to a very fine probe.
- Correlative Microscopy Validation: Correlate the SIMS chemical maps with structural and chemical data from Scanning Transmission Electron Microscopy (STEM) with Energy-Dispersive X-ray (EDX) analysis. This validates the identification of precipitates (e.g., T1 phases in Al-Li alloys) and confirms their size and distribution observed by SIMS.
Essential Reagents and Materials for Depth Profiling
The table below lists key research reagents and materials essential for conducting and optimizing surface depth profiling experiments.
Table 3: Key Research Reagent Solutions for Surface Depth Profiling
| Item Name | Function/Application |
|---|---|
| High-Purity Noble Gases (Ar, Xe) | Primary ion source for sputtering. High purity minimizes chemical impurities in the beam that could react with the sample [51]. |
| Cluster Ion Sources (Ar-GCIB) | Gas Cluster Ion Beams for sputtering soft materials, polymers, and organics with minimal chemical damage and mixing [1]. |
| Conductive Coating Materials (C, Au) | Used to coat insulating samples to prevent surface charging during analysis with electron or ion beams. |
| Standard Reference Materials | Certified thin-film standards with known layer thicknesses and compositions for calibrating sputter rates and quantifying data. |
| TRIDYN Simulation Software | Computer code for the dynamic simulation of ion bombardment and sputtering, used to correct for ion-induced alterations in depth profiles [52]. |
| Nomex (meta-aramid) Swabs | Specialized swabs for standardized surface sampling of contaminants for techniques like IMS and MS [54]. |
Workflow and Conceptual Diagrams
The following diagram illustrates the logical workflow of the novel trial-and-error evaluation method for XPS depth profiling, which corrects for both sputter artefacts and the large photoelectron information depth.
Diagram 1: XPS Profile Correction Workflow
This diagram outlines the primary ion-induced artefacts and the corresponding mitigation strategies discussed in this guide.
Diagram 2: Artefacts and Mitigation Strategies
Effectively managing ion-induced artefacts is not merely a procedural detail but a fundamental requirement for achieving accurate and reliable depth profiles in surface analysis. Each major technique—XPS, AES, and SIMS—offers distinct advantages but carries unique vulnerabilities to artefacts like mixing, preferential sputtering, and roughening. The choice of technique must therefore be guided by the specific analytical question, whether it demands high chemical state information (XPS), excellent spatial resolution (AES), or ultra-high sensitivity (SIMS).
Current best practices involve a careful optimization of sputtering parameters, including low ion energy, grazing angles, and sample rotation. Furthermore, the field is moving towards sophisticated computational corrections, as exemplified by the trial-and-error method using TRIDYN simulation for XPS, which promises to unlock more quantitative analyses of complex nano-layer systems. For researchers in drug development and materials science, a clear understanding of these artefacts and mitigation strategies is essential for leveraging the full power of surface depth profiling techniques to drive innovation.
Surface analysis is fundamental to advancements in materials science, semiconductor development, and pharmaceutical research. Among the most powerful techniques for probing surface composition are X-ray Photoelectron Spectroscopy (XPS), Auger Electron Spectroscopy (AES), and Secondary Ion Mass Spectrometry (SIMS). Each method offers unique strengths in elemental sensitivity, spatial resolution, and chemical state information, but their effective application hinges on successfully addressing sample compatibility challenges. Key compatibility factors include the sample's response to vacuum environments, its electrical conductivity, and its tendency to release gases (outgassing), all of which can significantly compromise data quality.
This guide provides a comparative overview of XPS, AES, and SIMS, focusing on their operational requirements and limitations. We will objectively compare their performance when analyzing challenging samples, supported by recent experimental data. Furthermore, we will detail practical methodologies to mitigate common issues like surface charging, enabling researchers to select and optimize the most appropriate technique for their specific analytical needs.
Technical Comparison of XPS, AES, and SIMS
The effectiveness of a surface analysis technique is determined by its operational principles and the resultant sample requirements. The following table provides a direct comparison of the three techniques based on key parameters.
Table 1: Comparison of Key Technical Aspects for XPS, AES, and SIMS
| Feature | XPS (X-ray Photoelectron Spectroscopy) | AES (Auger Electron Spectroscopy) | SIMS (Secondary Ion Mass Spectrometry) |
|---|---|---|---|
| Primary Probe | X-ray photons [55] | Focused electron beam (typically 50 eV - 3.0 keV) [55] | Energetic primary ion beam (e.g., Ar+, O2+, Cs+, C60+) [5] |
| Detected Signal | Photoelectrons [55] | Auger electrons [37] [55] | Sputtered secondary ions [5] |
| Information Obtained | Elemental identity, chemical state, and electronic state [55] | Quantitative elemental composition from the top ~5 nm [37] | Elemental and isotopic composition, with high sensitivity to trace elements [5] |
| Typical Vacuum Requirement | Ultra-High Vacuum (UHV) | Ultra-High Vacuum (UHV) [37] | Ultra-High Vacuum (UHV) |
| Spatial Resolution | ~5 microns and above [55] | As small as 8 nm [37] [55] | Sub-micron to a few microns |
| Charging Issues | Significant for insulators; requires compensation [56] [57] | Can occur on insulators due to electron beam | Minimal for conducting samples, but can be severe for insulators |
Quantitative Performance Data and Sample Compatibility
The theoretical capabilities outlined in Table 1 have practical consequences for data acquisition and sample integrity. The following table summarizes the key compatibility challenges and the corresponding mitigation strategies for each technique.
Table 2: Sample Compatibility Challenges and Mitigation Strategies
| Aspect | XPS | AES | SIMS |
|---|---|---|---|
| Vacuum Compatibility | Critical. Outgassing from samples (e.g., polymers, biological specimens) degrades vacuum, increases surface contamination, and invalidates analysis. | Critical. UHV is required to maintain a clean surface and allow emitted Auger electrons to reach the detector without scattering [37]. | Critical. High vacuum is essential for the survival of the secondary ions during their travel to the mass spectrometer. |
| Charging of Insulators | High Risk. Photoelectron emission causes positive surface charging, shifting and broadening peaks [56]. | High Risk. The incident electron beam charges insulating surfaces, distorting the AES signal and complicating measurement. | High Risk. The primary ion beam implantation leads to surface charging, which can deflect the beam itself and distort the mass spectra. |
| Common Charging Mitigations | Electron flood guns, metal capping layers [56], sample grounding, and using a low-energy, neutralized ion gun for charge compensation [57]. | Using a lower beam current or energy, or combining with a low-energy ion beam for charge neutralization. | Employing electron flood guns for charge neutralization during analysis. |
| Analysis Depth | ~1-10 nm [1] [55] | ~5 nm [37] | A few nm for static SIMS; continuously deepening for depth profiling. |
| Impact of Outgassing | Prevents the establishment of UHV, leading to sample surface contamination and unreliable results. | Contaminates the UHV environment and can deposit a carbon layer on the sample, masking the true surface composition. | The high surface sensitivity makes SIMS highly vulnerable to any contaminants released in the vacuum chamber. |
Experimental Data on Charging Mitigation in XPS
A 2025 study provides a quantitative experimental framework for addressing one of the most persistent challenges in XPS: analyzing insulating samples. Researchers systematically investigated the use of thin metal capping layers to eliminate surface charging on silicon dioxide (SiO₂) films of varying thicknesses (30–3000 nm) [56].
Experimental Protocol:
- Sample Preparation: Silicon dioxide (SiO₂) films were grown by magnetron sputtering onto silicon substrates. The thickness
dSiO₂was varied from 30 nm to 3000 nm to study charging phenomena on different length scales [56]. - Metal Capping: The SiO₂ films were capped with a few nanometers of either tungsten (W) or aluminum (Al), metals chosen for their low affinity to oxygen. The caps were applied in two configurations:
- Global Grounded Layer: A continuous metal layer grounded directly on top with copper clips.
- Metal Dots: Isolated dots with diameters of 1 mm or 5 mm, which connected to the electrical ground only through the insulating silica film beneath [56].
- XPS Analysis: XPS analysis was performed, with key variables being the size of the area irradiated by the X-ray beam relative to the size of the metal cap and the type of grounding connection [56].
Key Findings:
- Charging was completely eliminated in samples with global, grounded W caps, irrespective of the underlying SiO₂ thickness [56].
- Surprisingly, films capped with 5 mm W dots also showed no charging, provided the SiO₂ film was not thicker than 500 nm. This indicates that lateral charge dissipation through the insulator itself can be effective for certain geometries [56].
- If the X-ray irradiated area was larger than the metal cap (tested with 1 mm W dots), charging elimination was observed only for the thinnest SiO₂ films (
dSiO₂= 30 nm) [56]. - The study concluded that the effectiveness of this method is controlled by material properties (metal photoelectron yield, X-ray-induced conductivity, secondary electron yield) and experimental variables (irradiated area size, grounding type) [56].
This research demonstrates that strategic sample preparation with grounded metal caps is a highly effective strategy for reliable XPS analysis of insulators.
Experimental Workflows for Reliable Surface Analysis
Successfully navigating the challenges of vacuum, charging, and outgassing requires a structured experimental approach. The following workflows for XPS and AES/SIMS illustrate key steps for ensuring sample compatibility and data validity.
Workflow 1: XPS Analysis of Insulating Samples
Workflow 2: AES/SIMS Analysis with High Spatial Resolution
The Scientist's Toolkit: Essential Research Reagents and Materials
The following table details key materials and solutions used in advanced surface analysis experiments, particularly those cited in this guide.
Table 3: Key Reagents and Materials for Surface Analysis Experiments
| Item | Function/Application | Experimental Context |
|---|---|---|
| Trichlorosilane SAM Precursors (e.g., FDTS) | Forms highly uniform Self-Assembled Monolayer (SAM) films on oxide surfaces, serving as ideal calibration samples for metrology [55]. | Used to create high-quality, uniform patterns for evaluating the analytical capabilities of AES and XPS [55]. |
| Tungsten (W) and Aluminum (Al) | Used as thin metal capping layers to dissipate charge during XPS analysis of insulating samples [56]. | Applied as nanoscale layers on SiO₂ to eliminate charging; effectiveness depends on grounding and geometry [56]. |
| Gas Cluster Ion Beam (GCIB) | A sputtering source (e.g., Argon clusters) for gentle depth profiling with minimal chemical damage to the sample [1] [55]. | Used in XPS for depth profiling organic materials and SAM films to reconstruct 3D chemical information layer-by-layer [55]. |
| Monoatomic and Cluster Argon Ions | Sputtering sources for depth profiling in XPS and AES to reveal subsurface composition [1]. | Standard method for depth profiling; can cause ion-induced artefacts (mixing, preferential sputtering), which must be accounted for during data evaluation [1]. |
| Focused Ion Beam (FIB) | A high-precision ion beam for milling and creating cross-sectional slices of a sample in situ [37]. | Integrated with AES to prepare and analyze cross-sections, revealing subsurface features not accessible by surface analysis alone [37]. |
The choice between XPS, AES, and SIMS is not a matter of identifying a superior technique, but of selecting the right tool for a specific analytical question and sample type. XPS excels in providing quantitative chemical state information but requires careful charge management for insulators. AES offers outstanding nanoscale lateral resolution for elemental mapping but is likewise challenged by insulating samples and can involve more complex data interpretation. SIMS provides unparalleled parts-per-billion sensitivity and isotopic discrimination but is a more destructive technique and quantitative analysis can be challenging.
As demonstrated by recent experimental studies, the hurdles of sample charging and vacuum compatibility are not insurmountable. Strategic sample preparation, such as the application of grounded metal caps for XPS, and the use of integrated workflows combining multiple techniques (e.g., AES-FIB-EDS) are paving the way for robust and reliable analysis of even the most challenging materials. By understanding the fundamental requirements and limitations of each technique, researchers can effectively leverage these powerful tools to drive innovation in material science, semiconductor technology, and pharmaceutical development.
Surface analysis techniques are indispensable tools for characterizing the chemical composition of material surfaces, with X-ray Photoelectron Spectroscopy (XPS), Auger Electron Spectroscopy (AES), and Secondary Ion Mass Spectrometry (SIMS) representing the three most widely applied methods [2]. These techniques provide critical information about surface chemistry within the top 1-10 nanometers of materials, enabling advancements across fields including materials science, semiconductor technology, and biomedical research [58] [59]. While each technique offers unique capabilities, they also present distinct data interpretation challenges that can compromise analytical accuracy if not properly addressed.
XPS has emerged as the most commonly used surface analysis technique due to its relatively straightforward quantification, excellent chemical state information, and lower instrument cost compared to AES and SIMS [2]. The technique measures the kinetic energies of electrons ejected from a surface following irradiation with X-rays, providing both elemental and chemical state information. In contrast, SIMS uses energetic primary ions to sputter secondary ions from the surface, which are then mass-analyzed to provide elemental and molecular information with high sensitivity and depth resolution [60]. Despite their complementary strengths, both techniques present significant interpretation hurdles—XPS through peak fitting complexities and SIMS through pronounced matrix effects—that researchers must navigate to generate reliable data.
This guide objectively compares the data interpretation challenges associated with XPS and SIMS, providing researchers with methodologies to identify, mitigate, and correct common analytical errors. By understanding these fundamental limitations and implementing appropriate validation protocols, scientists can improve the accuracy and reproducibility of their surface analysis results, thereby enhancing the reliability of conclusions drawn from these powerful characterization tools.
XPS Data Interpretation: Peak Fitting Challenges and Solutions
Common Peak Fitting Errors in XPS Analysis
XPS data interpretation relies heavily on proper peak fitting, yet studies indicate that approximately 40% of published papers employing peak fitting demonstrate significant errors in their implementation [2]. These inaccuracies predominantly stem from misunderstandings regarding fundamental peak parameters and constraints, leading to misinterpretations of chemical states and inaccurate quantitative assessments.
The most prevalent errors in XPS peak fitting include:
- Incorrect Background Subtraction: Positioning the baseline above the actual spectral curve, which subsequently distorts peak area calculations and quantitative analysis [61]. Proper background selection should position the baseline at the bottom of corresponding element peaks in regions with relatively flat signals compared to the lowest signals.
- Misapplication of Peak Shapes: Utilizing symmetrical peak shapes for metallic systems that inherently produce asymmetrical photoelectron peaks, often resulting in the addition of unnecessary extra components to achieve better apparent fits [2].
- Improper Constraint Application: Either failing to implement necessary constraints or applying incorrect constraints to doublet peaks with well-established relationships. This includes incorrectly setting doublet peak area ratios, peak separations, or full-width-at-half-maximum (FWHM) values [2]. For example, the Ti 2p doublet requires different FWHM values for the 2p₃/₂ and 2p₁/₂ components (the latter being approximately 20% larger), contrary to the common practice of constraining them to identical values.
- Overlooking Orbital Splitting Patterns: Misidentification of spin-splitting peaks, such as incorrectly assigning multiple chemical states to individual 2p₃/₂ components without corresponding 2p₁/₂ partners, or failure to maintain proper area ratios for spin-orbit split peaks (e.g., 2:1 ratio for p orbitals) [61].
- Neglecting Peak Overlaps: Failure to account for overlapping peaks from different elements, such as the O 1s peak (528-535 eV) overlapping with Sb 3d₅/₂, leading to incorrect assignment of all spectral features to a single element [61].
Table 1: Common XPS Peak Fitting Errors and Their Impacts
| Error Type | Description | Impact on Data Quality |
|---|---|---|
| Incorrect Background | Baseline positioned above spectral curve | Distorted peak areas, inaccurate quantification |
| Wrong Peak Shapes | Using symmetrical peaks for metallic systems | Incorrect chemical state identification, extra components |
| Constraint Misapplication | Incorrect doublet ratios or FWHM values | Unphysical peak parameters, inaccurate species distribution |
| Orbital Splitting Misidentification | Ignoring spin-orbit pairing requirements | Wrong chemical state assignment |
| Peak Overlap Neglect | Unresolved overlapping elemental peaks | Elemental misidentification, concentration errors |
Experimental Protocols for Valid XPS Peak Fitting
To address these common errors, researchers should implement rigorous experimental protocols and validation procedures throughout their XPS data analysis workflow. The following methodologies represent best practices for obtaining reliable peak fitting results:
Background Subtraction Methodology: Select an appropriate background subtraction method (Linear, Shirley, Tougaard, or Smart) consistent across the dataset, ensuring the baseline connects the actual low points of the spectrum rather than being positioned arbitrarily [61]. The baseline should be established in regions with relatively flat signals compared to the lowest signals, properly representing the inelastic scattering background beneath photoelectron peaks.
Peak Shape Selection Protocol:
- Identify the material class (metal, oxide, polymer) to determine appropriate peak shapes
- Use asymmetric line shapes for metallic systems
- Apply mixed Gaussian-Lorentzian line shapes for insulating materials
- Validate shape selection through comparison with standard reference spectra
Constraint Implementation: Apply scientifically-justified constraints to doublet peaks based on established physical principles:
- Maintain correct area ratios for spin-orbit split pairs (e.g., 2:1 for p orbitals, 3:2 for d orbitals)
- Implement known chemical shift separations for specific oxidation states
- Allow appropriate FWHM variations between doublet components when physically justified (e.g., Ti 2p system)
Validation Procedures:
- Confirm that all fitted components have physically meaningful binding energies
- Verify that relative peak intensities align with expected values
- Check that FWHM values remain within reasonable ranges (typically 0.8-1.8 eV for most systems)
- Correlate fitting results with complementary analytical techniques when possible
Software-Assisted Verification: While automated peak identification software exists, researchers should not rely exclusively on these tools, as they frequently misidentify peaks or fail to recognize confirming spectral features [2]. Instead, use software recommendations as starting points for expert-guided fitting with appropriate scientific justification for all parameters.
SIMS Data Interpretation: Matrix Effects and Quantification Challenges
Understanding SIMS Matrix Effects
The "matrix effect" represents the most significant challenge for quantitative analysis in Secondary Ion Mass Spectrometry (SIMS), referring to the phenomenon where the intensity of secondary ions depends not only on the concentration of the element but also on the chemical composition and structure of the host material [60]. This effect arises from variations in ionization probability and sputter yield across different materials, fundamentally limiting quantitative accuracy without appropriate correction strategies.
In SIMS analysis, the use of chemically active primary ion beams (O₂⁺, Cs⁺) enhances sensitivity but simultaneously exacerbates matrix effects. The ionization probability approximately correlates with the oxygen or cesium concentration implanted in the sample surface, meaning even minor variations in sputter yield can dramatically alter secondary ion intensities [60]. This dependence creates substantial quantification challenges, particularly when analyzing complex, multi-component systems with heterogeneous composition.
The practical implications of matrix effects are especially pronounced in layered structures and interface analysis. For example, when profiling through an Al₀.₈Ga₀.₂As/GaAs structure, carbon implant distributions appear artificially depressed in the AlGaAs layer relative to the GaAs substrate when using a single standard material for quantification [60]. This step-like artifact at the interface does not represent actual composition changes but rather demonstrates how differing matrix compositions alter ionization efficiencies, creating the illusion of concentration variations that don't exist in the actual material.
Table 2: SIMS Matrix Effects in Different Material Systems
| Material System | Matrix Effect Manifestation | Impact on Quantification |
|---|---|---|
| Compound Semiconductors | Different elemental sensitivities at interfaces | Artificial concentration steps at layer boundaries |
| Oxygen Isotopes in Silicates | Instrumental mass fractionation varies with chemistry | Incorrect δ¹⁸O values without matrix-matched standards [62] |
| Biological Materials | Ion yield variations with local chemical environment | Suppressed/enhanced metabolite signals [63] |
| Multi-layer Films | Changing sputter rates and ionization efficiencies | Depth scale compression/expansion, concentration errors |
Experimental Approaches for Mitigating SIMS Matrix Effects
Several specialized methodologies have been developed to address SIMS matrix effects, each with specific applications and limitations:
PCOR-SIMS (Point-by-Point CORected SIMS): This correction method, developed at EAG Laboratories, addresses matrix effects by applying composition-dependent sensitivity factors and sputtering rates throughout the analysis depth [60]. The approach involves:
- Determining the material composition at each depth point
- Applying appropriate relative sensitivity factors based on local matrix composition
- Correcting sputtering rates according to material-dependent yield
- Reconstructing an accurate depth profile without artificial interface artifacts
In practice, PCOR-SIMS transforms artificially stepped profiles at material interfaces (e.g., AlGaAs/GaAs) into smooth, continuous distributions that reflect the actual implant structure [60].
Matrix-Matched Standardization: For isotope ratio analysis, particularly oxygen isotopes in geological materials, researchers employ matrix-matched standards to correct for instrumental mass fractionation (IMF) that varies with sample chemistry [62]. This protocol involves:
- Identifying chemically similar standard materials spanning expected composition range
- Establishing a correlation between chemistry and IMF for specific mineral groups
- Interpolating appropriate correction factors based on unknown sample composition
- Validating with secondary standards when possible
The effectiveness of this approach is demonstrated in silicate minerals and glasses, where IMF correlates with parameters such as forsterite content in olivine, Na/(Na+K) ratio in feldspathic glasses, and (Fe+Mn) content in garnets, olivines, and pyroxenes [62].
Cluster Ion Beam Methods: Recent investigations explore cluster primary ion beams (C₆₀⁺, Arₙ⁺, (H₂O)ₙ⁺) to reduce matrix effects in biological materials [63]. Experimental results indicate that:
- Primary beams containing water clusters are associated with reduced matrix effects
- Reduced ionization suppression/enhancement in amino acid mixtures (arginine and histidine)
- Potential for more quantitative analysis of complex biological systems
- Beam energy and cluster size (n=1000-10000) optimization required for specific applications
Relative Comparison Strategy: When absolute quantification proves impractical, researchers often employ relative comparisons between unknown samples of identical material [60]. This approach acknowledges potential absolute concentration errors while maintaining accurate relative rankings, provided matrix composition remains consistent across compared samples.
Comparative Experimental Data and Case Studies
Quantitative Comparison of Technique-Specific Challenges
Direct comparison of the fundamental challenges in XPS and SIMS reveals complementary strengths and limitations that often guide technique selection for specific applications. The quantitative aspects of these challenges are summarized in Table 3.
Table 3: Comparative Analysis of XPS and SIMS Data Interpretation Challenges
| Parameter | XPS | SIMS |
|---|---|---|
| Primary Challenge | Peak fitting errors | Matrix effects |
| Error Prevalence | ~40% of published papers [2] | Virtually all quantitative analyses [60] |
| Impact on Quantification | Moderate to severe (composition errors up to 10s of %) | Severe (order of magnitude errors possible) |
| Chemical State Information | Direct measurement | Indirect inference |
| Spatial Resolution | 1-150 μm [2] | Sub-micrometer [58] |
| Detection Limits | ~0.1-1 at% | ppm-ppb [62] |
| Standardization Approaches | Peak parameter constraints, validation protocols | Matrix-matched standards, PCOR-SIMS, cluster beams |
| Complementary Techniques | AES, EELS [2] | SNMS, XPS [5] |
Case Study: Combined XPS and SIMS Analysis of DNA Microarrays
A compelling demonstration of complementary XPS and SIMS analysis comes from characterization of DNA-modified surfaces for microarray and biosensor applications [58]. This integrated approach overcome the limitations of both techniques while maximizing their respective strengths:
Experimental Protocol:
- Sample Preparation: Amine-terminated single-stranded DNA (ssDNA) bound to commercial polyacrylamide-based amine-reactive microarray slides in both macro-spot and microarray formats
- XPS Analysis: Scanning XPS analysis with <10 μm spatial resolution to identify DNA spots and quantify DNA elements via phosphorus signal from DNA backbone
- SIMS Analysis: Imaging ToF-SIMS with higher spatial resolution (1-2 nm sampling depth) to determine lateral DNA distribution within micro-spots
- Data Correlation: Principal component analysis (PCA) applied to ToF-SIMS imaging datasets to identify species associated with array spot non-uniformities
Results and Significance:
- XPS provided quantitative surface DNA concentrations through phosphorus measurement, correlating well with ³²P-radiolabeling results
- ToF-SIMS revealed distinct DNA distribution within single array micro-spots, identifying "halo" or "donut" effects from non-uniform deposition
- PCA of ToF-SIMS data identified chemical species responsible for spot heterogeneities not observable in individual ion images
- The combination enabled correlation of spot morphology with hybridization efficiency, explaining variations in diagnostic performance
This case study demonstrates how the quantitative capabilities of XPS complement the high spatial resolution and molecular specificity of SIMS, providing a more complete understanding of surface chemical phenomena than either technique could deliver independently.
Successfully navigating data interpretation challenges in surface analysis requires both specialized instrumentation and analytical resources. The following toolkit represents essential components for researchers working with XPS and SIMS techniques:
Table 4: Essential Research Reagent Solutions for Surface Analysis
| Resource | Function | Application Examples |
|---|---|---|
| Reference Databases | Validated spectra for peak identification | NIST XPS Database, Physical Electronics XPS Library |
| Matrix-Matched Standards | Calibration for SIMS quantification | Isotope standards [62], implant standards [60] |
| Peak Fitting Software | Spectral deconvolution | CasaXPS, Advantage, MultiPak |
| Multivariate Analysis Tools | Data dimensionality reduction | PCA for ToF-SIMS imaging [58] |
| Cluster Ion Sources | Matrix effect reduction | C₆₀⁺, Arₙ⁺, (H₂O)ₙ⁺ primary beams [63] |
| Validation Samples | Method verification | Certified reference materials, internal controls |
Workflow Visualization for Surface Analysis
The following diagram illustrates the integrated experimental and computational workflow for overcoming data interpretation challenges in XPS and SIMS analysis:
Surface Analysis Workflow for XPS and SIMS
XPS and SIMS represent complementary pillars of modern surface analysis, each with distinctive data interpretation challenges that can significantly impact analytical outcomes. XPS analysis is particularly susceptible to peak fitting errors, with approximately 40% of published papers containing significant fitting inaccuracies that compromise chemical state identification and quantification [2]. Conversely, SIMS faces fundamental matrix effects that alter secondary ion yields based on local chemical environment, potentially creating order-of-magnitude errors in quantitative analysis without appropriate correction strategies [60].
Successful navigation of these challenges requires implementation of rigorous experimental protocols and validation procedures. For XPS, this includes proper background subtraction, scientifically-justified constraints, appropriate peak shapes, and thorough validation checks. For SIMS, effective approaches include matrix-matched standardization, PCOR-SIMS correction methods, specialized cluster ion beams, and relative comparison strategies when absolute quantification proves impractical. The most powerful insights often emerge from combined XPS/SIMS approaches, leveraging the quantitative capabilities of XPS with the high spatial resolution and sensitivity of SIMS while compensating for their respective limitations [58] [8].
As surface analysis continues to evolve with advancements in instrumentation and data processing capabilities, maintaining focus on fundamental interpretation principles remains essential for generating reliable, reproducible results. By recognizing and addressing these inherent challenges, researchers can more effectively exploit the powerful capabilities of XPS and SIMS to advance scientific understanding across diverse fields including materials science, biotechnology, and energy research.
This guide compares the sample preparation and handling requirements for X-ray Photoelectron Spectroscopy (XPS), Auger Electron Spectroscopy (AES), and Secondary Ion Mass Spectrometry (SIMS) to help researchers optimize workflows for reliable surface analysis.
Core Principles and Sample Requirements
The fundamental operating principles of XPS, AES, and SIMS dictate their specific sample requirements and handling protocols.
XPS uses X-rays to eject core-level electrons, and their measured kinetic energy is used to identify elements and their chemical states [20]. It is versatile for conductors and insulators [64]. AES relies on an electron beam to create a core-hole vacancy; the subsequent Auger process ejects an electron with characteristic energy [65]. Its primary electron beam makes it generally unsuitable for insulating materials due to charging [64]. SIMS bombards the surface with a primary ion beam (e.g., O₂⁺, Cs⁺, or C₆₀⁺) and mass-analyzes the ejected secondary ions, providing extreme surface sensitivity and trace element detection [66] [67].
The table below summarizes the fundamental sample requirements for each technique.
Table 1: Fundamental Sample Requirements for XPS, AES, and SIMS
| Technique | Electrical Conductivity | Vacuum Stability | Typical Form | Critical Constraint |
|---|---|---|---|---|
| XPS | Conductors & Insulators [64] | Must be stable in UHV [20] | Solid, flat pieces | Surface contamination |
| AES | Conductors & Semiconductors only [64] | Must be stable in UHV [65] | Solid, flat pieces | Electrical charging |
| SIMS | Conductors & Insulators (with charge compensation) | Must be stable in UHV & under ion beam [66] | Solid, flat pieces | Mass interferences |
Workflow Comparison: Sample Preparation
Proper sample preparation is critical for generating reliable and reproducible data. The following diagram outlines the general preparation workflow for surface-sensitive analysis.
Sample Preparation Workflow for Surface Analysis
XPS Preparation Protocols
- Objective: Minimize surface contamination. Handle with gloves or tweezers to avoid fingerprint contamination [20].
- Cleaning: Use solvent cleaning (e.g., alcohols, acetone) or in-situ argon sputtering to remove adventitious carbon and oxides [20] [51].
- Mounting: Use conductive tapes or clips. For insulators, charge stabilization may require a flood gun, but no conductive coating is typically applied [20].
AES Preparation Protocols
- Objective: Ensure electrical conductivity to prevent charging.
- Conductive Coating: For insulating samples, apply a thin, uniform coating of carbon or gold-palladium via sputter coating [64]. This is a critical step for AES on non-conductive materials.
- Mounting: Mount securely to a conductive holder (e.g., a metal stub) using conductive tape or paste to ensure electrical grounding [65].
SIMS Preparation Protocols
- Objective: Preserve surface chemistry and manage sputtering effects.
- Encapsulation: For accurate depth profiling of ultra-thin films (e.g., sub-3 nm oxides), encapsulate the sample with an amorphous silicon layer prior to analysis to negate atomic mixing effects at the interface [68].
- Cluster Ions: For organic and biological samples (e.g., proteins, polymers), use cluster primary ions like C₆₀⁺ or Bi₃⁺. These cause less chemical damage and provide higher yields of molecular fragments compared to monatomic ions [67].
Experimental Data and Comparative Performance
Experimental data from round-robin studies and published research highlights the practical outcomes of optimized preparation.
Table 2: Comparative Analytical Performance of XPS, AES, and SIMS
| Parameter | XPS | AES | SIMS |
|---|---|---|---|
| Detection Limits | 0.1 - 1 at% [20] | ~100 ppm [65] | ppb - ppm [66] |
| Depth Resolution | Good (with cluster ions) [51] | Good | Excellent (with encapsulation) [68] |
| Thickness Range | Best for ultra-thin films (<3 nm) [68] | Good for ultra-thin films [68] | Wide range; best for >10 nm films [68] |
| Molecular Info | Excellent (chemical states) [20] | Limited | Good (with cluster ions) [67] |
| Quantitative Accuracy | Excellent (with standards) [20] | Good (with standards) | Semi-quantitative (requires standards) |
A key study on oxide thickness determination used cross-section Transmission Electron Microscopy (TEM) as a standard to compare techniques [68]. The findings were:
- XPS and AES offer high precision for measuring ultra-thin films below 3 nm [68].
- SIMS historically struggled with thin films due to atomic mixing, but encapsulating the oxide with amorphous silicon prior to analysis negates these effects, making it excellent for thicker films [68].
Surface sensitivity is another critical parameter. In static SIMS experiments on organic films, the primary ion type drastically affects the molecular escape depth:
- Bi₁⁺ ions showed the highest surface sensitivity with an escape depth of 1.8 nm [67].
- C₆₀⁺ ions followed with an escape depth of 2.3 nm [67].
- Bi₅⁺ ions were the least surface-sensitive, with an escape depth of 4.7 nm [67].
This demonstrates that selecting the correct primary ion is a crucial part of sample and experimental optimization in SIMS.
Essential Research Reagent Solutions
The table below details key materials and reagents essential for preparing samples for surface analysis.
Table 3: Essential Research Reagents for Surface Analysis Sample Preparation
| Item | Function | Common Examples |
|---|---|---|
| Conductive Tapes/Pastes | Electrically grounds samples to the holder. | Carbon tape, silver paste, copper tape |
| Sputter Coater | Applies thin conductive coatings for AES on insulators. | Carbon, Gold/Palladium targets |
| High-Purity Solvents | Removes organic surface contaminants prior to analysis. | Isopropanol, Acetone, Methanol |
| Cluster Ion Sources | Increases molecular ion yield and reduces damage in SIMS. | C₆₀⁺, Bi₃⁺, Arₙ⁺ primary ion guns [67] |
| Encapsulation Materials | Protects ultra-thin interfaces during SIMS depth profiling. | Amorphous silicon layer [68] |
| Reference Materials | Calibrates instrument binding energy and sensitivity. | Pure gold foil, copper foil |
Choosing the optimal surface analysis technique depends on the sample's nature and the analytical question. XPS is the most versatile for chemical state information on diverse materials. AES provides superior spatial resolution and mapping for conductive samples. SIMS offers unparalleled trace sensitivity and isotopic capability. By understanding and implementing these tailored preparation workflows, researchers can significantly enhance the reliability and reproducibility of their surface analysis data.
Head-to-Head Comparison: Validating Data and Technique Selection
Surface analysis techniques are critical for characterizing the chemical composition and structure of material surfaces, with X-ray Photoelectron Spectroscopy (XPS), Auger Electron Spectroscopy (AES), and Secondary Ion Mass Spectrometry (SIMS) representing three of the most prominent methods in materials research. These techniques provide essential data for diverse fields including polymer science, battery technology, and catalyst development, enabling researchers to understand surface segregation phenomena, interfacial chemistry, and material degradation pathways. The selection of an appropriate surface analysis method requires careful consideration of multiple factors including detection sensitivity, depth resolution, chemical state information, and analytical throughput. This guide provides a direct technical comparison of XPS, AES, and SIMS to assist researchers in selecting the optimal technique for their specific analytical requirements, particularly within the context of drug development and materials science research.
Technical Comparison Table
The following table summarizes the core technical specifications and capabilities of XPS, AES, and SIMS for direct comparison.
Table 1: Direct technical specifications and capabilities of XPS, AES, and SIMS
| Parameter | XPS (X-ray Photoelectron Spectroscopy) | AES (Auger Electron Spectroscopy) | SIMS (Secondary Ion Mass Spectrometry) |
|---|---|---|---|
| Primary Probe | X-ray photons [69] [47] | Electron beam [5] | Energetic ion beam (e.g., O2+, Cs+, O3-) [18] [70] [71] |
| Detected Signal | Photoelectrons [69] [47] | Auger electrons [5] | Secondary ions (sputtered ions) [18] [70] |
| Elements Detected | All elements except hydrogen [69] [47] | All elements except hydrogen [5] | All elements, including hydrogen and isotopes [70] [47] |
| Chemical State Information | Yes, via chemical shifts [69] [47] | Yes [5] | Limited, possible for some systems [47] |
| Detection Limits | 0.1 - 1 atomic % [47] | ~0.1 - 1 atomic % [5] | ppm to ppb (Dynamic SIMS) [70] [71]; sub-ppm (TOF-SIMS) [70] [47] |
| Lateral Resolution | ~3 - 10 micrometers [47] [72] | Better than XPS (nanometer range possible) [5] | <100 nm (TOF-SIMS) to >1 µm (Dynamic SIMS) [70] [47] |
| Sampling/Information Depth | 2 - 10 nm (varies with take-off angle) [47] | 2 - 5 nm (shallow than XPS) [5] | <1 nm (topmost layer) [47] |
| Depth Profiling | Yes, with sputter ion gun [18] [69] | Yes, with sputter ion gun [5] | Yes, intrinsic to the technique; excellent depth resolution (~1 nm) [70] [71] |
| Quantitative Analysis | Good, with sensitivity factors [69] [47] | Good, with standards [5] | Semi-quantitative; requires standard samples [71] [47] |
| Vacuum Requirement | Ultra High Vacuum (UHV) [18] [72] | Ultra High Vacuum (UHV) [5] | Ultra High Vacuum (UHV) [18] [70] |
| Key Strength | Quantitative chemical state identification; good for insulators [69] [47] | High spatial resolution; good for conductors and semiconductors [5] | Extremely high sensitivity; isotope detection; depth profiling [70] [71] |
| Main Limitation | Limited spatial resolution; no H detection [47] | Can cause beam damage; poor for insulators [5] | Strong matrix effects; can be destructive [18] [47] |
Experimental Protocols and Methodologies
XPS Analysis Protocol
XPS analysis relies on the photoelectric effect, where X-ray irradiation of a sample causes the emission of photoelectrons whose kinetic energies are measured to determine their elemental identity and chemical state [69] [47]. A standardized methodology for routine XPS analysis involves several critical steps:
- Sample Preparation: Mount a sample smaller than 10x10 mm² and 1 mm thick onto a suitable holder. For insulating samples, ensure the charge compensation system is functional [72]. Surface cleaning may be performed using an in-situ ion gun [72].
- Instrument Setup: Place the sample in an ultra-high vacuum (UHV) chamber (typically ≤ 10⁻⁸ mbar). Select an X-ray source; a monochromatic Al Kα (1486.6 eV) source is standard for high energy resolution. For insulating samples, activate the low-energy electron flood gun for charge compensation [72] [47].
- Data Acquisition:
- Survey Spectrum: Acquire over a wide binding energy range (e.g., 0-1100 eV) to identify all elements present (except hydrogen) [69].
- High-Resolution Spectra: Collect for core-level peaks of identified elements to determine chemical states via chemical shifts [69] [47]. The typical sampling depth is 5-10 nm but can be varied using angle-resolved measurements [47].
- Data Analysis: Calibrate the energy scale by referencing the C 1s peak for aliphatic carbon to 285.0 eV [47]. Use peak fitting and sensitivity factors to determine atomic concentrations and chemical state distributions.
SIMS Analysis Protocol
SIMS uses a focused primary ion beam to sputter material from the sample surface, with the ejected secondary ions analyzed by a mass spectrometer [18] [70]. The protocol differs significantly between static (surface analysis) and dynamic (depth profiling) modes:
- Sample Preparation: Ensure the sample is vacuum-compatible and stable. The sample size can range from a few square millimeters up to 3x5 inches [70]. Clean the surface if necessary to remove atmospheric contaminants.
- Instrument Setup: Place the sample in a UHV chamber. Select the primary ion species (e.g., O2+, Cs+, O3-) based on the desired analysis. O3- has been shown to enhance signals for elements like U and Th [71].
- Data Acquisition:
- Static SIMS (e.g., TOF-SIMS): Use a low primary ion dose (< 10¹³ ions/cm²) to preserve the surface chemistry. Acquire mass spectra to identify molecular and elemental surface species with high sensitivity [47]. High-lateral-resolution chemical imaging (>80 nm) is possible [70].
- Dynamic SIMS (Depth Profiling): Use a continuous, high-current primary ion beam to sputter a crater into the sample. Monitor secondary ion signals as a function of time to generate depth profiles with excellent depth resolution (approaching 1 nm) [71].
- Data Analysis: For quantitative analysis, apply Relative Sensitivity Factors (RSFs) derived from standard samples to convert secondary ion intensities to concentrations [71]. For TOF-SIMS, multivariate analysis is often used to interpret complex spectral data.
Visualization of Technique Selection Workflow
The following diagram illustrates the logical decision-making process for selecting the most appropriate surface analysis technique based on key analytical questions.
The Scientist's Toolkit: Essential Research Reagents and Materials
Successful surface analysis requires not only sophisticated instrumentation but also specific reagents and materials for sample preparation, calibration, and analysis.
Table 2: Key research reagents and materials for surface analysis
| Item | Function and Application |
|---|---|
| Standard Reference Materials | Certified materials with known composition and thickness for quantitative calibration of SIMS (dopant concentrations) [71] and verification of XPS/AES sensitivity factors. |
| Charge Compensation Sources | Low-energy electron flood guns and ion sources are essential for analyzing insulating samples (e.g., polymers, ceramics) in XPS to neutralize surface charging [72] [47]. |
| Primary Ion Sources (O2+, Cs+, O3- etc.) | Energetic ion beams used in SIMS for sputtering and ion generation, and in XPS/AES for depth profiling. Ion choice affects yield, depth resolution, and detection sensitivity [71]. |
| Monochromated Al Kα X-ray Source | High-energy-resolution X-ray source used in XPS to minimize peak broadening and improve chemical state identification [69] [47]. |
| UHV-Compatible Sample Holders & Materials | Specialized mounts designed to hold samples of various sizes (up to 3x5 inches for some SIMS systems [70]) and withstand ultra-high vacuum conditions without outgassing. |
| In-situ Sample Treatment Stages | Heating and cooling stages (e.g., range of 120-1073 K in XPS [72]) for conducting experiments under controlled temperature conditions within the analysis chamber. |
| Calibration Gases | High-purity gases (e.g., O2, N2, H2, CO2 [72]) for use in ambient pressure XPS experiments or for surface reaction studies. |
Complementary Use of Techniques in Advanced Research
No single technique provides a complete picture of complex material systems. The integration of multiple surface analysis methods is often the most powerful strategy. A prime example is next-generation battery research, where both XPS and Time-of-Flight SIMS (TOF-SIMS) are employed to unravel the complex chemistry at electrode-electrolyte interfaces [45]. XPS provides quantitative chemical state information about the Solid Electrolyte Interphase (SEI), identifying compounds such as lithium oxides, fluorides, and carbonates. TOF-SIMS complements this by offering high-resolution 3D chemical mapping and depth profiling, revealing the spatial distribution of these species and uncovering degradation pathways and metal migration with ppm-level sensitivity [45]. This combined approach delivers a comprehensive view of both the chemical identity and spatial organization of critical interfaces, accelerating the development of safer and higher-performance batteries.
Similarly, in polymer blend characterization, XPS and TOF-SIMS are used in tandem. XPS quantitatively determines the surface concentration of blend components, while TOF-SIMS provides detailed molecular information and high-resolution images showing the surface distribution of these components, which is crucial for understanding surface segregation effects [47]. Furthermore, the combination of different techniques can be used to prepare and analyze samples in novel ways. For instance, Glow Discharge Optical Emission Spectroscopy (GDOES), known for its fast sputtering rates, can be used to swiftly reach a buried interface of interest. The sample is then transferred to an XPS system for detailed chemical analysis of the pristine, unaltered interface [18]. These multi-technique workflows highlight the importance of a strategic approach to surface analysis, leveraging the unique strengths of each method to solve complex research problems.
Surface analysis techniques are critical for understanding the interface between synthetic materials and biological systems, a domain where surface properties directly dictate biocompatibility and performance. For researchers, scientists, and drug development professionals, selecting the appropriate analytical technique is paramount for accurate material characterization. This guide provides an objective comparison of three principal surface analysis techniques—X-ray Photoelectron Spectroscopy (XPS), Auger Electron Spectroscopy (AES), and Secondary Ion Mass Spectrometry (SIMS)—within biomedical application scenarios. The evaluation is based on their fundamental operating principles, analytical capabilities, and practical performance in addressing common challenges in biomaterial development, such as surface contamination, protein adsorption, and the chemical characterization of polymer-based implants [29] [2].
Technique Comparison: Fundamental Characteristics
The following table summarizes the core attributes of XPS, AES, and SIMS, providing a foundation for their comparative analysis.
Table 1: Fundamental Characteristics of XPS, AES, and SIMS
| Feature | XPS (ESCA) | AES | SIMS |
|---|---|---|---|
| Primary Probe | X-rays [2] | Energetic Electrons [2] | Energetic Ions [2] |
| Detected Signal | Photoelectrons [2] | Auger Electrons [2] | Sputtered Ions (positive/negative) [2] |
| Information Provided | Elemental & Chemical State [2] [73] | Primarily Elemental, some Chemical State [2] | Elemental, Isotopic, Molecular [2] [73] |
| Detection Limits | ~0.1 - 1 at% [73] | ~0.1 - 1 at% | Parts-per-billion (ppb) [73] |
| Spatial Resolution | ~1-10 μm (lab); 150 nm (synchrotron) [2] | Higher than XPS (nanometer scale) [2] [55] | Higher than XPS [2] |
| Depth Resolution | Top 1-10 nm [73] | Top 1-10 nm | Monolayer resolution; depth profiling to µm [73] |
Analytical Performance in Biomedical Context
When applied to biomedical problems, the strengths and weaknesses of each technique become more pronounced. The table below contrasts their performance against key criteria for biomaterial characterization.
Table 2: Performance Comparison for Biomedical Applications
| Criterion | XPS | AES | SIMS |
|---|---|---|---|
| Chemical State Info | Excellent. Provides oxidation states, chemical bonding environment [2] [73]. | Good. Can provide some chemical state information [2]. | Poor/Limited. Primarily elemental and molecular fragment information [73]. |
| Surface Sensitivity | Excellent. Probes the top few nanometers, ideal for surface chemistry [73]. | Excellent. Highly surface-sensitive [2]. | Excellent. Extremely surface-sensitive (first monolayer) [2]. |
| Detection Sensitivity | Moderate. Not suitable for trace element analysis [73]. | Moderate. | Outstanding. Detects elements at parts-per-billion (ppb) levels [73]. |
| Depth Profiling | Possible with sputtering, but less refined than SIMS [2]. | Possible with sputtering. | Excellent. Superior depth resolution for 3D compositional maps [73]. |
| Hydrogen Detection | No direct detection [2]. | No direct detection [2]. | Yes. Can detect all elements, including hydrogen and isotopes [2]. |
| Quantitative Analysis | Good. Relatively straightforward and robust quantification [2]. | Good. | Poor. Challenging due to matrix effects [2]. |
| Sample Damage | Typically minimal (non-destructive) [2]. | Can be significant due to electron beam [2]. | High. Inherently destructive due to ion sputtering [2]. |
Technique Selection Workflow
The diagram below outlines a logical decision-making workflow to guide researchers in selecting the most appropriate technique based on their primary analytical question.
Application Scenarios in Biomedicine
The unique capabilities of each technique make them particularly suited for specific biomedical investigations, as detailed in the table below.
Table 3: Specific Biomedical Applications and Experimental Findings
| Technique | Biomedical Application | Experimental Findings & Utility |
|---|---|---|
| XPS | Polymeric Biomaterials: Study of polyurethanes, polymethacrylates, and polyethylene for implants [29]. | Correlates surface chemistry (e.g., functional groups) with bio- and blood-compatibility. Critical for understanding surface restructuring in different environments [29]. |
| XPS | Surface Modification & Coatings: Analysis of medical implants and bioactive coatings [74]. | Provides chemical state information to verify successful surface modification, such as the introduction of specific functional groups (e.g., CO, CO) [29]. |
| SIMS | Biomaterial Interfaces & Protein Adsorption: Investigation of surface properties and protein interactions [74]. | Highly sensitive detection of adsorbed protein layers and other biological molecules on material surfaces, providing molecular fragment information [29] [74]. |
| SIMS & XPS | Self-Assembled Monolayers (SAMs) for biosensors and patterned surfaces [55]. | XPS confirms chemical state and uniformity of SAMs (e.g., CF₂, CF₃ signals in fluorinated SAMs). SIMS provides detailed molecular fingerprinting and high-resolution mapping [55]. |
| AES | Thin Films & Micro/Nano-devices: Characterization of coatings and device components [74] [55]. | High spatial resolution allows for elemental mapping of micro-scale patterns and analysis of thin film composition in fabricated devices [55]. |
Detailed Experimental Protocol: XPS and SIMS Analysis of SAMs
The following workflow, as exemplified in recent research, details the protocol for fabricating and characterizing Self-Assembled Monolayers (SAMs) using a combination of techniques, providing a template for rigorous biomaterial surface analysis [55].
Sample Fabrication (FDTS SAM Patterns)
- Substrate Preparation: A 100 nm thick silicon dioxide layer is thermally grown or deposited on a silicon wafer.
- Photolithography: A photoresist is spin-coated onto the SiO₂ substrate and patterned using standard photolithography to create a mask with specific micro-scale patterns.
- Vapor Deposition of SAM: The patterned substrate is placed in a vacuum chamber. The SAM precursor, 1H,1H,2H,2H-perfluorodecyltrichlorosilane (FDTS), is introduced in vapor form. The trichlorosilane head groups react with the hydroxyl groups on the exposed SiO₂ surface, forming a highly uniform, covalent siloxane bond.
- Lift-off Process: The photoresist mask is removed (lifted-off) using an appropriate solvent, leaving behind a precise, patterned FDTS SAM only on the areas originally exposed to the SiO₂ substrate.
Surface Analysis and Metrology
- XPS Characterization:
- Instrumentation: An XPS instrument with a focused, monochromatic Al Kα X-ray source and a hemispherical analyzer is used.
- Data Acquisition: Wide-scan surveys are performed to identify all elements present. High-resolution scans are then acquired for key elements like Carbon (C 1s), Fluorine (F 1s), Oxygen (O 1s), and Silicon (Si 2p).
- Chemical State Analysis: The C 1s spectrum is peak-fitted to identify chemical environments characteristic of FDTS, such as CF₃, CF₂, and C-C/C-H species, confirming successful SAM assembly.
- Mapping & 3D Profiling: By utilizing the instrument's mapping capability, a 2D image of the SAM pattern is reconstructed based on the F 1s signal. For 3D analysis, a Gas Cluster Ion Beam (GCIB) is used to gently etch the sample layer-by-layer, with XPS analysis performed at each interval to reconstruct the composition as a function of depth [55].
- AES Characterization:
- Instrumentation: An AES instrument with a finely focused electron beam (e.g., 10 keV) is used.
- Data Acquisition: The electron beam is rastered across the SAM pattern surface. The kinetic energy of the emitted Auger electrons is analyzed.
- Elemental Mapping: A high-resolution map of the SAM pattern is generated by tracking the intensity of the fluorine (KLL) Auger electrons, providing complementary data to XPS with higher spatial resolution [55].
The Scientist's Toolkit: Key Research Reagent Solutions
Table 4: Essential Materials for Surface Analysis in Biomedical Research
| Item | Function in Research |
|---|---|
| Trichlorosilane SAM Precursors (e.g., FDTS) | Forms highly ordered, covalently bonded monolayers on oxide surfaces; used as a model system for studying surface properties, creating biosensor platforms, and calibrating surface analysis instruments [55]. |
| Polymeric Biomaterials (Polyurethanes, Polymethacrylates) | Representative materials for implants, drug delivery devices, and cardiovascular applications; their surface composition and restructuring are critical for understanding biological responses [29]. |
| Gas Cluster Ion Beam (GCIB) | A sputtering source used for depth profiling, particularly for organic and polymeric materials. It minimizes damage and provides cleaner depth profiles compared to traditional monatomic ion beams, enabling accurate 3D analysis with XPS [55]. |
| Reference Materials (NIST Wafers) | Standardized samples used for calibration and cross-laboratory comparison of surface measurements, ensuring accuracy and reproducibility of data from techniques like SEM and AFM [26]. |
In the field of surface science, selecting the appropriate analytical technique is a critical strategic decision that balances the need for quantitative chemical composition data against the desire for high spatial resolution imaging. This guide provides an objective comparison of three major surface analysis techniques—X-ray Photoelectron Spectroscopy (XPS), Auger Electron Spectroscopy (AES), and Secondary Ion Mass Spectrometry (SIMS)—to help researchers navigate this fundamental trade-off. Each technique offers distinct capabilities for characterizing the top few atomic layers of materials, which dominate interactions with environmental factors and determine critical properties including corrosion behavior, catalytic activity, and biocompatibility [75] [76]. Understanding their complementary strengths and limitations enables scientists to make informed choices aligned with specific research objectives, whether for fundamental materials characterization, drug development applications, or failure analysis in industrial settings.
Fundamental Principles and Information Obtained
Core Physical Principles
Each technique operates on distinct physical principles that fundamentally dictate the type of information it can extract from a sample surface.
XPS (X-ray Photoelectron Spectroscopy): XPS utilizes the photoelectric effect where a sample is irradiated with X-rays, ejecting core-level photoelectrons. The kinetic energy of these electrons is measured, allowing precise determination of their original binding energy through the relationship: Ek = hν - Eb - φ, where Ek is the measured kinetic energy, hν is the X-ray photon energy, Eb is the electron binding energy, and φ is the spectrometer work function. This binding energy serves as a unique fingerprint for elemental identification and chemical state determination [75] [76].
AES (Auger Electron Spectroscopy): AES involves a three-step process initiated by electron beam bombardment. First, a core-level electron is ejected, creating an excited ion. Second, an electron from a higher energy level fills the vacancy. Third, the excess energy from this relaxation ejects a third electron—the Auger electron—whose characteristic energy is measured. The kinetic energy of the Auger electron is primarily determined by the energy levels of the involved atomic orbitals, making it element-specific [5].
SIMS (Secondary Ion Mass Spectrometry): SIMS employs a sputtering process where a focused primary ion beam (e.g., O2+, Cs+, Ga+, or Bi3+) bombards the surface, causing the ejection (sputtering) of neutral atoms, and positively and negatively charged secondary ions. These secondary ions are then separated according to their mass-to-charge ratio (m/z) using a mass spectrometer, providing elemental and molecular identification [5] [76].
Types of Information Provided
The different physical interactions yield complementary information about the sample surface:
Elemental Composition: All three techniques detect elements present on the surface, but with varying capabilities. XPS surveys all elements except hydrogen and helium, while AES is also effective for all elements above helium. SIMS has the unique capability to detect all elements, including hydrogen and helium, and can distinguish between isotopes [5] [76].
Chemical State Information: XPS excels at providing detailed chemical state information and bonding environments. Chemical shifts in photoelectron peaks reveal oxidation states, functional groups, and chemical bonding [75] [76]. AES can provide some chemical state information through line shape changes, though interpretation is more complex. SIMS primarily provides elemental and molecular information but can infer chemical environment through cluster ion identification.
Depth Profiling: All techniques can perform depth profiling through successive material removal and analysis. AES and XPS typically use noble gas ion sputtering (e.g., Ar+) between analysis cycles, while SIMS inherently combines analysis and sputtering, making it exceptionally powerful for ultra-shallow depth profiling and thin film analysis [5].
Imaging and Mapping: Each technique can provide spatially resolved chemical information. AES offers the highest lateral resolution for chemical mapping (down to ~10 nm), followed by SIMS (down to 50 nm), with XPS typically providing lower spatial resolution (≥10 μm) [5].
Figure 1: Fundamental principles of XPS, AES, and SIMS surface analysis techniques.
Comparative Performance Analysis
Quantitative Technical Specifications
The table below summarizes the key performance characteristics of XPS, AES, and SIMS, highlighting the inherent trade-offs between quantitative analysis capabilities and spatial resolution.
Table 1: Technical comparison of XPS, AES, and SIMS surface analysis techniques
| Parameter | XPS | AES | SIMS |
|---|---|---|---|
| Primary Incident Beam | X-rays | Electrons | Ions |
| Detected Species | Photoelectrons | Auger electrons | Secondary ions |
| Sampling Depth | 2-10 nm | 2-10 nm | 1-2 nm |
| Lateral Resolution | ≥10 μm | ~10 nm | 50 nm - 1 μm |
| Detection Limits | 0.1-1 at% | 0.1-1 at% | ppm-ppb |
| Depth Profiling | Good (with sputtering) | Excellent | Excellent |
| Chemical Bonding Information | Excellent | Moderate | Limited |
| Quantitative Accuracy | Excellent (±5-10%) | Good (±10-15%) | Poor (requires standards) |
| Sample Damage | Minimal | Moderate | Severe |
| Analysis Environment | UHV | UHV | UHV |
Data compiled from multiple sources [75] [5] [76].
Key Strategic Trade-offs
The performance data reveals several critical trade-offs that inform technique selection:
Quantitative Accuracy vs. Detection Sensitivity: XPS provides excellent quantitative accuracy (typically ±5-10%) without requiring standard samples, owing to well-understood ionization cross-sections. In contrast, SIMS offers extremely high sensitivity (parts-per-billion range) but suffers from matrix effects that complicate quantification, requiring standardized reference materials for accurate analysis [5] [76].
Chemical Information vs. Spatial Resolution: XPS delivers detailed chemical state information but with limited spatial resolution (typically >10 μm). AES sacrifices some chemical specificity for exceptional spatial resolution (down to ~10 nm), enabling nanoscale elemental mapping [5].
Surface Preservation vs. Information Depth: SIMS provides the shallowest information depth (1-2 nm), making it ideal for monolayer analysis, but causes significant surface damage during analysis. XPS offers non-destructive analysis of the top 2-10 nm, preserving surface chemistry for subsequent analyses [5] [76].
Experimental Protocols and Methodologies
Standard Analysis Procedures
Proper experimental execution requires adherence to established protocols for each technique:
XPS Protocol:
- Sample Preparation: Mount specimen using conductive tape or clips. Avoid surface contact with contaminants. Minimize air exposure for reactive samples [76].
- Instrument Setup: Select Al Kα (1486.6 eV) or Mg Kα (1253.6 eV) X-ray source. Set analyzer pass energy to 20-80 eV for high-resolution scans, 100-200 eV for survey scans [75].
- Data Acquisition: Collect survey spectrum (0-1100 eV binding energy) followed by high-resolution regions for elements of interest.
- Data Analysis: Apply charge referencing (C 1s at 284.8 eV for adventitious carbon), subtract Shirley or Tougaard background, and perform peak fitting using mixed Gaussian-Lorentzian functions [75].
AES Protocol:
- Sample Preparation: Ensure electrical conductivity for non-conductive samples through carbon coating or metal overlayers.
- Instrument Setup: Optimize primary beam energy (3-10 keV), beam current (10 nA-1 μA), and beam diameter for desired spatial resolution [5].
- Data Acquisition: Collect direct N(E) spectra or derivative dN(E)/dE spectra for improved signal-to-noise. For mapping, acquire spectra at each pixel or use peak-to-background ratios.
- Data Analysis: Identify elements using standard Auger transition energies. Quantification requires sensitivity factors and accounting for matrix effects.
SIMS Protocol:
- Sample Preparation: Minimize surface contamination. Use indium foil mounting for irregular samples to enhance electrical contact [76].
- Instrument Setup: Select primary ion species (Cs+ for negative ions, O2+ for positive ions, cluster ions for organic analysis). Optimize impact energy and angle for desired depth resolution and sensitivity [5].
- Data Acquisition: For static SIMS, maintain ion dose below 10¹³ ions/cm² to preserve molecular information. For dynamic SIMS/depth profiling, use higher doses with raster scanning.
- Data Analysis: Mass calibration using known peaks. For depth profiles, convert sputter time to depth using crater measurements. Quantification requires relative sensitivity factors from standards.
Sample Preparation Considerations
Proper sample handling is critical for reliable surface analysis:
- Contamination Control: Surface contaminants (hydrocarbons, silicones, salts) significantly impact analysis results. Handle samples with solvent-cleaned tweezers, avoiding direct contact with analytical areas [76].
- Environmental Effects: The ultra-high vacuum (UHV) requirements of these techniques can alter surface chemistry, particularly for hydrated biological samples where surface reorganization may occur between aqueous and UHV environments [76].
- Electrical Properties: Non-conductive samples require charge compensation (flood guns) in XPS and AES, or thin conductive coatings, though the latter may obscure surface chemistry [75].
Figure 2: Decision workflow for selecting surface analysis techniques based on research objectives.
The Scientist's Toolkit: Essential Research Materials
Successful surface analysis requires specific reagents and materials optimized for each technique:
Table 2: Essential research reagents and materials for surface analysis
| Material/Reagent | Function/Application | Technique |
|---|---|---|
| Indium Foil | Mounting irregular samples for enhanced electrical contact | SIMS, XPS, AES |
| Conductive Carbon Tape | Sample mounting with minimal outgassing | XPS, AES |
| Gold Wire | Reference material for energy calibration | XPS, AES |
| Silicon Wafer Standards | Reference material for quantification | SIMS |
| Argon Gas (99.999%) | Sputter source for sample cleaning and depth profiling | XPS, AES, SIMS |
| Aluminum/Magnesium Anodes | X-ray source materials | XPS |
| Cesium/Iodine/Gold Ion Sources | Primary ion sources | SIMS |
| Charge Neutralization Flood Gun | Compensation of surface charging on insulating samples | XPS |
The choice between XPS, AES, and SIMS represents a fundamental trade-off between quantitative accuracy, spatial resolution, and detection sensitivity. For quantitative compositional analysis with chemical state information, XPS remains the gold standard. When high-spatial resolution elemental mapping is prioritized, AES provides unparalleled capabilities. For ultra-trace detection and detailed depth profiling, SIMS offers unmatched sensitivity.
In practice, a multi-technique approach almost always provides the most comprehensive surface characterization [76]. XPS should typically serve as the initial characterization step to determine surface composition and identify contaminants, followed by either AES for nanoscale spatial resolution or SIMS for trace detection and depth profiling, depending on specific research objectives. By understanding these strategic trade-offs, researchers can optimize their analytical approach for efficient and effective surface characterization across diverse applications in materials science, biomaterials development, and pharmaceutical research.
The Role of Complementary Techniques (EDS, FIB) in Data Validation
In the field of surface analysis, techniques such as X-ray Photoelectron Spectroscopy (XPS), Auger Electron Spectroscopy (AES), and Secondary Ion Mass Spectrometry (SIMS) are powerful tools for characterizing material surfaces. However, the complexity of modern materials, particularly in high-stakes industries like semiconductors and pharmaceuticals, often necessitates a multi-technique approach to achieve comprehensive and validated results. No single technique can provide all the required information about elemental composition, chemical state, and molecular structure with sufficient spatial resolution and sensitivity. The integration of complementary techniques like Energy-Dispersive X-ray Spectroscopy (EDS) and Focused Ion Beam (FIB) milling has become indispensable for enhancing the reliability and depth of surface analysis.
This guide explores the critical roles EDS and FIB play in validating and complementing data obtained from primary surface analysis techniques. By examining their specific capabilities, presenting comparative data, and detailing experimental protocols, we provide a framework for researchers to understand how these techniques interconnect to form a more complete analytical picture.
The following table summarizes the core characteristics of major surface analysis techniques, highlighting how EDS and FIB supplement the primary methods. A direct comparison of all six major techniques is available in the literature [5].
Table 1: Comparison of Surface Analysis and Complementary Techniques
| Technique | Acronym | Primary Function | Typical Information Obtained | Complementarity for Data Validation |
|---|---|---|---|---|
| X-ray Photoelectron Spectroscopy | XPS | Surface chemical analysis | Elemental identity, chemical state, empirical formula [8] | Validated by TOF-SIMS for molecular species and EDS for elemental mapping. |
| Time-of-Flight SIMS | TOF-SIMS | Surface molecular analysis | Detection of organic/inorganic species, high-sensitivity trace analysis [8] | Complementary to XPS; provides higher sensitivity for molecular information. |
| Auger Electron Spectroscopy | AES | Surface elemental analysis | Elemental composition, depth profiling | High spatial resolution surface analysis. |
| Focused Ion Beam | FIB | Micro-machining, sample preparation | Cross-sectioning, TEM lamella preparation, 3D tomography [77] [78] | Enables site-specific analysis and cross-sectional validation of surface findings. |
| Energy-Dispersive X-ray Spectroscopy | EDS | Elemental identification & mapping | Elemental composition, spatial distribution [77] | Provides rapid elemental analysis correlated with morphological features from SEM. |
The Validating Role of Energy-Dispersive X-ray Spectroscopy (EDS)
Core Principles and Applications
EDS is an analytical technique commonly paired with Scanning Electron Microscopy (SEM) that detects X-rays emitted from a sample when excited by an electron beam. It provides rapid elemental analysis and creates spatial distribution maps of elements within a sample. While it lacks the chemical state specificity of XPS or the high-sensitivity trace detection of SIMS, its strength lies in its speed and direct correlation with high-resolution morphology from SEM imaging.
In pharmaceutical sciences, EDS is applied in six key areas, including formulation homogeneity studies and identification of particulate contaminants [79]. Its ability to quickly determine elemental composition makes it a powerful first step in analysis, guiding subsequent, more specific investigations with XPS or TOF-SIMS.
Experimental Protocol: EDS for Elemental Mapping and Thickness Verification
A refined protocol from an ultrathin film study demonstrates the application of EDS for thickness verification and elemental positioning [77].
- Sample Preparation: A 10 nm-thick Hf₀.₅Zr₀.₅O₂ (HZO) film was deposited on a Si substrate by Atomic Layer Deposition (ALD) and capped with a 25 nm Au-Pd layer.
- Instrumentation: Analysis was performed using an SEM equipped with an EDS detector.
- Methodology:
- The electron beam was focused on the region of interest.
- Characteristic X-rays from the sample were collected by the EDS detector.
- The spectra and elemental maps were generated to identify the presence and distribution of Hf, Zr, O, Si, Au, and Pd.
- The interface between the HZO film and the Au-Pd capping layer was identified by monitoring shifts in compositional contrast in the SEM image, verified by changes in the EDS spectra.
- Outcome: EDS provided critical feedback during the FIB milling process, ensuring the ion beam stopped at the correct depth within the HZO layer, thus preserving the region of interest for subsequent TEM analysis [77].
The Enabling Role of Focused Ion Beam (FIB)
Core Principles and Applications
FIB utilizes a focused beam of ions (typically gallium or xenon) for site-specific milling, deposition, and imaging at the nanoscale. Its most critical application in surface analysis is the preparation of thin, electron-transparent specimens for Transmission Electron Microscopy (TEM), known as lamella preparation. This process allows for cross-sectional analysis of interfaces and layers identified by surface techniques, providing a crucial link between surface chemistry and bulk microstructure.
Recent advancements include plasma FIB systems, which use a Xe+ plasma ion source for significantly higher milling rates, enabling large-scale 3D characterization and the preparation of TEM samples from challenging materials. The TESCAN AMBER X 2, for example, integrates a plasma FIB column with a high-resolution SEM, allowing for precise sub-30 nm TEM specimen fabrication without Gallium contamination [78].
Experimental Protocol: FIB for Plan-View Lamella Preparation
A detailed workflow for creating an ultra-thin plan-view lamella from a 10 nm HZO film illustrates the precision of FIB [77].
- Sample Preparation: The HZO film was protected with a ~25 nm sputtered Au-Pd layer, followed by a carbon cap deposited via a Gas Injection System (GIS).
- Instrumentation: A dual-beam FIB-SEM system was used.
- Methodology:
- Rough Milling: A trench was milled around the region of interest using a high-current ion beam (e.g., 15 nA) to isolate a small chunk of material.
- Lift-out: The isolated chunk was welded to a micromanipulator needle, detached from the substrate, and transferred to a TEM grid.
- Fine-Polishing (Critical Step): The lamella was progressively thinned using a sequence of lower-energy ion beams (e.g., 1.5 nA down to 50 pA). The progress was tracked in situ by monitoring contrast changes in the SEM image and verified with EDS spectra to identify the HZO to Au-Pd interface.
- Outcome: The protocol produced electron-transparent lamellae with regions as thin as 3–4 nm, showcasing minimal ion-induced damage and preserved atomic-column integrity. This allowed for unambiguous microstructural and phase analysis of the HZO film in the TEM [77].
The workflow for this FIB-EDS integrated process is summarized below.
Integrated Workflows: Combining XPS, SIMS, FIB, and EDS for Comprehensive Analysis
Case Study: Advanced Battery Cathode Development
A compelling example of technique integration is found in the development of next-generation batteries. Researchers employed a combined XPS and TOF-SIMS approach to study engineered particle (Ep) battery cathodes [8].
- Workflow:
- XPS Analysis: Provided information on the elemental identity, chemical state, and empirical formula of the cathode surface layer.
- TOF-SIMS: Added high-resolution detection of organic and inorganic species, revealing the distribution of specific chemical fragments and contaminants with high sensitivity.
- SXI and Spectral Mosaics: PHI XPS instruments used scanning X-ray induced secondary electron imaging (SXI) to identify regions of interest and efficiently map large sample areas, guiding the more specific TOF-SIMS analysis [8].
This combined chemical imaging approach demonstrated that Ep-coated cathodes exhibit more uniform and controlled interfaces, leading to improved battery performance and long-term stability [8]. In such studies, FIB and EDS can play a further validating role. For instance, FIB can be used to prepare a cross-section of a specific interface identified by XPS/TOF-SIMS, and EDS in the SEM can then provide rapid elemental mapping of that cross-section to correlate chemical state information with elemental distribution.
The logical relationship between primary and complementary techniques in an integrated analysis is depicted below.
Essential Research Reagent Solutions
Table 2: Key Materials and Instruments for Integrated Surface Analysis
| Item | Function in Research |
|---|---|
| Dual-Beam FIB-SEM System | Integrated instrument for simultaneous ion milling (FIB) and high-resolution electron imaging (SEM), essential for site-specific sample preparation and analysis [77] [78]. |
| Plasma FIB Column | Uses Xe+ plasma ions for high-throughput, large-volume milling and clean TEM specimen preparation without Ga+ contamination [78]. |
| EDS Detector | Detector attached to SEM for rapid elemental analysis and mapping, critical for in-situ composition verification during FIB workflows [77]. |
| TEM Grid | A small, usually copper or gold, mesh structure onto which a FIB-lift-out lamella is transferred for subsequent TEM analysis [77]. |
| Gas Injection System (GIS) | Allows for the deposition of protective layers (e.g., carbon, platinum) or conductive coatings directly within the FIB-SEM chamber to protect the sample during milling [77]. |
| Atomic Layer Deposition (ALD) | A precision thin-film deposition technique used to create uniform, nanoscale samples, such as the HZO films studied [77]. |
The pursuit of reliable and insightful surface analysis in modern research demands a synergistic approach. While core techniques like XPS, AES, and SIMS provide foundational chemical and molecular data, their findings are significantly strengthened and validated by complementary techniques. As demonstrated, EDS offers rapid elemental correlation, confirming the distribution of elements identified by their chemical state. Meanwhile, FIB provides unparalleled capability in preparing site-specific samples, enabling cross-sectional analysis that reveals the sub-surface reality of surface observations.
The integration of these techniques into cohesive workflows—such as combining XPS/TOF-SIMS for chemical mapping with FIB/EDS for structural verification—creates a powerful validation framework. This multi-faceted approach is crucial for driving innovation in complex fields, from stabilizing next-generation battery cathodes to developing advanced semiconductor devices, ensuring that conclusions are not just based on surface appearances, but on a comprehensive, validated understanding of the material.
Conclusion
XPS, AES, and SIMS are powerful, complementary surface analysis techniques that, when selected and applied correctly, can profoundly accelerate biomedical innovation. XPS remains the gold standard for quantitative chemical state analysis, AES offers unparalleled nanoscale spatial resolution for elemental mapping, and ToF-SIMS provides exceptional sensitivity for molecular and isotopic imaging. The key takeaway is that no single technique is universally superior; the choice depends on the specific analytical question, whether it concerns surface chemistry, elemental distribution, or molecular composition. Future directions point toward increased integration of these techniques in multimodal platforms, the expansion of in-situ and near-ambient pressure analysis for dynamic biological studies, and the continued development of advanced data processing software to overcome current interpretation challenges. For biomedical researchers, this evolution promises deeper insights into biological interfaces, more robust development of drug delivery systems, and enhanced characterization of next-generation medical implants, ultimately driving improved clinical outcomes.
References
- 1. Evaluation methods for XPS depth profiling; A review [https://www.sciencedirect.com/science/article/pii/S2666523925001825]
- 2. Challenges in surface analysis [https://www.frontiersin.org/journals/analytical-science/articles/10.3389/frans.2023.1234943/full]
- 3. A comparison between Auger and photoelectron emission ... [https://www.sciencedirect.com/science/article/abs/pii/S0368204803002263]
- 4. Comparison of ion-excited Auger electron emission and ... [https://www.sciencedirect.com/science/article/abs/pii/0029554X80910769]
- 5. Comparisons of SIMS, SNMS, ISS, RBS, AES, and XPS ... [https://link.springer.com/chapter/10.1007/978-1-4615-3708-3_7]
- 6. A comparison of spectroscopical techniques in surface ... [https://www.sciencedirect.com/science/article/abs/pii/0165993684800072]
- 7. Auger- and X-ray Photoelectron Spectroscopy at Metallic Li ... [https://www.mdpi.com/2313-0105/8/3/24]
- 8. How XPS and TOF-SIMS Advanced Chemical Imaging ... [https://www.phi.com/news-and-articles/how-xps-and-tof-sims-advanced-chemical-imaging-uncovers-stabilizing-effects-of-engineered-particle-bettery-cathodes.html]
- 9. Comparison of rotational depth profiling with AES and XPS [https://www.sciencedirect.com/science/article/pii/016943329390258D]
- 10. X-ray photoelectron spectroscopy [https://en.wikipedia.org/wiki/X-ray_photoelectron_spectroscopy]
- 11. Auger Electron Spectroscopy (AES) [https://www.eag.com/techniques/spectroscopy/auger-electron-spectroscopy/]
- 12. Auger electron spectroscopy [https://en.wikipedia.org/wiki/Auger_electron_spectroscopy]
- 13. Secondary-ion mass spectrometry [https://en.wikipedia.org/wiki/Secondary-ion_mass_spectrometry]
- 14. Introduction to Secondary Ion Mass Spectrometry (SIMS) ... [https://www.cameca.com/products/sims/technique]
- 15. XPS Detection Limits [http://www.xpsfitting.com/2017/05/xps-detection-limits.html]
- 16. X-Ray Photoelectron Spectrometer (XPS) [https://camcor.uoregon.edu/facilities-and-instrumentation/XPS]
- 17. Auger Electron Spectroscopy (AES) [https://www.mri.psu.edu/materials-characterization-lab/characterization-techniques/browse-30-techniques/auger-electron]
- 18. Comparison with Other Techniques: Surface Analysis [https://www.horiba.com/usa/scientific/technologies/glow-discharge-optical-emission-spectroscopy/comparison-with-other-techniques-surface-analysis/]
- 19. A comparison of spectroscopical techniques in surface ... [https://www.sciencedirect.com/science/article/pii/0165993684800072]
- 20. Practical Guides for X-Ray Photoelectron Spectroscopy ... [https://pmc.ncbi.nlm.nih.gov/articles/PMC6774202/]
- 21. Why is surface analysis important? [https://www.kratos.com/helpful-article/why-is-surface-analysis-important/]
- 22. Comprehensive Guide to Understanding X-ray ... [https://www.brighton-science.com/blog/using-an-xps-to-understand-surfaces-critical-to-adhesion]
- 23. SIMS vs. Other Surface Analysis Techniques [https://atomfair.com/semiconductor-material-primer/article.php?id=G30-591]
- 24. Time-of-Flight Secondary Ion Mass Spectrometry (TOF-SIMS) [https://www.eag.com/techniques/mass-spec/tof-sims/]
- 25. Advantages & Disadvantages of XPS Spectroscopy Testing ... [https://www.innovatechlabs.com/newsroom/2012/advantages-disadvantages-xps-testing-analysis/]
- 26. Surface Analysis Market Size, Trends & Forecast, 2025-2032 [https://www.coherentmarketinsights.com/industry-reports/surface-analysis-market]
- 27. X-ray Photoelectron Spectroscopy (XPS) Market Trends [https://www.360researchreports.com/market-reports/x-ray-photoelectron-spectroscopy-xps-market-202271]
- 28. Review on surface-characterization applications of X-ray ... [https://www.sciencedirect.com/science/article/pii/S2666523922001222]
- 29. XPS and SIMS surface chemical analysis of some ... [https://www.sciencedirect.com/science/article/abs/pii/0368204895025286]
- 30. Biomedical surface analysis: Evolution and future directions ... [https://pmc.ncbi.nlm.nih.gov/articles/PMC5403738/]
- 31. Market Trend Report 2025 - XPS Instrument Consultants (XIC) [https://xpsinstruments.com/market-trend-report-2025/]
- 32. XPS Analysis for Biomedical - Rocky Mountain Labs [https://rockymountainlabs.com/xps-analysis-for-biomedical/]
- 33. Surface modification and chemical surface analysis of ... [https://pubmed.ncbi.nlm.nih.gov/21831695/]
- 34. Difference between XPS Analysis and AES Analysis [https://rockymountainlabs.com/xps-analysis-and-aes-analysis/]
- 35. Biomaterials XPS Analysis [https://www.kratos.com/surface-analysis-application-areas/biomaterials/]
- 36. Auger Electron Spectroscopy (AES) Surface Analysis ... [https://www.phi.com/surface-analysis-contract-lab/aes.html]
- 37. State-of-the-Art Applications of Auger Electron Spectroscopy [https://www.phi.com/news-and-articles/aes-nanoscale-spotlight.html]
- 38. Auger Electron Spectroscopy [https://serc.carleton.edu/msu_nanotech/methods/aes.html]
- 39. Why TOF-SIMS and XPS Are Essential for Next-Gen ... [https://www.phi.com/news-and-articles/how-multiple-phi-surface-analysis-techniques-are-utilized-in-fuel-cell-research.html]
- 40. Field Emission Auger Electron Spectroscopy with Scanning ... [https://www.nrel.gov/materials-science/auger-electron]
- 41. Advancements in ToF-SIMS imaging for life sciences - PMC [https://pmc.ncbi.nlm.nih.gov/articles/PMC10483116/]
- 42. Digitala Vetenskapliga Arkivet [https://www.diva-portal.org/smash/record.jsf?pid=diva2:1999929]
- 43. Recent advances of ToF-SIMS for environmental analysis ... [https://www.sciencedirect.com/science/article/abs/pii/S0003267025008062]
- 44. Investigating intermolecular interactions among CO2, water ... [https://www.frontiersin.org/journals/chemistry/articles/10.3389/fchem.2025.1564084/full]
- 45. Why TOF-SIMS and XPS Are Essential for Next-Gen ... [https://www.phi.com/news-and-articles/why-tof-sims-and-xps-essential-next-gen-battery-research.html]
- 46. Combined Surface Analysis Techniques for Quality Control [https://link.springer.com/chapter/10.1007/978-1-4613-3090-5_4]
- 47. Surface Characterization of Polymer Blends by XPS and ... [https://pmc.ncbi.nlm.nih.gov/articles/PMC5509266/]
- 48. TOF SIMS | Thermo Fisher Scientific - FR [https://www.thermofisher.com/br/en/home/materials-science/sims.html]
- 49. ToF-SIMS sputter depth profiling of interphases and ... [https://pmc.ncbi.nlm.nih.gov/articles/PMC11790834/]
- 50. Electrochemo-mechanical effects of Co-free layered cathode on... [https://pubs.rsc.org/en/content/articlehtml/2025/eb/d5eb00136f]
- 51. X-Ray Photoelectron Spectroscopy | XPS Depth Profiling [https://www.thermofisher.com/us/en/home/materials-science/learning-center/surface-analysis/monatomic-depth-profiling.html]
- 52. XPS depth profiling of nano-layers by a novel trial-and- ... [https://www.nature.com/articles/s41598-024-69495-0]
- 53. Application of high-spatial-resolution secondary ion mass ... [https://www.sciencedirect.com/science/article/pii/S1044580321005647]
- 54. Comparison of Different Analytical Methods for the On-Site ... [https://www.mdpi.com/2076-3417/11/9/3754]
- 55. Auger Electron Spectroscopy (AES) and X-ray ... [https://www.mdpi.com/2076-3417/12/3/1245]
- 56. Revealing the nature of surface charging during X-ray ... [https://www.sciencedirect.com/science/article/pii/S0169433225015685]
- 57. Charging - XPS Instrument Consultants (XIC) [https://xpsinstruments.com/charging/]
- 58. Fluorescence, XPS and ToF-SIMS Surface Chemical State Image Analysis of DNA Microarrays - PMC [https://www.ncbi.nlm.nih.gov/pmc/articles/PMC2533279/]
- 59. Developments and Ongoing Challenges for Analysis ... [https://pmc.ncbi.nlm.nih.gov/articles/PMC8522203/]
- 60. What is the matrix effect? [https://www.eag.com/app-note/what-is-the-matrix-effect/]
- 61. Have you ever made these basic errors in XPS data ... [https://universallab.org/blog/common_issues_in_xps_data_analysis]
- 62. SIMS analysis of oxygen isotopes: matrix effects in complex ... [https://www.sciencedirect.com/science/article/abs/pii/S0009254197000156]
- 63. Matrix effects in biological SIMS using cluster ion beams of ... [https://pubmed.ncbi.nlm.nih.gov/26825287/]
- 64. Auger Electron Spectroscopy | AES Analysis [https://measurlabs.com/methods/auger-electron-spectroscopy-aes/]
- 65. Auger Electron Spectroscopy (AES) Tutorial [https://www.eag.com/app-note/auger-tutorial/]
- 66. Secondary Ion Mass Spectrometry (SIMS) Tutorial [https://www.eag.com/app-note/sims-tutorial/]
- 67. Exploring the Surface Sensitivity of ToF-SIMS by ... [https://pmc.ncbi.nlm.nih.gov/articles/PMC3259203/]
- 68. Oxide thickness determination by XPS , AES , SIMS , RBS and TEM [https://pure.psu.edu/en/publications/oxide-thickness-determination-by-xps-aes-sims-rbs-and-tem/]
- 69. XPS and SIMS characterization [https://www.sciencedirect.com/science/article/abs/pii/S0920586199003004]
- 70. Secondary Ion Mass Spectrometry (SIMS) [https://www.energy.gov/eere/h2awsm/secondary-ion-mass-spectrometry-sims]
- 71. Magnetic Sector Secondary Ion Mass Spectrometry [https://www.nist.gov/programs-projects/magnetic-sector-secondary-ion-mass-spectrometry]
- 72. SPECS Ambient Pressure XPS/STM [http://nnci.oregonstate.edu/ap-xpsap-stm]
- 73. How to Choose Between SIMS and XPS for Thin Film ... [https://eureka.patsnap.com/article/how-to-choose-between-sims-and-xps-for-thin-film-analysis]
- 74. Surface Analysis Market Report | Global Forecast From ... [https://dataintelo.com/report/global-surface-analysis-market]
- 75. Surface analysis techniques and their application to ... [https://www.sciencedirect.com/science/article/pii/0261306988901549]
- 76. Surface Analysis Tools for Characterizing Biological ... [https://pmc.ncbi.nlm.nih.gov/articles/PMC7337324/]
- 77. Ultra-Thin Plan-View Lamella Made by Focused Ion Beam [https://www.sciencedirect.com/science/article/abs/pii/S0304399125001482]
- 78. TESCAN recognized for advancing plasma FIB workflows ... [https://info.tescan.com/matsci-fib-sem/insights/tescan-recognized-for-advancing-plasma-fib-workflows-with-2025-rd-100-award]
- 79. 6 Applications of SEM & EDS in Pharmaceutical Sciences [https://www.nanoscience.com/blogs/6-applications-of-sem-eds-in-pharmaceutical-sciences/]