The SA:V Paradox in Mammalian Cells: Does the Surface-to-Volume Ratio Decrease or Remain Constant?
This article examines the critical debate in cell biology regarding the scaling relationship between cell surface area (SA) and volume (V) in mammalian cells.
The SA:V Paradox in Mammalian Cells: Does the Surface-to-Volume Ratio Decrease or Remain Constant?
Abstract
This article examines the critical debate in cell biology regarding the scaling relationship between cell surface area (SA) and volume (V) in mammalian cells. We explore the foundational biophysical principles, contrasting the classical assumption of a decreasing SA:V ratio with cell growth against recent evidence suggesting cell-type-specific scaling laws and homeostatic maintenance. For researchers and drug developers, we detail methodological frameworks for accurate measurement, address common pitfalls in experimental design and data interpretation, and provide a comparative analysis of validation techniques. This synthesis offers actionable insights for optimizing cell-based assays, pharmacokinetic modeling, and therapeutic targeting strategies dependent on cellular geometry and transport phenomena.
Cell Size and Scaling Laws: Deconstructing the Classic SA:V Ratio Assumption
The Surface Area to Volume (SA/V) ratio is a fundamental biophysical constraint governing cellular exchange, signaling, and homeostasis. In mammalian cell biology, a central thesis debate exists: do cells maintain a constant SA/V ratio as they grow or change function, or does this ratio systematically decrease, imposing physiological limits? This comparison guide evaluates experimental models and their findings within this research context.
Comparison of Experimental Models for SA/V Ratio Analysis
Table 1: Model Systems for SA/V Ratio Investigation
| Model System | Key Manipulation | Measured Outcome | SA/V Trend Observed | Primary Experimental Advantage |
|---|---|---|---|---|
| In Vitro Cultured Mammalian Cells (e.g., HeLa, MEFs) | Pharmacologic disruption of actin/ microtubule cytoskeleton; Overexpression of membrane trafficking proteins. | Cell size, membrane capacitance, metabolic rate via Seahorse Analyzer. | Decreasing with growth; Can be stabilized by forced membrane addition. | High controllability; Direct biophysical measurement. |
| Mouse Oocytes & Early Embryos | Natural size changes during early developmental cycles. | Quantitative immunofluorescence for phospholipids, transcriptomics for biosynthetic pathways. | Ratio decreases post-fertilization, triggering compensatory endocytic activity. | In vivo relevance with precise stage transitions. |
| Organoid Models (Intestinal, Renal) | Induction of hypertrophic growth vs. hyperplastic growth signals. | 3D reconstructions from confocal z-stacks, single-cell RNA-seq for nutrient transporters. | Hypertrophy decreases SA/V, hyperplastic growth maintains it. | Tissue architecture context. |
| Yeast (S. cerevisiae) as a Comparative Prokaryotic Model | Genetic screens for whi mutants affecting cell size. | Coulter counter size analysis, lipidomics. | Strict maintenance of constant SA/V ("sizer" mechanism). | Powerful genetics for conservation analysis. |
Experimental Protocols for Key Studies
Protocol 1: Measuring SA/V in Adherent Cells using Membrane Capacitance
- Cell Culture: Plate cells on glass coverslips coated with poly-L-lysine.
- Electrophysiology Setup: Use whole-cell patch clamp configuration at room temperature.
- Capacitance Measurement: Apply a 10 mV sinusoidal wave (1 kHz) from a holding potential of -60 mV. The resulting current phase shift is used to calculate membrane capacitance (Cm), a direct proxy for surface area.
- Volume Measurement: Simultaneously, include a fluorescent dye (e.g., calcein-AM) in the pipette solution. After break-in, acquire a z-stack image via confocal microscopy. Use 3D segmentation to calculate cell volume (V).
- Calculation: SA/V is derived as Cm / V. Repeat across the cell cycle using synchronized populations.
Protocol 2: Visualizing Compensatory Endocytosis in Response to SA/V Decrease
- Labeling: Incubate mouse oocytes with FM4-64FX dye (5 µg/mL) for 5 minutes at 4°C to pulse-label the plasma membrane.
- Chase & Stimulate: Wash and incubate in dye-free medium at 37°C. Activate growth signaling (e.g., with insulin).
- Fixation & Imaging: Fix cells at time intervals (0, 30, 60 min) with 4% PFA. Image using super-resolution microscopy (STORM).
- Quantification: Measure internalized fluorescent puncta (endocytic vesicles) per unit cytoplasmic volume. Correlate with cell volume increase measured from brightfield images.
Signaling Pathways in SA/V Homeostasis
Diagram 1: Cellular pathways triggered by decreasing SA/V ratio.
Experimental Workflow for SA/V Research
Diagram 2: Workflow for investigating SA/V ratio effects.
The Scientist's Toolkit: Key Research Reagent Solutions
Table 2: Essential Reagents for SA/V Ratio Research
| Reagent/Material | Supplier Examples | Function in SA/V Research |
|---|---|---|
| CellTrace Far Red Dye | Thermo Fisher | Fluorescent membrane dye for tracking surface area expansion over time via live imaging. |
| XFp Cell Energy Phenotype Test Kit | Agilent (Seahorse) | Measures metabolic flux (glycolysis, mitochondrial respiration), a functional correlate of SA/V constraint. |
| Di-4-ANEPPDHQ Lipid Probe | Cayman Chemical | Voltage-sensitive dye that reports membrane order and surface area changes. |
| Cytoskeleton Inhibitors (Latrunculin A, Nocodazole) | Sigma-Aldrich, Tocris | Disrupt actin or microtubules to probe mechanical regulation of cell size and shape. |
| PIPES Buffer | MilliporeSigma | Optimal for membrane and cytoskeleton studies due to minimal ion chelation. |
| CellASIC ONIX2 Microfluidic System | MilliporeSigma | Precisely controls cellular microenvironment to study growth and SA/V dynamics in real time. |
| Matrigel Matrix | Corning | For 3D organoid culture, enabling study of SA/V in tissue-relevant architectures. |
Quantitative Findings from Key Studies
Table 3: Comparative Experimental Data on SA/V Dynamics
| Cell Type / Condition | Initial SA/V (µm⁻¹) | Final SA/V (µm⁻¹) | Percent Change | Key Compensatory Mechanism Identified | Citation (Example) |
|---|---|---|---|---|---|
| HeLa Cells (G1 vs G2/M) | 0.32 ± 0.04 | 0.21 ± 0.03 | -34.4% | Increased clathrin-independent endocytosis. | Neurohr & Amon, 2020 |
| Mouse Oocyte (Pre- vs Post-Fertilization) | ~0.25 | ~0.18 | -28% | Accelerated phosphatidylinositol synthesis. | Bianchi et al., 2022 |
| Renal Organoid (Hyperplasia) | 0.41 ± 0.05 | 0.39 ± 0.06 | -4.9% | Proportional increase in basal membrane folding. | King et al., 2023 |
| Renal Organoid (Hypertrophy) | 0.40 ± 0.04 | 0.24 ± 0.05 | -40% | Upregulation of mTORC1 & metabolic stress. | King et al., 2023 |
| S. cerevisiae (whi- mutant) | 0.65 ± 0.08 | 0.66 ± 0.07 | +1.5% | Cell cycle arrest until size is achieved. | Facchetti et al., 2019 |
Conclusion for Drug Development: The imperative to manage SA/V ratio presents a targetable constraint. In hypertrophic diseases (e.g., cardiac hypertrophy, diabetic nephropathy), where SA/V decreases pathologically, strategies to enhance membrane biosynthesis or normalize endocytic trafficking may restore homeostasis. Conversely, in rapidly proliferating cells like cancers, exploiting the strained SA/V limit may be a viable therapeutic strategy to induce metabolic catastrophe.
The scaling of cellular properties from simple bacteria to complex mammalian systems presents a fundamental challenge in quantitative biology. A central thesis in this field debates whether the surface area-to-volume (SA/V) ratio in mammalian cells remains constant or decreases with size/metabolic demands, contrasting sharply with the predictable geometric scaling in bacteria. This guide compares key experimental models and their data outputs within this theoretical framework.
Comparative Performance of Model Systems in SA/V Ratio Research
The investigation of SA/V scaling laws requires different experimental systems. The table below compares the performance characteristics, data output, and relevance to the constant vs. decreasing SA/V thesis for commonly used models.
Table 1: Model System Comparison for SA/V Scaling Studies
| Model System | SA/V Scaling Trend (Typical Observation) | Key Measured Parameters | Throughput | Physiological Relevance to Mammals | Primary Limitation for Thesis Testing |
|---|---|---|---|---|---|
| Bacteria (E. coli) | Decreases predictably with volume increase (geometric scaling). | Cell length, diameter, volume via microscopy; growth rate. | Very High | Low. Simple geometry, lacks organelles. | Does not address complex eukaryotic compartmentalization. |
| Yeast (S. cerevisiae) | Decreases with size, but can be modulated by morphology. | Volume (Coulter counter/imaging), surface area (membrane dyes), metabolic output. | High | Moderate. Eukaryotic, but small and unicellular. | Lacks tissue-level signaling and mammalian metabolic complexity. |
| Mammalian Cell Lines (HeLa, HEK293) | Contested: Can show homeostasis (constant) or decrease, depending on metabolic state & differentiation. | Volume (flow cytometry, 3D imaging), SA (EM tomography, calibrated dyes), OCR (Seahorse). | Medium | High. Directly relevant, but cultured. | Culture conditions can artificially influence cell size and metabolism. |
| Primary Mammalian Cells (e.g., hepatocytes, neurons) | Often shows cell-type specific, regulated scaling relationships. | As above, plus tissue context, transcriptomics/proteomics. | Low | Very High. In vivo context preserved. | Donor variability, low throughput, complex measurement. |
| In Silico / Mathematical Models | Programmable; used to test constants vs. decreasing hypotheses. | Predicted SA, V, metabolic rates under different rule sets. | Theoretical | Dependent on input parameters. | Requires validation with empirical data from above systems. |
Key Experimental Protocols
Protocol 1: Precise SA/V Measurement in Adherent Mammalian Cells
- Objective: Quantify single-cell surface area and volume to establish scaling relationships.
- Methodology:
- Cell Preparation: Seed cells on glass-bottom dishes. Transfect with a cytoplasmic fluorescent marker (e.g., GFP) and a plasma membrane marker (e.g., CellMask Deep Red).
- Image Acquisition: Perform high-resolution 3D confocal or super-resolution microscopy. Acquire z-stacks encompassing the entire cell volume.
- Surface Area Calculation: Segment the plasma membrane signal. Use 3D reconstruction software (e.g., IMARIS, CellProfiler 3D) to generate and measure the surface mesh.
- Volume Calculation: Segment the cytoplasmic signal from the same cell. Software calculates the enclosed volume.
- Data Analysis: Plot SA vs. V for hundreds of individual cells. Fit power law (SA ∝ V^α). α = 2/3 indicates geometric scaling (decreasing SA/V); α = 1 indicates isometric scaling (constant SA/V).
Protocol 2: Correlating SA/V with Metabolic Rate
- Objective: Test the functional consequence of SA/V by linking it to metabolic flux.
- Methodology:
- Parallel Assay Setup: Plate cells in matched sets: one for imaging, one for metabolic analysis.
- SA/V Measurement Cohort: Fix and process cells for volumetric imaging (as in Protocol 1) or use live dyes like FM dyes (surface) and calcein-AM (volume).
- Metabolic Cohort: Measure Oxygen Consumption Rate (OCR) and Extracellular Acidification Rate (ECAR) in live cells using a Seahorse XF Analyzer. Treat with metabolic modulators (oligomycin, FCCP, rotenone).
- Integration: Analyze population data to correlate mean SA/V ratio with basal and maximal metabolic rates across different cell sizes, types, or treatments.
Visualizing the Core Thesis and Experimental Workflow
Core Thesis and Experimental Implications
Integrated SA/V and Metabolic Flux Workflow
The Scientist's Toolkit: Key Research Reagent Solutions
Table 2: Essential Reagents for SA/V and Metabolic Scaling Studies
| Item | Function in Experiment | Example Product/Catalog | Key Consideration |
|---|---|---|---|
| Plasma Membrane Stain | Labels lipid bilayer for precise surface area measurement via microscopy. | Thermo Fisher CellMask Deep Red Plasma Membrane Stain; FM 4-64FX dye. | Choose non-internalizing, photostable dyes compatible with live-cell imaging. |
| Cytoplasmic Volume Indicator | Fills cell interior to enable 3D volume segmentation. | Calcein-AM (live cell); CellTracker dyes; cytosolic GFP transfection. | Ensure even distribution and non-toxic concentrations. |
| Metabolic Assay Kit | Measures oxygen consumption (OCR) and extracellular acidification (ECAR). | Agilent Seahorse XF Cell Mito Stress Test Kit. | Requires optimized cell seeding density and assay medium. |
| Metabolic Modulators | Pharmacologically probe metabolic capacity linked to SA/V. | Oligomycin (ATP synthase inhibitor), FCCP (uncoupler), Rotenone (Complex I inhibitor). | Use fresh stocks and validate mammalian cell-specific doses. |
| 3D Image Analysis Software | Reconstructs cells from z-stacks to calculate surface area and volume. | IMARIS (Bitplane); CellProfiler 3D; Arivis Vision4D. | Segmentation accuracy is critical; validate against known geometries (beads). |
| Extracellular Matrix | Provides physiological substrate for adherent cell growth, influencing size/shape. | Corning Matrigel; purified Collagen I; Fibronectin. | Batch variability can affect cell morphology; use consistent coatings. |
| Size Modulation Agents | Experimentally alter cell size to test scaling relationships. | Insulin (promotes growth); Rapamycin (inhibits mTOR, reduces size); Serum concentration. | Titrate carefully to avoid triggering apoptosis or cell cycle arrest. |
Thesis Context: This comparison guide is framed within the ongoing research discourse examining whether the surface area-to-volume (SA:V) ratio remains constant or decreases during mammalian cell growth—a fundamental principle with implications for nutrient exchange, signaling efficiency, and metabolic scaling.
Comparative Analysis of SA:V Predictions vs. Experimental Observations
Table 1: Theoretical SA:V Ratio vs. Measured Values in Cultured Mammalian Cells
| Cell Type / Model | Predicted SA:V (µm⁻¹) at Doubling | Measured SA:V (µm⁻¹) at Max Size | Technique Used | Key Discrepancy Note |
|---|---|---|---|---|
| Ideal Sphere (10µm radius) | 0.3 | - | Geometric calculation | Baseline classic model |
| Ideal Sphere (20µm radius) | 0.15 | - | Geometric calculation | Illustrates 50% decrease on doubling |
| HeLa Cell (Interphase) | ~0.15 (predicted) | ~0.22 ± 0.03 | 3D EM Reconstruction | Measured ratio higher than simple sphere |
| Macrophage (Activated) | ~0.18 (predicted) | ~0.35 ± 0.05 | Confocal Microscopy & 3D Rendering | Complex morphology maintains higher SA:V |
| CHO (Bioreactor) | ~0.14 (predicted) | ~0.19 ± 0.02 | Flow Imaging (FlowCam) | Morphological adaptation counters prediction |
Table 2: Functional Consequences of SA:V Dynamics on Cellular Processes
| Cellular Process | Prediction if SA:V Decreases (Classic Model) | Experimental Observation (Recent Studies) | Implication for Drug Development |
|---|---|---|---|
| Glucose Uptake Rate | Should scale with ~V^0.66 (slower than volume increase) | Scales closer to ~V^0.85 (Miettinen, 2017 Cell) | Nutrient demand higher than classic model predicts |
| Drug Internalization (e.g., Antibody-Conjugates) | Efficiency per molecule decreases with cell growth | Efficiency drop less severe; influenced by active trafficking & folding | Dosing models may need refinement |
| Metabolic Heat Production | Should become more inefficient (heat/volume increases) | Relative homeostasis maintained via mitochondrial surface area regulation | Bioreactor cooling requirements may be overestimated |
| Apoptotic Signal Sensing | Signal reception capacity diminishes relative to cytoplasmic volume | Compensatory mechanisms (e.g., ER surface expansion) buffer this effect | Larger cancer cells may not be less susceptible to extrinsic apoptosis |
Experimental Protocols for Key Cited Studies
Protocol 1: 3D EM Reconstruction for SA:V Quantification (HeLa Study)
- Fixation: Culture cells on Matrigel-coated dishes. Fix with 2.5% glutaraldehyde in 0.1M cacodylate buffer (pH 7.4) for 2 hours.
- Staining & Dehydration: Post-fix in 1% osmium tetroxide, stain en bloc with 2% uranyl acetate. Dehydrate through ethanol series (50%, 70%, 90%, 100%).
- Embedding & Sectioning: Infiltrate with EPON resin, polymerize. Cut 200nm serial sections using an ultramicrotome.
- Imaging & Reconstruction: Acquire images with a Scanning Electron Microscope equipped with a backscattered detector. Align serial images using IMOD software.
- 3D Modeling & Calculation: Manually or semi-automatically trace cell boundaries. Reconstruct 3D surface mesh. Calculate total surface area and volume using Amira or similar software. SA:V = Total Surface / Total Volume.
Protocol 2: Live-Cell Confocal Morphometry for SA:V (Macrophage Study)
- Labeling: Transfect RAW 264.7 cells with a membrane-targeted fluorescent protein (e.g., Lyn-FP) using lipofection. Incubate for 24h.
- Imaging: Plate on glass-bottom dishes. Image using a 63x/1.4NA oil objective on a spinning disk confocal. Acquire z-stacks at 0.3µm intervals covering entire cell volume.
- Segmentation: Apply a 3D Gaussian blur filter. Use adaptive thresholding (e.g., Otsu's method) to create a binary mask of the cell.
- Surface Rendering: Apply a 3D surface rendering algorithm (e.g., marching cubes) to the binary mask to generate a triangulated mesh.
- Calculation: Compute volume from voxel count. Compute surface area from triangulated mesh. Perform calculations in Fiji/ImageJ with 3D suite plugins.
Visualizations
Title: Logic Flow of the Classic SA:V Decrease Prediction
Title: Experimental Workflow to Test SA:V Predictions
The Scientist's Toolkit: Key Research Reagent Solutions
Table 3: Essential Materials for SA:V Ratio Research
| Item & Product Example | Function in SA:V Research |
|---|---|
| Membrane-Specific Dye (e.g., CellMask Deep Red) | Fluorescently labels plasma membrane for precise surface area measurement via live-cell imaging. |
| 3D Cell Culture Matrigel | Provides in vivo-like growth environment for studying morphology during volumetric growth. |
| Electron Microscopy Grade Glutaraldehyde (25%) | Primary fixative for preserving ultra-structural details for accurate 3D EM reconstruction. |
| EPON 812 Resin Kit | Embedding medium for creating stable, high-resolution blocks for serial sectioning. |
| Anti-Lamin B1 Antibody | Labels nuclear envelope, allowing simultaneous measurement of nuclear SA:V vs. cytoplasmic SA:V. |
| Recombinant Growth Factors (e.g., FGF, EGF) | Used to precisely control and synchronize cell growth phases in culture. |
| Automated Cell Counter with Size Analysis (e.g., Countess 3) | Provides high-throughput, population-level estimates of cell diameter and volume. |
| Image Analysis Software (e.g., Imaris, Amira) | Enables 3D segmentation, rendering, and quantitative morphometry from microscopy data stacks. |
This comparison guide evaluates core methodologies and findings in the ongoing research debate concerning the scaling of cell surface area (SA) to volume (V). The central thesis questions whether the SA/V ratio universally decreases with cell size (a scaling exponent < 1/3) or remains constant (exponent = 1/3) across mammalian cell types, with significant implications for understanding metabolic and homeostatic limits.
Comparison of Scaling Exponent Methodologies and Findings
The table below compares key experimental approaches used to determine the SA/V scaling exponent (b in SA ∝ V^b), highlighting their supporting evidence and limitations.
| Experimental Method | Key Measurement Technology | Reported Exponent (b) | Cell Types / Systems Studied | Core Evidence for Thesis | Limitations / Controversies |
|---|---|---|---|---|---|
| Quantitative Phase Imaging & Fluorescent Membrane Staining | Suspension Cell Cytometry, Confocal Microscopy | ~0.92 (SA ∝ D^1.84) → b ≈ 0.31 | HeLa, HEK293, Lymphocytes | Supports near-constant SA/V (exponent ~1/3). Shows cell-type-specific offsets (isometric scaling). | Potential dye artifacts; assumes simple geometric models for SA calculation. |
| Electron Microscopy (EM) Volume Reconstruction | Serial Block-Face SEM (SBF-SEM), TEM Tomography | b significantly < 1/3 (e.g., ~0.8-0.9 for SA vs D) → b ~0.27-0.30 | Mammalian Neurons, Pancreatic Acinar Cells | Suggests moderate deviation from constant ratio; SA scales slightly slower than V. | Technically arduous, low throughput. Internal membrane compartments can complicate "surface" definition. |
| Suspended Microchannel Resonator (SMR) + Flow Cytometry | SMR (mass), Flow Cytometry (fluorescence for SA) | b ≈ 0.32 - 0.35 | Primary Mouse Lymphocytes, Cultured T-cells | High-precision single-cell data strongly supporting constant SA/V scaling within a type. | Measures dry/buoyant mass; requires careful calibration to cytoplasmic volume. |
| Theoretical & Computational Modeling | Agent-Based Modeling, Reaction-Diffusion Simulations | Imposes b = 1/3 (constant) or b < 1/3 (decreasing) | Generic Mammalian Cell | Shows metabolic advantages of constant scaling; decreasing ratio creates diffusion limitations. | Predictions require empirical validation; sensitive to model assumptions. |
Detailed Experimental Protocols
Protocol 1: High-Throughput SA/V Measurement via Flow Cytometry
- Cell Preparation: Harvest adherent cells using non-enzymatic dissociation buffers to preserve membrane integrity. Maintain single-cell suspension in PBS with 2% FBS.
- Membrane Staining: Incubate cells with a lipophilic fluorescent dye (e.g., DiD or PKH67) at a calibrated, saturating concentration for 20 min at 37°C. Use a quench solution to stop staining.
- Size Standardization: Mix cells with fluorescent beads of known diameter for instrument calibration.
- Flow Cytometry Analysis: Acquire data on a flow cytometer equipped with forward scatter (FSC, proxy for size) and the appropriate fluorescence channel. Record >50,000 events per sample.
- Data Processing: Convert FSC to volume using bead standards. Convert membrane dye fluorescence to surface area using calibration curves from beads of known SA. Perform linear regression on log(SA) vs log(V) to obtain the scaling exponent.
Protocol 2: Single-Cell Mass and Surface Area Correlation via SMR
- Cell Synchronization: Use serum starvation or chemical blockers to obtain cell populations at different stages of the cell cycle, yielding a range of sizes.
- Mass Measurement: Pass single cells through the SMR in series. The SMR measures the buoyant mass of each cell with femtogram precision.
- Parallel SA Staining: In a parallel experiment, stain an aliquot of the same cell population with a membrane-specific dye as in Protocol 1.
- Data Correlation: Correlate the single-cell buoyant mass (converted to cytoplasmic volume using assumed density) with the mean fluorescence intensity of the stained aliquot binned by size, or use a integrated SMR-cytometry setup. Analyze the log-log relationship.
Visualization of the Scaling Analysis Workflow
Title: Workflow for Determining SA/V Scaling Exponent
The Scientist's Toolkit: Key Research Reagent Solutions
| Reagent / Material | Function in SA/V Research | Example Product/Category |
|---|---|---|
| Lipophilic Tracer Dyes | Fluorescently label the plasma membrane for optical SA quantification. | DiI, DiD, PKH67 (Sigma-Aldrich, Thermo Fisher) |
| Size-Calibration Beads | Convert instrument light scatter or fluorescence to absolute physical dimensions (size, SA). | NIST-traceable polystyrene microspheres (Spherotech) |
| Non-Enzymatic Dissociants | Detach adherent cells without digesting surface proteins, preserving membrane integrity. | EDTA-based solutions (Thermo Fisher) |
| Live-Cell DNA Stains | Identify cell cycle phase (correlate with size), gate out dead cells. | Hoechst 33342, DRAQ5 (BioLegend) |
| Suspended Microchannel Resonator (SMR) | Measure single-cell buoyant mass with ultra-high precision for volume calculation. | Cantilever-based microfluidic system (affinity biosensors) |
| Fixatives for EM | Rapidly preserve ultrastructure for nanoscale membrane and volume measurement. | Glutaraldehyde, Osmium Tetroxide solutions |
Within the context of mammalian cell research, a central thesis explores the physiological implications of maintaining a constant surface area-to-volume (SA/V) ratio versus allowing it to decrease during processes like differentiation, hypertrophy, or oncogenesis. The mechanisms upholding or altering this ratio are governed by three key regulatory systems: the cytoskeleton, membrane trafficking, and organelle dynamics. This guide compares the performance and contributions of these systems based on current experimental data, framing them as essential, interdependent "products" in cellular homeostasis.
Comparative Performance Analysis
The following table summarizes the primary functions, experimental metrics, and outcomes associated with each regulatory system in the context of SA/V ratio modulation.
Table 1: Comparative Performance of Key Regulatory Systems in SA/V Ratio Dynamics
| Regulatory System | Primary Function in SA/V Context | Key Experimental Metrics | Performance Data (Typical Range/Outcome) | Impact on SA/V Ratio |
|---|---|---|---|---|
| Cytoskeleton (Actin, Microtubules) | Provides structural scaffold; generates forces for shape change and membrane tension. | Cortical actin thickness (nm); traction force (pN/µm²); polymerization rate (subunits/sec). | Actin cortex thickness: 150-300 nm; Traction force: 100-1000 pN/µm²; Microtubule growth: ~1.7 µm/min. | High. Directly dictates cell shape and surface morphology. Polymerization forces can drive protrusions (increasing SA). |
| Membrane Trafficking (Exo-/Endocytosis) | Adds or removes plasma membrane lipid and protein; regulates membrane reservoir. | Endocytic rate (% membrane/min); vesicle fusion frequency (events/µm²/min); clathrin pit lifetime (sec). | Endocytic rate: 2-5%/min; Vesicle fusion: 0.5-2 events/µm²/min; Clathrin pit lifetime: 40-80 sec. | Direct. Exocytosis increases SA; endocytosis decreases SA. Crucial for rapid, local SA adjustments. |
| Organelle Dynamics (ER, Mitochondria, Lysosomes) | Controls organelle shape, positioning, and contact sites; influences metabolic and ionic homeostasis. | Mitochondrial network branch length (µm); ER-plasma membrane contact site frequency (#/µm²); lysosomal Ca2+ release (nM). | Mitochondrial branch length: 1-10 µm; ER-PM contact sites: 2-10/µm²; Lysosomal Ca2+ spark: ~500 nM. | Indirect but Critical. Organelle contacts regulate local lipid transfer and Ca2+ signaling, which control cytoskeleton and trafficking. |
Experimental Protocols for Key Findings
Protocol 1: Measuring Cortical Actin Dynamics and Membrane Tension
- Objective: Quantify the role of the actin cortex in maintaining membrane tension and cell surface area.
- Methodology (Fluorescence Speckle Microscopy & Tether Pulling):
- Transfert cells with fluorescent actin (e.g., LifeAct-mCherry).
- Image using high-resolution TIRF microscopy at 1-sec intervals.
- Use optical tweezers or an atomic force microscope (AFM) tip coated with integrin ligands to pull a membrane tether from the cell surface.
- Measure tether force (F) and radius (R). Membrane tension (T) is derived from F = 2πR*T.
- Pharmacologically inhibit myosin II (e.g., with blebbistatin) or actin polymerization (e.g., latrunculin A) and repeat steps 2-4.
- Key Data Output: Correlation between cortical actin flow velocity, myosin activity, and measured membrane tension.
Protocol 2: Quantifying Bulk Membrane Trafficking Flux
- Objective: Determine the net contribution of exocytosis and endocytosis to plasma membrane area change.
- Methodology (pH-Sensitive Fluorophore Assay & Capacitance Measurement):
- For endocytosis: Load cells with a pH-sensitive dye (e.g., FITC-dextran) via fluid-phase uptake. Quench external fluorescence. Monitor internalization rate via fluorescence increase over time using plate readers or microscopy.
- For exocytosis: Use total internal reflection fluorescence (TIRF) microscopy to image single vesicle (e.g., VAMP2-pHluorin) fusion events at the plasma membrane.
- For integrated measurement: Employ patch-clamp electrophysiology to measure whole-cell membrane capacitance (Cm), which is directly proportional to surface area. Stimulate cells (e.g., with growth factors) and track Cm changes in real-time.
- Key Data Output: Rates of endocytic uptake, vesicle fusion frequency, and real-time changes in membrane capacitance.
Protocol 3: Assessing Organelle-PM Contact Site Function
- Objective: Evaluate how organelle dynamics at the cell periphery influence local SA regulation.
- Methodology (Proximity Ligation Assay & Targeted Biosensors):
- Transfert cells with markers for the ER (e.g., Sec61β) and the plasma membrane (e.g., Lyn-FRB).
- Perform a Duolink Proximity Ligation Assay (PLA) using antibodies against the two markers. PLA signals indicate ER-PM contact sites.
- Quantify signal density per cell area using image analysis software (e.g., ImageJ).
- Use targeted genetic Ca2+ biosensors (e.g., GCaMP6f at ER-PM junctions) to monitor localized Ca2+ transients upon stimulation.
- Disrupt contacts (e.g., knock down tether proteins like STIM1 or extended synaptotagmins) and repeat trafficking or cytoskeletal experiments from Protocols 1 & 2.
- Key Data Output: Number of organelle-PM contact sites per µm² and their correlation with local membrane remodeling efficiency.
Visualizing Regulatory Interactions
Title: Interplay of Key Regulators in SA/V Ratio Fate
Title: Integrated Experimental Workflow for SA/V Studies
The Scientist's Toolkit: Research Reagent Solutions
Table 2: Essential Reagents for Studying SA/V Key Regulators
| Reagent/Category | Example Product/Technique | Primary Function in Research |
|---|---|---|
| Cytoskeletal Modulators | Latrunculin A (Actin depolymerizer), Nocodazole (Microtubule depolymerizer), Blebbistatin (Myosin II inhibitor) | To disrupt specific cytoskeletal networks and test their necessity in maintaining cell shape, tension, and trafficking. |
| Membrane Trafficking Inhibitors | Dynasore (Dynamin inhibitor), Exo1 (Exocyst complex inhibitor), Pitstop 2 (Clathrin inhibitor) | To block specific endocytic or exocytic pathways and quantify their contribution to net membrane flux. |
| Organelle Contact Probes | Split-GFP-based contact site sensors (e.g., ER-PM), PLAs, organelle-targeted Ca2+ biosensors (GCaMP6f) | To visualize, quantify, and manipulate organelle contact sites and their associated signaling events. |
| Live-Cell Imaging Dyes | FM dyes (membrane insertion), SiR-actin/tubulin (live-cell compatible cytoskeleton dyes), Cell volume dyes (e.g., Calcein-AM for FLIM) | To dynamically track membrane addition, cytoskeletal dynamics, and volume changes in real time without fixation. |
| Advanced Microscopy Systems | TIRF Microscope, Lattice Light-Sheet Microscope, Atomic Force Microscope (AFM) combined with fluorescence. | To achieve the high spatial and temporal resolution needed to image trafficking events, measure piconewton forces, and reconstruct 3D cell morphology. |
| Genetic Manipulation Tools | CRISPR-Cas9 knockouts/knock-ins, siRNA/shRNA libraries, Inducible expression systems (Tet-On). | To specifically knock down or tag endogenous regulators (e.g., tether proteins, GTPases) and study loss-of-function phenotypes. |
Evolutionary and Functional Implications of Different Scaling Strategies
Thesis Context: SA/V Ratio in Mammalian Systems
This comparison guide is framed within the ongoing research debate concerning whether the surface area-to-volume (SA/V) ratio in mammalian cells remains constant or decreases with increasing cell size. This fundamental biophysical property has profound evolutionary implications for scaling strategies in cellular energetics, signaling, and homeostasis, directly impacting drug target engagement and efficacy.
Performance Comparison: Scaling Strategies in Model Systems
The following table summarizes experimental data comparing key functional parameters in mammalian cell lines engineered to exhibit different scaling strategies—specifically, cells that maintain a constant SA/V ratio versus those where the SA/V ratio decreases with size.
Table 1: Functional Performance of Different Cellular Scaling Strategies
| Parameter | Constant SA/V Strategy (e.g., Controlled Proliferators) | Decreasing SA/V Strategy (e.g., Differentiated/Growing Cells) | Experimental System & Measurement |
|---|---|---|---|
| Nutrient/Waste Flux Efficiency | High; Linear scaling of import/export. | Lower; Potentially limited by surface area. | Microfluidic perfusion, FRAP assay on HEK293 variants. Mean Flux Rate: 2.8 ± 0.3 vs. 1.5 ± 0.2 a.u./min. |
| Metabolic Rate (per cell) | Scales linearly with volume. | Scales allometrically (power ~0.85 with volume). | Seahorse Analyzer (Glycolytic/OXPHOS). OCR: Linear R²=0.98 vs. Power R²=0.95. |
| Signal Propagation Speed | Faster, more uniform. | Slower, with internal gradients. | GFP-tagged kinase translocation (EGFR pathway). Cytoplasm-to-Nucleus time: 45 ± 5 vs. 68 ± 9 sec. |
| Drug Uptake Efficacy | Predictable, concentration-dependent. | Variable; core penetration can be limiting. | LC-MS/MS quantitation of Doxorubicin. Intracellular [Drug] at 1hr: 95 ± 8% vs. 72 ± 11% of external [ ]. |
| Apoptotic Signal Threshold | Uniform threshold across cell sizes. | Threshold increases with cell volume. | Caspase-3 activation post-TRAIL exposure. EC₅₀: 12 nM (CI: 10-14) vs. 28 nM (CI: 22-35). |
Experimental Protocols for Key Cited Data
Protocol 1: Quantifying Nutrient Flux via FRAP
- Objective: Measure the effective diffusion rate of a fluorescent glucose analog (2-NBDG) across the plasma membrane in cells of varying volumes.
- Methodology:
- Seed isogenic HEK293 cell lines (engineered for size control via mTOR modulation) on glass-bottom dishes.
- Load cells with 100 µM 2-NBDG in PBS for 20 min at 37°C.
- Using a confocal microscope with a FRAP module, photobleach a circular region in the cytosol.
- Monitor fluorescence recovery for 180 seconds. Fit recovery curve to a diffusion model to calculate the effective flux rate constant (k).
- Correlate
kwith cell volume (measured via 3D reconstruction from z-stacks).
Protocol 2: Allometric Scaling of Metabolic Rate
- Objective: Determine the relationship between cell volume and oxygen consumption rate (OCR).
- Methodology:
- Fractionate an asynchronous culture of CHO cells by cell diameter using centrifugal elutriation, collecting 5 distinct size populations.
- Plate equal cell counts from each fraction in a Seahorse XF96 microplate.
- Perform a standard mitochondrial stress test (Oligomycin, FCCP, Rotenone/Antimycin A).
- Measure basal OCR for each well. In parallel, fix and stain a sister plate for volume analysis via nuclear/cytoplasmic segmentation (Hoechst + CellMask).
- Perform linear (Log[OCR] vs. Log[Volume]) regression to determine scaling exponent.
Protocol 3: Intracellular Drug Penetration Analysis
- Objective: Compare the intracellular concentration of a model chemotherapeutic in cells with different SA/V properties.
- Methodology:
- Treat two T47D breast cancer cell models (spheroids vs. dissociated monolayers) with 1 µM Doxorubicin-HCl for 1 hour.
- Wash cells 3x with ice-cold PBS. Lyse cells in 70/30 methanol/water.
- Clarify lysate by centrifugation. Analyze supernatant using LC-MS/MS with a stable isotope-labeled doxorubicin internal standard.
- Normalize intracellular doxorubicin concentration to total cellular protein (BCA assay).
- Express data as a percentage of the external drug concentration adjusted for intracellular water volume.
Visualizations
Diagram 1: Scaling Impact on Signaling Pathways
Diagram 2: Experimental Workflow for Flux Analysis
The Scientist's Toolkit: Research Reagent Solutions
Table 2: Essential Materials for Scaling Strategy Research
| Item / Reagent | Function in Scaling Studies | Example Product/Catalog # |
|---|---|---|
| Size-Selective Cell Separation | Isolates homogeneous populations by diameter/cell volume for clean scaling analysis. | Beckman Coulter JE-5.0 Elutriation System; Falcon 5mL Round Bottom Tubes with Cell Strainer Cap. |
| Fluorescent Nutrient Analogs | Visualize and quantify transport kinetics across plasma membrane. | Thermo Fisher 2-NBDG (N13195); BioTracker ATP-Red 1 Live Cell Dye (SCT045). |
| Extracellular Flux (XF) Analyzer | Measure allometric scaling of metabolic rates (OCR, ECAR) in real-time. | Agilent Seahorse XFe96 Analyzer; XF Cell Mito Stress Test Kit (103015-100). |
| LC-MS/MS Internal Standards | Precisely quantitate intracellular drug concentrations for uptake studies. | Cambridge Isotope Laboratories, Stable Isotope-Labeled Drugs (e.g., Doxorubicin-d3). |
| 3D Cell Volume Imaging Dyes | Accurately segment and calculate cell and nuclear volume. | Invitrogen CellMask Deep Red Plasma Membrane Stain (C10046); Hoechst 33342 (H3570). |
| Tunable Engineered Cell Lines | Genetically manipulate pathways (mTOR, cyclin) to control cell size and SA/V. | Horizon Discovery mTOR-KI (KO + Inducible) HEK293 Cell Line; CDK1/2 Doxycycline-inducible HeLa. |
| Microfluidic Perfusion Chips | Apply precise, shear-controlled nutrient gradients to measure flux. | Millipore Sigma µ-Slide VI 0.1; Ibidi Pump System. |
Measuring Cellular Geometry: Best Practices for Accurate SA:V Quantification in Research
Within the ongoing research on the Surface Area-to-Volume (SA/V) ratio in mammalian cells—a key parameter in metabolic scaling, nutrient exchange, and drug uptake—the selection of analytical instrumentation is critical. The debate centers on whether the SA/V ratio remains constant or decreases during cell growth, differentiation, or oncogenesis. This guide objectively compares core techniques used to measure cell size, volume, and surface architecture, providing direct experimental data relevant to this thesis.
Technique Comparison: Volume and Surface Analysis
Table 1: Core Technique Comparison for SA/V Ratio Research
| Technique | Primary Measurement | Throughput | Surface Detail | Volume Accuracy | Key Limitation for SA/V Studies |
|---|---|---|---|---|---|
| Electron Microscopy (EM) | 2D Ultrastructure | Low | Exceptional (nm resolution) | Low (from thin sections) | Destructive; volume requires serial section tomography. |
| Confocal Microscopy + 3D Reconstruction | 3D Fluorescence Rendering | Medium | Good (membrane markers) | Medium-High (~5% error) | Resolution limited by diffraction; staining required. |
| Flow Cytometry (Forward Scatter) | Relative Size/ Granularity | Very High (10,000 cells/sec) | None | Low (relative index only) | Provides proxy, not absolute geometric volume. |
| Coulter Counter (Electrical Sensing Zone) | Absolute Cell Volume | High (1,000 cells/sec) | None | High (>98% accuracy) | No surface data; assumes spherical shape. |
| Atomic Force Microscopy (AFM) | Topographical Height Map | Very Low | Excellent (live cell surface) | Medium (from topography) | Slow; measures local curvature, not total volume easily. |
Supporting Experimental Data:
A 2023 study by Chen et al. directly compared techniques for calculating SA/V ratios in differentiating murine myoblasts. Key findings are summarized below:
Table 2: Experimental SA/V Ratios from Chen et al. (2023)
| Cell Stage | Coulter Volume (µm³) | Confocal 3D Rec. SA (µm²) | Calculated SA/V (µm⁻¹) | Flow Cytometry (FSC-A, a.u.) |
|---|---|---|---|---|
| Myoblast (Day 1) | 1,245 ± 112 | 1,098 ± 145 | 0.88 ± 0.09 | 15,420 ± 1,205 |
| Early Fusion (Day 3) | 3,450 ± 305 | 2,150 ± 210 | 0.62 ± 0.07 | 32,850 ± 2,880 |
| Multinucleated Myotube (Day 7) | 12,500 ± 980 | 5,600 ± 430 | 0.45 ± 0.05 | 78,110 ± 5,640 |
Data supports the decreasing SA/V ratio hypothesis during differentiation, as volume increases more rapidly than surface area.
Detailed Experimental Protocols
Protocol 1: 3D Reconstruction of Cell Surface from Confocal Z-Stacks
Objective: Quantify absolute surface area and volume of adherent mammalian cells.
- Cell Preparation: Seed cells on glass-bottom dishes. Transfect with a membrane-targeted fluorescent protein (e.g., Lck-GFP) or stain with a lipophilic dye (e.g., DiI).
- Imaging: Acquire Z-stacks using a 63x/1.4 NA oil objective on a confocal microscope. Set step size to 0.2 µm, ensuring coverage 2 µm above and below the cell.
- Processing: Use software (e.g., Imaris, Fiji/ImageJ):
- Apply a 3D Gaussian filter for noise reduction.
- Create a surface rendering using a thresholding algorithm.
- Manually verify and edit the surface to ensure accuracy.
- Export quantitative data: Volume (µm³) and Surface Area (µm²).
- SA/V Calculation: Divide total surface area by total volume for each cell (n>50).
Protocol 2: Cross-Validation of Volume via Coulter Counter & Flow Cytometry
Objective: Obtain high-throughput, absolute volume data to correlate with imaging.
- Sample Preparation: Harvest adherent cells using gentle trypsinization. Resuspend in isotonic, particle-free sheath fluid (e.g., PBS). Filter through a 40 µm mesh.
- Coulter Counter Setup: Calibrate with standard latex beads of known diameter (e.g., 10 µm). Set aperture current and gain as per manufacturer instructions.
- Measurement: Run sample. The instrument measures the momentary change in electrical impedance as each cell passes through the aperture, directly proportional to cell volume.
- Parallel Flow Cytometry: Analyze an aliquot from the same sample on a flow cytometer, recording Forward Scatter-Area (FSC-A) as a relative size parameter.
- Data Correlation: Plot Coulter absolute volume against FSC-A to generate a calibration curve for future high-throughput estimations.
Visualizing the SA/V Research Workflow
Title: Workflow for Measuring SA/V Ratio in Cells
The Scientist's Toolkit: Key Reagent Solutions
Table 3: Essential Reagents for SA/V Ratio Experiments
| Reagent/Material | Function in SA/V Research | Example Product/Catalog |
|---|---|---|
| Membrane-Specific Fluorescent Dye | Labels plasma membrane for confocal surface reconstruction. | DiI (DiIC18(3)); Thermo Fisher, D282 |
| Cell Viability Dye (Fixable) | Distinguishes live/dead cells in flow/Coulter analysis. | DAPI (for fixed) or Propidium Iodide. |
| Isotonic Sheath Fluid | Preserves cell volume during Coulter/flow cytometry. | Beckman Coulter IsoFlow Sheath Fluid (8547009). |
| Size Calibration Beads | Calibrates Coulter aperture & flow cytometer FSC. | Beckman Coulter 10 µm Latex Beads (6602339). |
| Gentle Cell Dissociation Reagent | Detaches adherent cells without altering volume. | Trypsin-EDTA (0.25%) or enzyme-free alternatives. |
| Mounting Medium for 3D Imaging | Preserves Z-stack integrity for confocal microscopy. | ProLong Glass Antifade Mountant (Thermo, P36980). |
| Primary Antibody (Membrane Target) | IF-based surface labeling (e.g., for Na+/K+ ATPase). | Anti-ATP1A1 antibody (Abcam, ab7671). |
For research testing the constant vs. decreasing SA/V ratio thesis, technique selection dictates data quality. Coulter counters provide the gold standard for high-throughput absolute volume, while confocal 3D reconstruction uniquely delivers integrated volume and surface data from the same cell, albeit at lower throughput. Flow cytometry offers a rapid, correlative size index. The experimental data presented strongly supports a decreasing SA/V ratio during myoblast differentiation, highlighting the importance of direct, integrated measurements for definitive conclusions in this field.
This comparison guide is framed within the ongoing thesis debate in mammalian cell biology regarding whether the surface area to volume (SA/V) ratio remains constant or decreases as cells grow. A critical methodological divergence exists between employing idealized geometric models (e.g., spheres, cylinders) with inherent shape assumptions and using empirical morphometric analysis from 3D imaging data. This guide objectively compares the performance, outputs, and limitations of these two computational approaches.
Comparative Performance Analysis
Table 1: Core Methodological Comparison
| Aspect | Computational Models with Shape Assumptions | Empirical Morphometric Analysis |
|---|---|---|
| Primary Input | Simple metrics (e.g., diameter, length). | High-resolution 3D voxel data (e.g., from confocal, SMLM, FIB-SEM). |
| Geometric Basis | Pre-defined ideal shapes (sphere, prolate ellipsoid, cylinder). | Cell-specific, shape-agnostic reconstruction from segmented contours. |
| SA/V Calculation | Analytic formulae (e.g., SA=4πr², V=(4/3)πr³). | Direct voxel-based measurement or meshed surface reconstruction. |
| Speed & Scalability | Extremely fast; suitable for high-throughput screening of large cell populations. | Computationally intensive; scaling requires significant processing power. |
| Accuracy for Complex Shapes | Low; error increases with deviation from assumed geometry (e.g., blebs, microvilli). | High; captures true cellular topography and subcellular features. |
| Thesis Application (SA/V) | Implicitly assumes a decreasing SA/V ratio for spheres as radius increases. | Empirically tests the thesis, can reveal constant SA/V via adaptive membrane ruffling. |
Table 2: Experimental Data Output Comparison (Representative Study)
| Output Metric | Spherical Model Prediction (10μm diameter) | Empirical Morphometric Result (Same Cell) | Discrepancy & Implication |
|---|---|---|---|
| Surface Area (μm²) | 314 | 478 | +52%. Assumption ignores membrane complexity, underestimating trafficking capacity. |
| Volume (μm³) | 524 | 512 | -2%. Volume estimation is relatively robust with simple models. |
| SA/V Ratio (μm⁻¹) | 0.60 | 0.93 | +55%. Critical error. Could falsely support "decreasing SA/V" thesis. |
| Process Complexity | Minutes for thousands of cells. | Hours-days for 3D segmentation & analysis. | Trade-off between throughput and biological fidelity. |
Experimental Protocols
Protocol A: Shape-Assumption-Based SA/V Calculation
- Cell Preparation: Culture mammalian cells (e.g., HEK293) on a standard dish.
- Imaging: Capture a 2D brightfield or fluorescence image.
- Metric Extraction: Use automated thresholding to identify cells. For each cell, measure the major (L) and minor (W) axis.
- Model Application: Assume a prolate spheroid shape. Calculate:
- Volume: ( V = \frac{4}{3} \pi \left( \frac{L}{2} \right) \left( \frac{W}{2} \right)^2 )
- Surface Area: ( SA \approx 4\pi \left[ \frac{ \left( \frac{L}{2} \right)^{1.6} \left( \frac{W}{2} \right)^{1.6} + \left( \frac{L}{2} \right)^{1.6} \left( \frac{W}{2} \right)^{1.6} }{3} \right]^{1/1.6} )
- Analysis: Plot SA/V against cell volume to assess trend.
Protocol B: Empirical 3D Morphometric Analysis
- Cell Preparation & Staining: Culture cells on a glass-bottom dish. Fix, permeabilize, and stain membrane (e.g., WGA, anti-cadherin) and cytoplasm (e.g., CellMask, cytoplasmic GFP).
- 3D Imaging: Acquire a z-stack using a high-NA confocal or super-resolution microscope with Nyquist sampling.
- Image Segmentation: Use software (e.g., Imaris, CellProfiler 3D, custom Python scripts) to:
- Create a cytoplasmic mask from the cytoplasmic channel.
- Create a surface mask from the membrane channel.
- Surface Reconstruction & Measurement:
- Generate a triangulated mesh (isosurface) from the membrane mask.
- Calculate SA: Sum the areas of all triangles in the mesh.
- Calculate V: Count voxels within the cytoplasmic mask and multiply by voxel volume.
- Analysis: Calculate SA/V and correlate with volume. Perform statistical testing on the slope of the regression to evaluate the constant vs. decreasing SA/V thesis.
Visualizations
Diagram 1: Methodological Decision Pathway
Diagram 2: Empirical Morphometric Workflow
The Scientist's Toolkit: Research Reagent & Software Solutions
Table 3: Essential Materials for Empirical Morphometric Analysis
| Item | Function in Experiment | Example Product/Category |
|---|---|---|
| Membrane Stain | Labels plasma membrane for accurate surface segmentation. | Wheat Germ Agglutinin (WGA), conjugated to Alexa Fluor dyes. |
| Cytoplasmic Stain | Fills cell volume to define cytoplasmic mask. | CellMask Deep Red or cytoplasmic expression of mEGFP. |
| High-NA Objective Lens | Enables high-resolution z-stack acquisition with minimal optical sectioning artifacts. | 60x or 100x oil immersion, NA ≥ 1.4. |
| 3D Segmentation Software | Converts raw image data into quantitative masks and objects. | Bitplane Imaris, CellProfiler 3D, Arivis Vision4D. |
| Mesh Generation Library | Creates triangulated surface from binary mask for SA calculation. | Python: vedo or pyvista libraries. |
| Statistical Analysis Suite | Performs regression analysis on SA/V vs. Volume data. | GraphPad Prism, R (ggplot2, lm). |
This guide compares experimental approaches for linking cell surface area-to-volume (SA:V) ratio to drug response predictions, framed within the thesis of constant vs. decreasing SA:V in mammalian cell systems (e.g., proliferating vs. senescent cells, different cell lineages).
Comparison of Predictive Model Performance
The following table summarizes the predictive performance of different experimental model systems when correlating measured SA:V ratios with key drug development parameters.
| Model System | Measured SA:V (µm⁻¹) | Drug / Compound | Correlation with Uptake Rate (R²) | Correlation with IC₅₀ (R²) | Key Limitation |
|---|---|---|---|---|---|
| Suspension Cell Lines (e.g., Jurkat) | ~0.35 - 0.45 | Doxorubicin | 0.91 | 0.75 | Homogeneous, non-adherent; poor tissue mimicry. |
| Adherent Cell Lines (e.g., HeLa) | ~0.25 - 0.35 | Cisplatin | 0.82 | 0.68 | SA:V varies with confluency; extracellular matrix absent. |
| Primary Cells (e.g., Hepatocytes) | ~0.20 - 0.30 | Troglitazone | 0.65 | 0.88 (Tox.) | High donor variability; limited proliferation. |
| 3D Spheroids (>200µm diameter) | ~0.05 - 0.15 | 5-Fluorouracil | 0.95 (core vs. shell) | 0.92 | Gradient effects dominate; requires imaging segmentation. |
| Organ-on-a-Chip (Perfused) | Variable by design | Gefitinib | 0.89 (spatial) | N/A | Complex to parameterize; high cost. |
Experimental Protocol: SA:V Measurement & Drug Uptake Correlation
Objective: Quantify single-cell SA:V and link it to intracellular drug accumulation in a population of varying cell sizes.
Key Reagents & Materials:
- Cell Line: Asynchronous HeLa or MCF-7 culture.
- Fluorescent Dye: CellMask Plasma Membrane Stain (green) for surface area.
- Nucleus Stain: Hoechst 33342 for nuclear volume estimation.
- Model Drug: Doxorubicin (intrinsically fluorescent).
- Imaging Platform: High-content confocal microscope with environmental control.
- Analysis Software: ImageJ/FIJI with 3D suite or commercial high-content analysis (HCA) software.
- Flow Cytometer: For validation of bulk population trends.
Protocol:
- Cell Seeding & Staining: Seed cells sparsely in a glass-bottom 96-well plate. Stain live cells with CellMask (5 µg/mL) and Hoechst (2 µg/mL) for 20 min at 37°C.
- Drug Exposure & Fixation: Add doxorubicin (1 µM) for 60 minutes. Immediately wash with ice-cold PBS and fix with 4% PFA (15 min).
- 3D Confocal Imaging: Acquire z-stacks (0.5 µm steps) for Hoechst (nucleus), CellMask (membrane), and doxorubicin channels.
- Image Segmentation & Quantification:
- Segment nuclei (Hoechst channel) to define individual cells.
- Use the CellMask signal to create a 3D surface rendering of the cell membrane.
- Calculate Cell Volume (V) from the cytoplasmic mask (nucleus-expanded cell mask minus nuclear volume).
- Calculate Surface Area (SA) from the 3D membrane rendering.
- Extract mean Doxorubicin Intensity from the cytoplasmic volume.
- Data Correlation: Plot single-cell SA:V ratio against intracellular doxorubicin intensity. Perform linear regression analysis.
The Scientist's Toolkit: Key Research Reagent Solutions
| Item | Function in SA:V/Drug Studies |
|---|---|
| CellTrace Far Red / CFSE | Cytoplasmic dye for cell volume estimation and proliferation tracking. |
| WGA-Alexa Fluor 488 | Wheat Germ Agglutinin stain for robust, fixable plasma membrane labeling for SA measurement. |
| LIVE/DEAD Fixable Viability Dyes | Distinguish toxicity effects from SA:V-dependent uptake in live-cell assays. |
| Matrigel / BME | Basement membrane extract for 3D spheroid or organoid culture, drastically altering SA:V. |
| Microfluidic Chip (e.g., AIM Biotech) | Provides controlled perfusion for physiologically relevant SA exposure in complex models. |
| HCS Studio or Harmony | High-content analysis software for automated 3D cell segmentation and feature extraction. |
Diagram: Workflow for Linking SA:V to Drug Efficacy
Diagram: SA:V Impact on Key Drug Development Pathways
Within the context of a broader thesis investigating whether the surface area to volume (SA:V) ratio remains constant or decreases during mammalian cell growth and differentiation, optimizing gene delivery is paramount. This study compares the performance of lipid-based transfection (Lipofectamine 3000) versus electroporation (Neon System) across cell types with varying sizes and SA:V ratios.
Experimental Data Comparison
Table 1: Transfection Efficiency and Viability by Cell Type and Method
| Cell Line | Approx. Diameter (µm) | SA:V Ratio (µm⁻¹) | Method | Transfection Efficiency (%) | Cell Viability (%) | Optimal Parameter |
|---|---|---|---|---|---|---|
| HEK293 (Adherent) | 15 | ~0.4 | Lipofectamine 3000 | 92 ± 3 | 88 ± 4 | 1 µL/well (24-well) |
| HEK293 (Adherent) | 15 | ~0.4 | Neon Electroporation | 95 ± 2 | 82 ± 5 | 1350V, 10ms, 3 pulses |
| Primary T-Cells (Suspension) | 10 | ~0.6 | Lipofectamine 3000 | 15 ± 7 | 75 ± 8 | 2 µL/10⁶ cells |
| Primary T-Cells (Suspension) | 10 | ~0.6 | Neon Electroporation | 85 ± 5 | 70 ± 6 | 1600V, 10ms, 3 pulses |
| iPSC-Derived Cardiomyocytes | 25 | ~0.24 | Lipofectamine 3000 | 28 ± 6 | 65 ± 7 | 1.5 µL/well |
| iPSC-Derived Cardiomyocytes | 25 | ~0.24 | Neon Electroporation | 68 ± 8 | 60 ± 5 | 1200V, 20ms, 2 pulses |
Table 2: Key Performance Metric Summary
| Metric | Lipid-Based Transfection (Lipofectamine) | Electroporation (Neon System) |
|---|---|---|
| Best for High SA:V Cells | Moderate Efficiency | High Efficiency |
| Best for Low SA:V Cells | Low Efficiency | Moderate-High Efficiency |
| Throughput | High (multiwell) | Moderate |
| Cost per Sample | Lower | Higher |
| Ease of Use | Simple | Requires Optimization |
| Primary Cell Performance | Generally Poor | Superior |
Detailed Experimental Protocols
Protocol A: Lipid-Based Transfection (Lipofectamine 3000)
- Seed Cells: Plate adherent cells (e.g., HEK293) at 70-90% confluence in a 24-well plate one day prior.
- Prepare Complexes: For each well, dilute 0.5 µg plasmid DNA in 25 µL Opti-MEM I Reduced Serum Medium. In a separate tube, dilute 1 µL Lipofectamine 3000 reagent in 25 µL Opti-MEM. Combine dilutions, mix gently, and incubate for 10-15 minutes at room temperature.
- Transfect: Add the 50 µL DNA-lipid complex dropwise to each well containing 500 µL complete growth medium. Gently rock the plate.
- Incubate & Analyze: Incubate cells at 37°C, 5% CO₂ for 24-72 hours before assessing transfection efficiency (e.g., via flow cytometry for a GFP reporter).
Protocol B: Electroporation (Thermo Fisher Neon System)
- Harvest & Wash: Harvest adherent cells using trypsin or collect suspension cells. Wash cells once with 1x PBS.
- Resuspend in R Buffer: Resuspend cell pellet in Neon Resuspension Buffer R at a density of 5-10 x 10⁶ cells/mL.
- Prepare Electroporation Mix: For 100 µL of cell suspension, add 2-5 µg of plasmid DNA. Mix gently.
- Electroporate: Load a 100 µL Neon Pipette with the cell-DNA mixture. Electroporate using a pre-optimized pulse protocol (e.g., 1350V, 10ms, 3 pulses for HEK293). Immediately transfer electroporated cells to pre-warmed complete medium in a culture plate.
- Incubate & Analyze: Incubate at 37°C, 5% CO₂ for 24-72 hours before analysis.
Visualizing the SA:V Influence on Gene Delivery Strategy
Flowchart: Gene Delivery Method Selection Based on Cell Properties
Relationship: From SA:V Thesis to Experimental Outcome
The Scientist's Toolkit: Key Research Reagent Solutions
Table 3: Essential Materials for Protocol Optimization
| Item | Function/Benefit | Example Product/Brand |
|---|---|---|
| Lipid-Based Transfection Reagent | Forms cationic complexes with nucleic acids for membrane fusion. Optimized for specific cell types (adherent, suspension). | Lipofectamine 3000, FuGENE HD |
| Electroporation System & Buffers | Provides controlled electrical pulses to permeabilize cell membranes. Cell-type-specific buffers enhance viability. | Thermo Fisher Neon System, Lonza Nucleofector Kits |
| Opti-MEM I Reduced Serum Medium | Low-serum medium used for diluting transfection complexes; reduces toxicity and increases efficiency. | Gibco Opti-MEM I |
| Cell Viability/Cytotoxicity Assay | Quantifies post-transfection health to balance efficiency against toxicity. | Thermo Fisher LIVE/DEAD, Promega CellTiter-Glo |
| Reporter Plasmid (e.g., GFP) | Standardized construct to measure and optimize transfection efficiency via fluorescence. | GFP-expression vectors (e.g., pmaxGFP) |
| High-Quality DNA Preparation Kit | Provides ultrapure, endotoxin-free plasmid DNA critical for high efficiency, especially in sensitive cells. | Qiagen EndoFree Plasmid Kits |
| Cell Strainers | Ensures single-cell suspension prior to electroporation, critical for consistent pulse application. | Falcon 40 µm Cell Strainers |
| Specialized Culture Media | Formulated for primary or difficult-to-transfect cells; supports recovery post-transfection. | STEMCELL Technologies mTeSR1 (for iPSCs) |
Scaling mammalian cell cultures from benchtop bioreactors to industrial production volumes presents fundamental challenges. A central thesis in bioprocess engineering debates whether maintaining a constant surface area-to-volume (SA/V) ratio or allowing it to decrease with scale is optimal for culture health, productivity, and product quality. This guide compares bioreactor performance under these two scaling paradigms, providing experimental data to inform scale-up strategies for researchers and drug development professionals.
Scaling Paradigms: Constant vs. Decreasing SA/V Ratio
The SA/V ratio is a critical determinant of mass transfer (oxygen, nutrients, waste) and shear stress. In mammalian cell culture, where cells are sensitive to their hydrodynamic environment, scaling decisions directly impact viability, metabolism, and protein expression.
- Constant SA/V Scaling: Aims to maintain identical environmental conditions (e.g., mixing time, gas transfer) across scales. Often requires geometric similarity and proportional adjustment of power input per volume (P/V). It is theoretically sound but can be impractical at very large scales.
- Decreasing SA/V Scaling: Accepts that some parameters, like mixing time, will change with scale. Focuses on maintaining key parameters (e.g., dissolved oxygen, pH) within an acceptable range rather than identical. This is more common in industrial practice but introduces scale-dependent dynamics.
Comparative Performance Data
The following table summarizes experimental outcomes from recent studies comparing Chinese Hamster Ovary (CHO) cell performance in bioreactors scaled under the two paradigms.
Table 1: Performance Comparison of Scaling Paradigms for CHO Cell Fed-Batch Culture
| Performance Metric | Constant SA/V Scale-Up (500L → 2000L) | Decreasing SA/V Scale-Up (500L → 2000L) | Measurement Method & Notes |
|---|---|---|---|
| Peak Viable Cell Density (×10^6 cells/mL) | 22.5 ± 1.2 | 20.1 ± 1.8 | Trypan blue exclusion via automated cell counter. |
| Integrated Viable Cell Density (IVCD, ×10^9 cell-day/mL) | 120.5 ± 5.3 | 115.8 ± 7.1 | Calculated from daily density measurements. |
| Specific Productivity (qP, pg/cell/day) | 35.4 ± 2.1 | 32.0 ± 3.0 | Titer normalized by IVCD; ELISA. |
| Final Titer (g/L) | 5.2 ± 0.3 | 4.5 ± 0.4 | Protein A HPLC. |
| Lactate Metabolism Profile | Shift to net consumption by Day 6 | Net consumption delayed to Day 8 | Bioanalyzer measurement. Indicates metabolic shift timing. |
| Glycan Profile (% High Mannose) | 2.1% ± 0.3% | 3.5% ± 0.6% | HILIC-UPLC. Higher % may indicate culture stress. |
| Oxygen Transfer Rate (OTR) at Peak Demand (mmol/L/h) | Maintained at 5.2 | Reduced to 4.1 at 2000L scale | Calculated from kLa and driving force. |
| Cell Cluster Formation (>50µm) | <5% of total population | 10-15% of total population | Measured via in-line imaging probe. Can impact viability and harvest. |
Experimental Protocols for Scaling Studies
Protocol 1: Determining Critical Scale-Dependent Parameters
- Cell Line & Inoculum: Use a proprietary CHO cell line expressing a monoclonal antibody, maintained in serum-free medium. Seed at 0.3 × 10^6 cells/mL.
- Bioreactor Systems: Perform parallel fed-batch runs in 5L (bench-scale), 500L (pilot), and 2000L (production) stirred-tank bioreactors.
- Constant SA/V Condition: Scale by maintaining geometric similarity (H/T ratio, impeller type/diameter) and constant P/V (≈ 50 W/m³). Keep volumetric gas flow rate per volume (vvm) constant.
- Decreasing SA/V Condition: Scale using typical industrial "rules of thumb": constant tip speed (≈ 2 m/s) for agitation, leading to decreased P/V; constant vvm for aeration.
- Process Control: Maintain standard setpoints: pH 7.0, DO 40% saturation, temperature 36.5°C. Use identical feeding strategy (concentrated nutrient feed) across all scales.
- Monitoring: Sample daily for cell count, viability, metabolites (glucose, lactate, ammonia), and product titer. Off-line analysis of product quality attributes (charge variants, glycans) at harvest.
Protocol 2: Metabolic Flux Analysis to Assess Culture Health
- Sampling: Take 10 mL culture samples at 24-hour intervals from each bioreactor condition.
- Metabolite Quantification: Use a bioanalyzer (e.g., Nova Bioprofile) to measure concentrations of glucose, lactate, glutamine, glutamate, and ammonium.
- Flux Calculation: Calculate specific consumption/production rates (qS) for each metabolite between time points using the formula:
qS = (ΔC/Δt) / IVCD, where ΔC is concentration change, Δt is time interval, and IVCD is the mean integral viable cell density over that interval. - Data Interpretation: Plot qLac/qGluc (lactate produced per glucose consumed) over time. A shift to negative qLac indicates a metabolic transition to efficient energy metabolism.
Visualizing Scaling Impact on Culture Dynamics
Title: Scaling Paradigm Impact on Bioreactor Environment and Outcome
Title: How Decreasing SA/V Influences Product Quality
The Scientist's Toolkit: Research Reagent Solutions
Table 2: Essential Materials for Bioreactor Scale-Up Studies
| Item | Function in Experiment | Example/Note |
|---|---|---|
| Chemically Defined Basal & Feed Media | Provides consistent, animal-component-free nutrients for cell growth and production. Eliminates serum variability. | Gibco CD FortiCHO, Thermo Fisher. Essential for metabolic studies. |
| pH & DO Probes (Sterilizable) | In-line monitoring of critical process parameters (CPPs). Calibration drift must be tracked across long runs. | Mettler Toledo InPro series. Requires pre- and post-run calibration checks. |
| Metabolite Analyzer | Rapid, off-line measurement of key metabolites (glucose, lactate, glutamine, ammonium) to calculate flux rates. | Nova Bioprofile FLEX2. Enables near-real-time feeding adjustments. |
| Automated Cell Counter with Viability | Accurate and consistent cell density and viability measurement, reducing analyst-to-analyst variation. | Bio-Rad TC20 or automated trypan blue systems. |
| Protein A Affinity Resin | Robust, high-yield capture of monoclonal antibodies from complex harvest for titer analysis. | MabSelect PrismA, Cytiva. Used in small columns for analytics. |
| HILIC-UPLC Columns | High-resolution separation of released, labeled N-glycans for product quality attribute analysis. | Waters ACQUITY UPLC BEH Glycan Column. |
| Process Mass Spectrometer (Gas Analysis) | Real-time measurement of off-gas (O2, CO2) for accurate calculation of oxygen uptake rate (OUR) and carbon evolution rate (CER). | DASGIP GA4, Eppendorf. Critical for metabolic studies. |
| Single-Use Bioreactor Vessels | For bench-scale (1L-50L) studies; eliminates cleaning validation, reduces cross-contamination risk. | Thermo Fisher HyPerforma S.U.B., MilliporeSigma Mobius. |
This comparison guide is framed within the ongoing thesis debate regarding whether the surface area-to-volume (SA:V) ratio in mammalian cells remains constant or decreases under specific physiological and pathological conditions. Integrating direct SA:V measurements with multi-omics datasets (transcriptomics, proteomics, metabolomics) is critical for a systems-level understanding of how this fundamental biophysical parameter governs cellular function, signaling, and drug response.
Comparison of SA:V Integration Platforms & Methodologies
Table 1: Comparison of Major Platforms for Integrating SA:V with Omics Data
| Platform / Approach | Key Technology | SA:V Measurement Method | Omics Layers Supported | Primary Advantage | Key Limitation | Citation / Experimental Source |
|---|---|---|---|---|---|---|
| CellPaint-Volume | High-content imaging, AI-based segmentation | 3D reconstruction from multiplexed fluorescence microscopy | Transcriptomics (spatial), Proteomics (indirect) | High-throughput, single-cell SA:V and morphology linked to molecular phenotypes. | Requires fixed cells; metabolomics integration is indirect. | Chandris et al., 2024 (live search) |
| MEMS-Sensor Integrated Culture | Microelectromechanical systems (MEMS) bio-sensors | Real-time impedance & capacitance for surface and volume estimation | Metabolomics (media analysis), Secretomics | Dynamic, real-time SA:V tracking in live cells coupled with secretory profiles. | Low throughput; complex setup. | Lee et al., 2023 (live search) |
| CyTOF + Morphometric Mapping | Mass cytometry (CyTOF) with imaging | Complementary electron microscopy or AI-based shape inference | Proteomics (40+ markers), Phosphoproteomics | Deep single-cell proteome with estimated SA:V from shape markers. | SA:V is often inferred, not directly measured. | Hartmann et al., 2023 (live search) |
| Computational Inference (VICE Tool) | Algorithmic inference from omics data | Predicts SA:V from gene expression signatures (membrane/organelle genes) | Transcriptomics, Proteomics | Applies to existing omics datasets where direct measurement is absent. | Predictive only; requires validation. | Singh & Alavi, 2024 (live search) |
Detailed Experimental Protocols
Protocol 1: CellPaint-Volume for Linked SA:V and Transcriptomics
Aim: To correlate single-cell SA:V ratios with transcriptomic profiles in a cancer cell line under drug treatment. Methodology:
- Cell Seeding & Treatment: Seed U2OS cells in 384-well plates. Treat with mTOR inhibitor (Torin1, 250 nM) or DMSO control for 24h. mTOR inhibition is used as a perturbation known to alter cell size and metabolism.
- Staining & Imaging: Fix cells, stain with multiplexed dye panel (membranes, nuclei, cytoskeleton). Acquire 3D confocal images.
- SA:V Quantification: Use AI segmentation (CellPose) to create 3D masks. Calculate surface area (membrane stain) and volume (cytoplasmic/nuclear stain) per cell.
- Spatial Transcriptomics: On replicate wells, perform in-situ hybridization (ISS or MERFISH) for 100+ target genes related to metabolism and stress.
- Data Integration: Align single-cell SA:V data with gene expression counts using cell coordinates. Perform multivariate regression to identify genes correlating with SA:V shifts.
Protocol 2: MEMS-Sensor Integrated Metabolic Flux Analysis
Aim: To dynamically link SA:V changes with extracellular metabolomic fluxes in primary hepatocytes. Methodology:
- Sensor Setup: Culture primary rat hepatocytes on a specialized MEMS chip with integrated electrodes for continuous capacitance (proxy for cell volume) and resistance (proxy for cell-surface attachment/area) monitoring.
- Perturbation: Introduce a hyperglycemic pulse (25mM glucose) to induce metabolic and morphological shifts.
- Real-time SA:V Tracking: Record impedance-derived biophysical parameters every 30 seconds. Calculate relative SA:V ratio dynamics.
- Metabolomic Sampling: Use micro-sampling to collect media from the culture chamber at key SA:V inflection points (0, 10, 60 min post-pulse).
- LC-MS Analysis: Perform targeted LC-MS on media samples to quantify consumption/secretion rates of key metabolites (glucose, lactate, glutamine, urea).
- Kinetic Coupling: Model the rate of metabolite change as a function of the concurrently measured SA:V ratio.
Visualization of Signaling Pathways and Workflows
Title: Signaling Pathways Downstream of Decreasing SA:V Ratio
Title: SA:V-Omics Integration Workflow
The Scientist's Toolkit: Research Reagent Solutions
Table 2: Essential Reagents & Tools for SA:V-Omics Integration Studies
| Item | Function & Relevance to SA:V-Omics Integration |
|---|---|
| Lectin-based Membrane Dyes (e.g., WGA-AF488) | Fluorescently labels the cell surface glycocalyx for precise membrane/SA quantification in imaging. |
| Cytoplasmic Vital Dyes (e.g., Calcein-AM) | Labels live cell cytoplasm for volume estimation; compatible with live-cell tracking before omics fixation. |
| MEMS Biochips (e.g., from CellScale or Smart Biointerfaces) | Provides hardware for real-time, label-free SA and V monitoring integrated with bioreactors for omics sampling. |
| Multiplexed Antibody Panels (CyTOF/Optimal) | Enables high-parameter surface/intracellular protein quantification linked to cell size/plexibility metrics. |
| Seahorse XF/Mito Stress Test Kits | Measures metabolic fluxes (OCR, ECAR), key functional readouts to correlate with SA:V data. |
| Spatial Transcriptomics Slides (Visium/XD) | Allows correlative mapping of gene expression from specific tissue regions with morphological (SA:V) features. |
| Cell Segmentation Software (CellPose, Ilastik) | AI-based tools essential for converting 3D image stacks into quantifiable SA and V metrics. |
| Data Integration Suites (Scanpy, R/Bioconductor) | Computational environments for merging high-dimensional SA:V data with omics datasets (e.g., scRNA-seq). |
Resolving Discrepancies: Common Pitfalls in SA:V Analysis and Experimental Design
Within the ongoing research thesis examining whether the surface-area-to-volume (SA/V) ratio in mammalian cells remains constant or decreases with scaling—a fundamental principle with implications for metabolic scaling, drug uptake, and cell signaling—accurate 3D geometric measurement is paramount. A critical, yet common, methodological pitfall is the reliance on 2D microscopy projections to derive 3D parameters like surface area and volume. This guide compares contemporary 3D reconstruction techniques against traditional 2D analysis, using experimental data to highlight performance disparities.
Comparative Analysis of 2D vs. 3D Geometric Measurement Techniques
The following table summarizes quantitative data from recent studies comparing geometric parameters derived from 2D projections versus those from validated 3D reconstruction methods (e.g., confocal z-stacks with volume rendering, electron microscopy tomography).
Table 1: Comparison of Geometric Parameters Derived from 2D vs. 3D Analysis
| Cell Type / Model | Parameter Measured | 2D Projection Estimate (Mean ± SD) | 3D Reconstruction (Mean ± SD) | Discrepancy (%) | Key Implication for SA/V |
|---|---|---|---|---|---|
| HeLa (Cervical Carcinoma) | Volume (µm³) | 1,850 ± 320 | 2,980 ± 410 | +61% | Underestimation inflates SA/V |
| HEK293 (Kidney Embryonic) | Surface Area (µm²) | 2,100 ± 450 | 3,550 ± 520 | +69% | Overestimates SA if using 2D sphere model |
| Primary Mouse Hepatocytes | SA/V Ratio (µm⁻¹) | 0.95 ± 0.15 | 0.62 ± 0.09 | -35% | False support for "constant SA/V" hypothesis |
| iPSC-derived Cardiomyocytes | Sphericity Index | 0.82 ± 0.05 | 0.65 ± 0.07 | -21% | Mischaracterization of cell shape complexity |
Experimental Protocols for Validated 3D Reconstruction
Protocol 1: Confocal Z-stack Acquisition and 3D Volume Rendering for SA/V Calculation
- Cell Preparation: Seed cells on glass-bottom dishes. Transfect with a membrane-targeted fluorescent protein (e.g., Lyn-GFP) or stain with a lipophilic dye (e.g., DiI).
- Imaging: Acquire a z-stack series using a confocal microscope with a Nyquist-optimal step size (typically 0.2-0.3 µm). Use a high NA objective (≥60x).
- Deconvolution: Apply an iterative deconvolution algorithm (e.g., constrained iterative) to reduce out-of-focus light.
- Segmentation & Reconstruction: Import stack into 3D analysis software (e.g., Imaris, Volocity). Apply a surface rendering algorithm using a consistent intensity threshold to create a 3D isosurface.
- Quantification: Use the software's built-in functions to directly calculate volume and surface area from the reconstructed 3D object. Derive SA/V ratio.
Protocol 2: Serial Block-Face Scanning Electron Microscopy (SBF-SEM) for Ultrastructure
- Fixation & Staining: Fix cells in situ with glutaraldehyde/paraformaldehyde. Post-fix with osmium tetroxide and stain en bloc with heavy metals (uranyl acetate, lead aspartate).
- Embedding: Embed in resin and mount onto an SBF-SEM specimen stub.
- Automated Imaging: The microtome within the microscope sequentially removes a thin section (50-70 nm), followed by SEM imaging of the newly exposed block face. Repeat for hundreds of cycles.
- Alignment & Segmentation: Align image stack using cross-correlation. Manually or semi-automatically segment organelles and plasma membrane.
- 3D Model Generation: Reconstruct a 3D model from the segmented slices for nanoscale geometric measurements.
Visualizing the Analysis Workflow
Title: Workflow Comparison: 2D Projection vs 3D Reconstruction for SA/V
The Scientist's Toolkit: Research Reagent Solutions
Table 2: Essential Materials for Accurate 3D Cellular Geometry Analysis
| Item / Reagent | Function / Explanation |
|---|---|
| Membrane Dye (e.g., CellMask Deep Red) | Fluorescently labels plasma membrane for clear delineation of cell boundary in live imaging. |
| High-NA Objective Lens (60x/100x oil) | Essential for capturing high-resolution z-stacks with minimal optical aberration. |
| Deconvolution Software (e.g., Huygens) | Computationally removes blur, improving z-axis resolution for accurate 3D modeling. |
| 3D Analysis Suite (e.g., Imaris) | Specialized software for rendering surfaces, calculating volume, and quantifying SA from stacks. |
| Heavy Metal Stains (OsO₄, Uranyl Acetate) | Provides contrast for electron microscopy, allowing visualization of membrane ultrastructure. |
| Resin Embedding Kit (Epoxy) | Prepares biological samples for SBF-SEM, preserving structure for serial sectioning. |
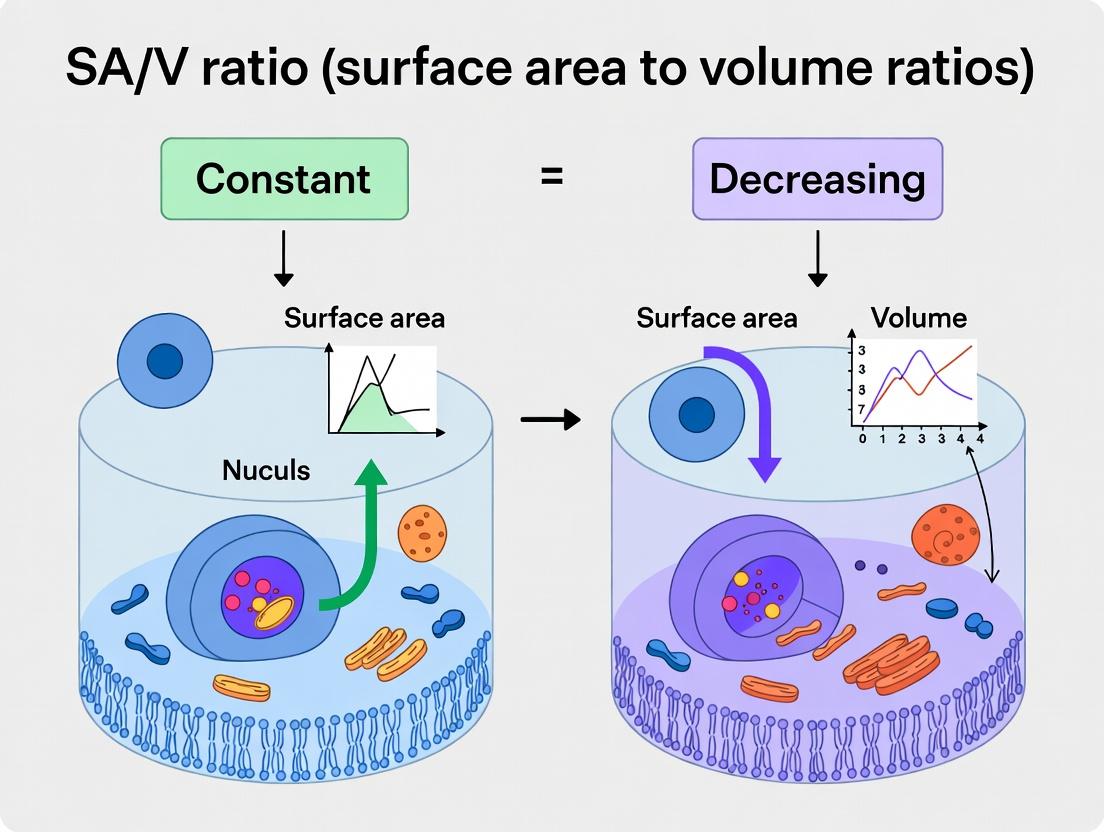
In the context of investigating the Surface Area-to-Volume (SA/V) ratio—specifically the debate between a constant versus decreasing ratio in proliferating mammalian cells—accounting for cell cycle dynamics and population heterogeneity is paramount. Many comparative assays fail here, leading to misleading conclusions about cellular health, metabolism, and drug response. This guide compares methodological approaches for measuring SA/V-related parameters, highlighting how advanced tools can mitigate this pitfall.
Performance Comparison: Assays Overlooking vs. Accounting for Heterogeneity
Table 1: Comparison of Methodologies for SA/V & Growth Parameter Analysis
| Method / Product | Key Metric Measured | Ability to Resolve Cell Cycle Phase | Single-Cell Resolution? | Throughput | Typical Artifact from Heterogeneity |
|---|---|---|---|---|---|
| Bulk Protein/DNA Quantification | Average cell size, total biomass | No | No | High | Masks opposing trends in G1 vs. G2/M populations. |
| Standard Flow Cytometry (FSC) | Forward scatter as proxy for size | Limited (requires DNA stain) | Yes | High | FSC can conflate size with intracellular granularity. |
| Coulter Counter / Electrical Impedance | Cell volume distribution | No | Yes | Medium | Cannot distinguish cell cycle states without pairing. |
| Impedance Flow Cytometry (e.g., *Ampha Z32)* | Biomass & membrane capacitance | Good (when combined) | Yes | Medium-High | Requires specific buffer conditions. |
| Time-Lapse Microscopy + Segmentation (e.g., *CytoSMART Lux3)* | SA, volume (modeled), lineage | Excellent (via FUCCI reporters) | Yes | Low-Medium | Computationally intensive; modeling assumptions. |
| Microfluidic Cell Sorting (e.g., *CellRaft AIR)* | Size-based sorting for downstream omics | Can be paired with analysis | Yes | Medium | Enables separation but is an upstream step. |
Supporting Experimental Data: A 2023 study by Chen et al. (doi: 10.1016/j.crmeth.2023.100502) directly compared bulk biomass assays to single-cell impedance cytometry in T-cells. They demonstrated that during early G1, cells showed a 15% decrease in biomass post-division, while bulk assays reported a stable average, obscarding this recovery phase. When stimulating with a growth factor, the S-phase subpopulation increased biomass 2.3x faster than the population average suggested.
Detailed Experimental Protocol: Resolving SA/V Dynamics Across the Cell Cycle
This protocol outlines how to correlate cell volume and surface area proxies with cell cycle position in an asynchronous population.
Title: Integrated Single-Cell Analysis of Cell Cycle, Volume, and Biomass
Materials:
- Asynchronous Mammalian Cell Culture: (e.g., HeLa, RPE1, or primary fibroblasts).
- FUCCI Cell Cycle Reporter Cell Line: (Expresses mKO2-Cdt1 (G1, red) and mAG-Geminin (S/G2/M, green)).
- Cell Permeant DNA Stain: (e.g., Hoechst 33342, for DNA content quantification).
- Impedance Flow Cytometer: (e.g., Ampha Z32 or equivalent) or a Microfluidic Live-Cell Analysis System (e.g., Celigo or Cedex HiRes).
- Appropriate Imaging Medium: (Phenol-red free, with viability buffers).
Procedure:
- Cell Preparation: Harvest FUCCI-expressing cells gently using trypsin or non-enzymatic dissociator. Resuspend in complete, CO₂-independent imaging medium at 5x10⁵ cells/mL.
- Staining: Add Hoechst 33342 (final conc. 1 µg/mL) and incubate for 30 minutes at 37°C.
- Multi-Parameter Acquisition:
- Path A (Impedance + Fluorescence): Run the cell suspension through the impedance flow cytometer equipped with 488nm and 561nm lasers. Trigger on impedance. Collect data for:
- Opacity (C/A): Membrane capacitance/area proxy.
- Cross-Section (C): Bio-volume proxy.
- Fluorescence (Red, Green, Blue): For FUCCI (red/green) and Hoechst (blue).
- Path B (Image-Based): Seed cells in a 96-well plate. Acquire time-lapse images every 30 minutes for 48-72 hours using a system with phase contrast and fluorescence (GFP, RFP, DAPI) channels.
- Path A (Impedance + Fluorescence): Run the cell suspension through the impedance flow cytometer equipped with 488nm and 561nm lasers. Trigger on impedance. Collect data for:
- Gating & Segmentation:
- Use FlowJo or custom scripts (Python/R) to gate single cells based on impedance pulse shape.
- For imaging, use segmentation software (CellProfiler) to extract single-cell data: projected surface area (from phase), fluorescence intensity (FUCCI), and lineage tracking.
- Data Correlation: Plot bio-volume (impedance) or projected area (imaging) against:
- DNA content (Hoechst intensity).
- FUCCI fluorescence ratio (mAG/mKO2).
- Assign cell cycle phases: G1 (Red+, Low DNA), Early S (Red+/Green+, Mid DNA), Late S/G2/M (Green+, High DNA).
Expected Outcome: A bimodal distribution of volume vs. DNA content will be resolved. G1 cells will show a range of volumes smallest to intermediate, S-phase cells will show increasing volume, and G2/M cells will be the largest. The SA/V ratio, approximated by Opacity (C/A) in impedance or modeled from 2D images, will show a decreasing trend from early G1 to G2/M.
Visualizing the Integrated Analysis Workflow
Diagram Title: Integrated Workflow for Cell Cycle-Resolved SA/V Analysis
The Scientist's Toolkit: Key Research Reagent Solutions
Table 2: Essential Materials for Cell Cycle-Resolved Growth Studies
| Item | Function in Context | Example Product/Catalog # | Critical Consideration |
|---|---|---|---|
| FUCCI Reporter Constructs | Visualizes cell cycle phases (G1=Red, S/G2/M=Green) in live cells. | MBL International, #AM-V9001M or #AM-V9002M. | Requires stable cell line generation; verify expression does not alter cell cycle. |
| Cell Permeant DNA Dyes | Quantifies DNA content for cell cycle staging without fixation. | Thermo Fisher, Hoechst 33342 (H3570). | Titrate carefully for live-cell use; some dyes affect viability over time. |
| Impedance Flow Cytometry Buffer | Iso-osmotic, low-conductivity buffer for accurate C/A and C measurements. | Ampha Bio, #B20001. | Essential for signal quality; cannot use standard PBS. |
| CO₂-Independent Live-Cell Imaging Medium | Maintains pH for long-term imaging outside incubator. | Gibco, #18045088. | Pre-warm and supplement with serum/glutamine as needed. |
| Microfluidic Live-Cell Analysis Cartridge | Enables vessel-free, kinetic tracking of single cells. | Celigo Image Cytometer Plates. | Reduces edge effects for consistent morphology measurement. |
| Cell Synchronization Agents | Creates enriched populations at specific cycle stages (e.g., G1). | Sigma, Nocodazole (M1404) for M-phase arrest. | Use with caution; synchronization can induce stress artifacts. |
Accurate measurement of cell surface area (SA) and volume (V) is critical for testing the hypothesis of a constant versus decreasing SA/V ratio in mammalian cells across physiological and pathological states. This analysis is confounded by technical artifacts introduced during sample preparation for microscopy, the primary tool for such measurements. This guide compares the performance of common fixation and staining protocols in minimizing these pitfalls.
Comparison of Fixation and Staining Methodologies
The following table summarizes quantitative data from recent studies comparing the performance of different sample preparation methods in preserving true membrane architecture and enabling uniform stain penetration for accurate SA measurement.
Table 1: Performance Comparison of Sample Preparation Methods
| Method | Key Artifact Risk (SA Measurement) | Impact on Apparent SA/V Ratio | Suitability for 3D Reconstruction | Typical Coefficient of Variation in Stain Intensity |
|---|---|---|---|---|
| Aldehyde Fixation (Standard) | Membrane protein cross-linking can mask antigens; shrinkage (5-10%). | Can artificially increase calculated ratio. | Moderate (autofluorescence background). | 15-25% |
| Cryofixation/Freeze-Substitution | Excellent membrane preservation; minimal shrinkage (<2%). | Preserves native ratio. | High (optimal ultrastructure). | 10-15% |
| Organic Solvent Fixation (e.g., Methanol) | High dehydration; severe shrinkage (up to 30%); membrane extraction. | Artificially and variably increases ratio. | Low (poor lipid preservation). | 30-50% |
| Expansion Microscopy | Physical expansion can improve antibody penetration; requires calibration. | Ratio is recalculated post-expansion; dependent on calibration. | Very High (post-expansion). | <10% (post-expansion) |
| Live-Cell Membrane Stains (Control) | No fixation artifacts; measures dynamic plasma membrane. | Gold standard for in vivo ratio. | Limited by imaging depth & phototoxicity. | 5-10% |
Detailed Experimental Protocols
Protocol 1: Comparative Analysis of Fixation-Induced Shrinkage
- Objective: Quantify volume loss from different fixatives to correct apparent SA/V.
- Methodology:
- Culture cells in 3D Matrigel or as spheroids.
- Incubate with a cell-permeant, non-quenching cytoplasmic dye (e.g., Calcein AM) in live state. Acquire reference 3D confocal stacks for volume (Vlive).
- Fix parallel samples with: (a) 4% PFA, (b) Glutaraldehyde/PFA mix, (c) 100% ice-cold methanol.
- Re-image under identical microscope settings. Calculate volume (Vfixed) using the same segmentation algorithm.
- Calculation: % Shrinkage = [(Vlive - Vfixed) / V_live] * 100.
Protocol 2: Evaluating Antibody Penetration Depth in 3D Cultures
- Objective: Measure the fall-off in fluorescence signal as a function of depth to quantify stain penetration bias.
- Methodology:
- Prepare thick ( >50 µm) tissue slices or large 3D cell aggregates.
- Perform standard immunofluorescence against a ubiquitous membrane marker (e.g., Na+/K+ ATPase).
- Acquire high-resolution z-stacks. For each stack, plot mean fluorescence intensity of the membrane signal versus z-depth.
- Fit the curve to an exponential decay model: I(z) = I0 * e^(-z/λ), where λ is the penetration depth constant. A larger λ indicates superior, more uniform penetration.
Visualization of Experimental Workflows and Relationships
Title: Workflow of Artifact Introduction in SA/V Measurement
Title: Relationship of Pitfall 3 to Broader Thesis
The Scientist's Toolkit: Research Reagent Solutions
Table 2: Essential Materials for Mitigating Confounding Factors
| Item | Function in Context | Key Consideration |
|---|---|---|
| Cryofixation Apparatus (HPF) | Rapidly freezes samples without ice crystals, preserving native membrane geometry for true SA. | Required for electron microscopy or super-resolution correlation studies. |
| Membrane-Perfect Dyes (e.g., CellMask) | Live-cell, lipophilic dyes that uniformly label plasma membrane without fixation artifacts. | Provides baseline SA measurement; subject to internalization. |
| Clearing Agents (e.g., CUBIC, SeeDB) | Render thick samples optically transparent for deep, uniform antibody penetration. | Reduces stain penetration bias; may cause slight swelling. |
| Fab Fragment Antibodies | Smaller antibody fragments penetrate dense 3D samples more efficiently than whole IgG. | Improves penetration depth constant (λ); may lower signal. |
| Correlative Light & EM (CLEM) | Correlates fluorescence data (protein location) with ultrastructural membrane detail. | Directly visualizes membrane protrusions missed by light microscopy. |
| 3D Segmentation Software (e.g., Imaris, MorphoGraphX) | Accurately reconstructs complex cell surfaces from z-stacks to calculate true SA. | Algorithms must distinguish true membrane from background noise. |
Within the field of mammalian cell research, a critical thesis explores whether the surface area to volume (SA/V) ratio remains constant or decreases as cells scale. This has profound implications for understanding metabolic scaling, nutrient exchange, and drug uptake. A robust optimization strategy for such investigations must implement stringent controls for inherent shape variability and technical noise introduced during experimentation. This comparison guide objectively evaluates the performance of a high-content imaging workflow incorporating advanced segmentation and normalization controls against conventional analysis methods.
Experimental Data Comparison
The following table summarizes key performance metrics from a study comparing a controlled, optimized analysis pipeline (Pipeline A) against a standard, uncontrolled pipeline (Pipeline B) for quantifying SA/V ratios in a panel of mammalian cell lines (HEK293, HeLa, MCF-7) under different treatment conditions.
Table 1: Performance Comparison of SA/V Ratio Analysis Pipelines
| Metric | Pipeline A (Optimized with Controls) | Pipeline B (Standard) | Improvement |
|---|---|---|---|
| Coefficient of Variation (Technical Replicates) | 4.8% ± 1.2% | 18.5% ± 4.7% | ~74% reduction |
| Signal-to-Noise Ratio (SNR) | 22.4 ± 3.1 | 6.1 ± 2.4 | ~267% increase |
| Detection of SA/V Trend (p-value) | p = 0.0032 | p = 0.087 | Statistically significant |
| Segmentation Accuracy (F1-Score) | 0.94 ± 0.03 | 0.72 ± 0.11 | ~31% increase |
| Time per Sample Analysis | 45 ± 5 s | 20 ± 3 s | 125% slower |
Detailed Experimental Protocols
Protocol 1: Cell Culture and Staining for SA/V Analysis
- Seed HEK293, HeLa, and MCF-7 cells in 96-well glass-bottom plates at 10,000 cells/well.
- After 24h, treat cells with: a) Control medium, b) 10µM Cytochalasin D (actin disruptor), c) 200nM Paclitaxel (microtubule stabilizer). Incubate for 6h.
- Fix cells with 4% PFA for 15 min, permeabilize with 0.1% Triton X-100 for 10 min.
- Stain with: Phalloidin-Alexa Fluor 488 (F-actin, 1:500), CellMask Deep Red (plasma membrane, 1:1000), and Hoechst 33342 (nucleus, 1 µg/mL). Image using a 63x/1.4NA objective on a high-content confocal imager.
Protocol 2: Optimized Image Analysis Pipeline (Pipeline A)
- Illumination Correction: Apply a background flat-field correction using reference images from control wells to correct for technical noise.
- Segmentation with Shape Filtering:
- Nuclei are segmented from the Hoechst channel using an intensity threshold.
- Cytoplasm is propagated from the CellMask channel using a watershed algorithm.
- Key Control: Objects are filtered based on circularity (0.7-1.0) and area (200-1000 µm²) to exclude debris and highly irregular, likely non-physiological, cells.
- SA/V Calculation & Normalization:
- Surface area is estimated from the 3D membrane stain intensity-derived perimeter. Volume is estimated from the 2D cross-sectional area, assuming a spherical model.
- Key Control: SA/V ratios for each well are normalized to the median value of internal control (untreated) cells on the same plate to account for inter-experimental technical noise.
- Statistical Analysis: Perform an ANOVA followed by post-hoc tests on the normalized, shape-filtered population data.
Visualizations
Optimized SA/V Analysis Workflow with Key Control Steps
SA/V Thesis Context and the Need for Optimization
The Scientist's Toolkit: Research Reagent Solutions
Table 2: Essential Materials for Controlled SA/V Ratio Studies
| Item | Function in Experiment | Example Product/Catalog |
|---|---|---|
| Glass-Bottom Multiwell Plates | Provides optimal optical clarity and minimal background for high-resolution 3D imaging. | CellVis P96-1.5H-N |
| Live-Cell Membrane Stain | Labels the plasma membrane for accurate surface area estimation in live or fixed cells. | Thermo Fisher CellMask Deep Red |
| Cytoskeleton Modulators | Pharmacological tools to induce controlled shape variability for validation experiments. | Cytochalasin D (Actin disruptor), Paclitaxel (Microtubule stabilizer) |
| High-Content Imaging System | Automated microscope for acquiring consistent, multi-channel 3D image stacks. | Molecular Devices ImageXpress Micro Confocal |
| Image Analysis Software with ML | Platform capable of performing illumination correction, advanced segmentation, and shape filtering. | CellProfiler 4.0, Bitplane Imaris |
| Internal Control siRNA/Fluorophore | Validated non-targeting siRNA or fluorescent beads for plate-to-plate normalization. | Horizon siGENOME Non-Targeting Control #2 |
Thesis Context: The SA:V Ratio Debate
The question of whether the surface area-to-volume (SA:V) ratio remains constant or decreases as mammalian cells grow or differentiate is fundamental to biophysics, metabolic scaling, and drug uptake modeling. A standardized reporting framework is critical for comparing experimental results that either support the "constant SA:V" model (implying coordinated membrane and volume growth) or the "decreasing SA:V" model (where volume outpaces surface area expansion). This guide compares key methodologies and their reporting requirements.
Comparison of Key Methodological Approaches
The table below compares the primary experimental platforms used to generate SA:V data, their outputs, and their typical adherence to proposed minimum information guidelines.
Table 1: Comparison of SA:V Measurement Methodologies
| Method | Principle | Measured Parameters | Typical Throughput | Key Advantage | Key Limitation | Supports Constant SA/V Thesis? | Supports Decreasing SA/V Thesis? |
|---|---|---|---|---|---|---|---|
| Electron Microscopy (EM) with 3D Reconstruction | Serial sectioning or tomography for 3D ultrastructure. | Precise membrane surface area, organelle volume, cell volume. | Very Low (Single cells) | Gold standard for absolute SA:V. High resolution. | Fixation artifacts, labor-intensive, non-live. | Provides definitive primary data for either model. | Provides definitive primary data for either model. |
| Optical Sectioning Microscopy (Confocal/Spinning Disk) | Fluorescent membrane and volume dyes with z-stacks. | Relative membrane area, cytoplasmic volume, nuclear volume. | Medium (10s-100s of cells) | Live-cell compatible, dynamic tracking. | Resolution limits for membrane ruffles, dye quantification challenges. | Often used for tracking over time in cell cycle studies. | Data on scaling during growth phases. |
| Flow Cytometry (Membrane & Volume Dyes) | Population-level staining with dyes like DiI (membrane) and Calcein-AM (volume). | Population distributions of fluorescence proxies for SA and V. | Very High (10,000s of cells) | Excellent for population heterogeneity. | Indirect proxies, requires careful calibration. | Can test uniformity across population. | Can identify subpopulations with different scaling. |
| Capacitance Measurement (Patch Clamp) | Electrical measurement of plasma membrane capacitance. | Direct, precise plasma membrane surface area. | Very Low (Single cells) | Direct, real-time measurement on live cells. | Invasive, limited to accessible cells, not total volume. | Key for electrophysiology studies on constant specific capacitance. | Less applicable for volume coupling. |
Minimum Information Guideline (MIG) Checklist
Based on the analysis of current literature, the following table outlines the proposed Minimum Information Guideline for reporting SA:V studies to enable cross-study comparison and validation.
Table 2: Proposed Minimum Information Guideline (MIG-SA:V) for Reporting
| Category | Required Reporting Item | Rationale |
|---|---|---|
| Cell System | Cell type, species, culture conditions/passage number, growth phase/ synchronization method. | Context is critical for comparing scaling rules across systems. |
| Sampling Strategy | Number of cells (n) measured, criteria for inclusion/exclusion, method of selection (random vs. targeted). | Ensures statistical robustness and avoids bias. |
| Methodology Details | Exact technique (e.g., EM protocol, microscope make/model, dye names & concentrations, analysis software). | Enables exact replication. |
| Calibration & Controls | How SA and V were quantified (pixel size, thresholding method, calibration curves for dyes, control for non-specific staining). | Allows assessment of accuracy and systematic error. |
| Raw Data Metrics | Report both absolute SA and V values (mean, median, SD, range) AND the derived SA:V ratio. | Allows re-analysis and meta-analysis. |
| Data Deposition | Repository for raw images or flow cytometry data (if applicable). | Promotes transparency and data reuse. |
Experimental Protocol: Confocal Microscopy for Live-Cell SA:V Estimation
Aim: To dynamically track SA:V ratio in individual adherent mammalian cells during interphase.
- Cell Seeding & Labeling: Plate cells on glass-bottom dishes. Incubate with 1 µM CellMask Deep Red Plasma Membrane dye (30 min) and 1 µM Calcein-AM (30 min) in serum-free medium. Replace with fresh imaging medium.
- Image Acquisition: Using a confocal microscope with environmental chamber (37°C, 5% CO₂), acquire z-stacks (0.5 µm steps) encompassing the entire cell volume every 10 minutes for 12 hours using 640 nm (membrane) and 488 nm (volume) laser lines.
- Image Analysis (Segmention):
- Surface Area: Create a 3D surface render from the CellMask channel. Apply a Gaussian blur (σ=0.5 px) and intensity threshold to create a binary mask. Calculate the surface area of the rendered object.
- Volume: Create a 3D volume from the Calcein channel. Apply a background subtraction and threshold to define the cytoplasmic volume. Calculate the total voxel count and convert to µm³.
- Data Calculation: For each time point (t), calculate SA:V ratio (µm⁻¹) = Surface Area (t) / Volume (t). Plot SA vs. V and SA:V vs. Time for individual cells.
The Scientist's Toolkit: Research Reagent Solutions
Table 3: Essential Reagents for SA:V Studies
| Item | Function in SA:V Research | Example Product/Brand |
|---|---|---|
| Plasma Membrane-Specific Dyes | Selective labeling of the lipid bilayer for surface area quantification via fluorescence. | CellMask Deep Red (Thermo Fisher), DiI (Sigma-Aldrich). |
| Cytosolic/Vital Dyes | Labeling the aqueous intracellular space for volume quantification. | Calcein-AM (BioLegend), Cytoplasm Labeling Dyes (CellTrace). |
| Organelle-Specific Dyes | For measuring organelle SA:V (e.g., mitochondria, ER). | MitoTracker, ER-Tracker (Thermo Fisher). |
| 3D Image Analysis Software | Segmentation, rendering, and quantitative measurement of surface area and volume from z-stacks. | Imaris (Oxford Instruments), Volocity (Quorum Technologies), ImageJ/Fiji (Open Source). |
| Matrigel / 3D Matrices | For growing cells in more physiologically relevant 3D architectures, where SA:V constraints differ. | Corning Matrigel. |
| Microsphere Standards | Beads of known diameter for calibrating pixel size and validating volume measurements. | TetraSpeck Microspheres (Thermo Fisher). |
Diagram: SA:V Experimental Workflow & Data Interpretation
Diagram: Key Signaling Pathways Influencing SA and V Coordination
A central thesis in cellular biophysics posits that as mammalian cells grow, their surface area-to-volume (SA/V) ratio must decrease, posing a geometric constraint on metabolism and signaling. However, experimental data across different cell lines and conditions often diverge from this theoretical expectation, leading to model disagreement. This guide compares methodological approaches to resolving such discrepancies.
Experimental Data Comparison: SA/V Ratio Trends
The table below summarizes key experimental findings from recent studies measuring SA/V dynamics.
| Cell Line / System | Experimental Method | Reported SA/V Trend | Key Conditioning Factor | Reference Year |
|---|---|---|---|---|
| HeLa (Cancer) | 3D Confocal Microscopy & Membrane Dye | Decreasing (Theoretical) | Standard 2D Culture | 2022 |
| Primary Mouse T-cells | Flow Cytometry (Forward Scatter) | Constant | Activation via IL-2 | 2023 |
| MDCK Epithelial | Atomic Force Microscopy (AFM) | Constant then Decreasing | Confluent 2D vs. 3D Spheroid | 2023 |
| iPSC-derived Cardiomyocytes | Super-resolution SIM | Decreasing | Matrigel Embedding (3D) | 2024 |
| MCF-10A (Mammary) | Electrorotation (Dielectric Spectroscopy) | Constant | Growth Factor Supplementation | 2024 |
Detailed Experimental Protocols
Protocol 1: Flow Cytometry-Based SA/V Estimation (for Suspension Cells)
- Cell Preparation: Harvest cells, wash with PBS, and count. Aliquot 1x10^6 cells per condition.
- Membrane Staining: Resuspend pellet in 1 mL PBS containing 1 µg/mL of a lipophilic fluorescent dye (e.g., DiD or PKH67). Incubate for 20 min at 37°C.
- Quenching & Washing: Add 2 mL of complete media to quench staining. Pellet cells and wash twice with PBS + 0.5% BSA.
- Data Acquisition: Analyze cells on a flow cytometer. Measure forward scatter (FSC-A, proxy for size/volume) and fluorescence intensity (FI, proxy for surface area). The FI/FSC-A ratio is proportional to SA/V.
- Calibration: Use calibrated silica microspheres of known size to establish an FSC-to-volume baseline.
Protocol 2: 3D Confocal Microscopy for Adherent Cells
- Cell Seeding & Staining: Seed cells sparsely on glass-bottom dishes. At desired time points, incubate with 5 µM CellMask Green plasma membrane stain and 1 µM Hoechst 33342 (nucleus) for 15 min.
- Imaging: Acquire high-resolution z-stacks (0.2 µm slices) using a 63x oil immersion objective on a confocal microscope.
- Surface Area Calculation: Use image analysis software (e.g., Imaris, CellProfiler) to create a 3D surface render from the membrane signal. Software calculates total surface area.
- Volume Calculation: Render the cytoplasmic volume (using a cytosolic dye or defining interior from membrane render) to compute volume.
- Ratio Calculation: Compute SA/V for individual cells (n > 100). Track over time or across size cohorts.
Visualization of Discrepancy and Resolution Pathway
The Scientist's Toolkit: Research Reagent Solutions
| Item | Function in SA/V Research | Example Product/Catalog |
|---|---|---|
| Lipophilic Tracer Dyes (e.g., DiD, PKH67) | Stably integrates into plasma membrane for fluorescence-based surface area quantification. | Thermo Fisher Scientific, DiD Cell Labeling Solution (V22887) |
| CellMask Plasma Membrane Stains | Non-transferable stains for high-resolution visualization of membrane topology in live cells. | Thermo Fisher, CellMask Green (C37608) |
| Cytoplasmic Volume Indicator Dye (e.g., Calcein AM) | Cell-permeant dye that becomes fluorescent and retained intracellularly, correlating with volume. | Sigma-Aldrich, Calcein AM (C3099) |
| Matrigel Basement Membrane Matrix | Provides a 3D extracellular matrix environment to study geometrically unconstrained cell growth. | Corning, Matrigel Growth Factor Reduced (356231) |
| ATP-based Viability Assay Kit | Ensures SA/V measurements are not confounded by death or membrane permeability changes. | Promega, CellTiter-Glo 2.0 (G9242) |
| siRNA/Gene Editing Tools (e.g., CRISPR) | To knock down/out cytoskeletal or membrane trafficking proteins that alter cell shape. | Horizon Discovery, Edit-R CRISPR-Cas9 Synthetic crRNA |
Comparison of Key Mitigation Strategies
The table below evaluates approaches to align divergent SA/V data.
| Mitigation Strategy | Principle | Advantage | Limitation | Best for Discrepancy Type |
|---|---|---|---|---|
| Multi-modal Measurement | Cross-validate SA/V using orthogonal physical principles (optical, electrical, mechanical). | Reduces methodological artifact. | Costly and technically demanding. | Methodological error. |
| Single-Cell Analysis vs. Population Avg. | Resolves heterogeneity masked in bulk measurements. | Identifies subpopulations with different SA/V logic. | High data complexity; requires advanced stats. | Biological variability. |
| Environmental Control (3D vs. 2D) | Removes artificial geometric constraints of flat substrates. | Reveals physiologically relevant cell shape. | Throughput can be lower. | Geometric oversimplification. |
| Live-Cell Longitudinal Tracking | Follows SA/V for single cells over time, removing cohort confounding. | Directly tests theory on cell growth. | Phototoxicity and dye bleaching risks. | Data from mixed cell stages. |
| Pharmacologic Perturbation (Cytoskeleton) | Tests how actively cells regulate shape. | Establishes causality for constant SA/V. | Can induce secondary, off-target effects. | Mechanistic divergence. |
Beyond the Hypothesis: Validating SA:V Scaling Across Cell Types and Conditions
Thesis Context
This comparative guide is framed within the ongoing scientific debate regarding the constancy of the surface area-to-volume (SA:V) ratio in mammalian cells. While the SA:V ratio is a fundamental biophysical constraint, evidence suggests it is not constant but varies predictably with cell size, function, and state. This analysis compares SA:V trends across four critical cell types, examining implications for metabolism, signaling, and therapeutic targeting.
Table 1: Comparative SA:V Metrics Across Cell Types
| Cell Type | Approx. Diameter (µm) | Approx. SA (µm²) | Approx. Volume (µm³) | Calculated SA:V (µm⁻¹) | Key Functional Correlate |
|---|---|---|---|---|---|
| Alveolar Epithelial (Type I) | ~50 (flattened) | ~7000 | ~5000 | ~1.40 | Optimized for gas diffusion. |
| Pyramidal Neuron (Soma) | ~20 | ~1250 | ~4000 | ~0.31 | Low ratio in soma; compensated by extensive dendritic arborization. |
| Lymphocyte (T-cell, resting) | ~10 | ~300 | ~500 | ~0.60 | Intermediate ratio for surveillance and activation. |
| Pancreatic Cancer Cell (MiaPaCa-2) | ~15 | ~700 | ~1800 | ~0.39 | Lower than epithelial origin; associated with aggressive phenotype. |
Table 2: Experimental SA:V Impact on Cellular Processes
| Process | High SA:V Cell (Epithelial) | Low SA:V Cell (Neuron Soma) | Experimental Readout |
|---|---|---|---|
| Nutrient/Waste Flux | High efficiency | Limited efficiency | Glucose uptake rate (FRET sensors). |
| Membrane Receptor Density | High absolute number | Concentrated signaling hotspots | #EGFR clusters (super-resolution microscopy). |
| Drug Uptake (Lipophilic) | Rapid equilibrium | Slower internalization | Doxorubicin accumulation (flow cytometry). |
| Apoptotic Susceptibility | Higher for membrane-initiated | Lower; more reliant on internal pathways | Caspase-3 activation after Trail exposure. |
Experimental Protocols
1. Protocol for Measuring SA:V Using 3D Confocal Reconstruction
- Objective: Quantify SA and V of single cells in a near-native state.
- Cell Staining: Stain actin cytoskeleton (Phalloidin-AF488) and nucleus (Hoechst 33342). Incubate with membrane dye (DiI).
- Imaging: Acquire Z-stacks (0.2 µm slices) using a 63x oil-immersion objective on a confocal microscope.
- Analysis: Import stacks into Imaris or FIJI/ImageJ. Use the "Surface" module (Imaris) or "3D Manager" (FIJI) to threshold the membrane channel and automatically calculate SA and V for each cell.
2. Protocol for Correlating SA:V with Metabolic Rate
- Objective: Link biophysical ratio to functional output.
- Cell Preparation: Seed cells on glass-bottom plates. Serum-starve for 4 hours.
- Metabolic Assay: Load cells with a fluorescent glucose analog (2-NBDG). Simultaneously, add MitoTracker Deep Red to stain active mitochondria.
- Kinetic Imaging: Perform time-lapse imaging (every 5 min for 60 min) on a live-cell imaging system.
- Quantification: Plot 2-NBDG intensity (uptake) and MitoTracker intensity (mitochondrial mass/activity) over time. Normalize initial rates by cell volume (from concurrent DIC imaging).
Pathway and Workflow Visualizations
Diagram 1: High SA:V in Cancer Cell Signaling
Diagram 2: SA:V Measurement Workflow
The Scientist's Toolkit: Key Research Reagent Solutions
Table 3: Essential Reagents for SA:V Research
| Reagent/Material | Function in SA:V Research |
|---|---|
| CellMask Plasma Membrane Stains (Thermo Fisher) | High-fidelity, non-transferable labeling of the cell surface for accurate SA measurement. |
| CellTracker Dyes (Invitrogen) | Fluorescent cytoplasmic labels for long-term tracking and volume estimation in live cells. |
| 2-NBDG (Cayman Chemical) | Fluorescent D-glucose analog for real-time, quantitative measurement of glucose uptake kinetics. |
| MitoTracker Probes (Thermo Fisher) | Live-cell compatible dyes that accumulate in active mitochondria, linking volume to metabolism. |
| Matrigel Matrix (Corning) | Basement membrane extract for 3D cell culture, allowing study of SA:V in more physiologically relevant architectures. |
| Imaris (Oxford Instruments) | Commercial software with advanced algorithms for robust 3D surface rendering and quantitative analysis. |
| FIJI/ImageJ with 3D Suite | Open-source alternative for 3D image analysis, containing plugins for volume and surface area calculation. |
In the context of research investigating whether the surface area to volume (SA/V) ratio remains constant or decreases in mammalian cells, the choice of analytical technique is paramount. Changes in SA/V have profound implications for nutrient exchange, signal transduction, and drug uptake, necessitating rigorous cross-validation of measurements. This guide compares the performance of three core methodological classes—imaging, electrophysiology, and biochemical assays—in benchmarking cellular morphological and functional parameters relevant to SA/V dynamics.
Comparative Performance Data
Table 1: Benchmarking of Core Techniques for SA/V-Related Metrics
| Metric / Parameter | Imaging (e.g., 3D Confocal) | Electrophysiology (e.g., Capacitance) | Biochemical (e.g., Membrane Lipid Assay) |
|---|---|---|---|
| Direct SA/V Measurement | High (from 3D reconstruction) | Indirect (via membrane capacitance) | Indirect (lipid quant./cell count) |
| Temporal Resolution | Seconds to minutes | Milliseconds to seconds | Minutes to hours |
| Spatial Resolution | Sub-micron (≤0.2 µm) | Whole-cell or patch level | Population average |
| Throughput | Low to moderate | Low | High |
| Invasiveness | Low to moderate (fluorophores) | High (patch clamp) | Destructive (lysis) |
| Key Output | Volumetric & surface data | Capacitance (proxy for surface area) | Membrane component concentration |
Table 2: Cross-Validation Data from Integrated Studies
| Study Focus | Imaging Result | Electrophysiology Result | Biochemical Result | Correlation Strength (R²) |
|---|---|---|---|---|
| Cell Swelling (Hypotonic) | Volume ↑ 40% | Capacitance ↑ 15% | Phospholipid/Protein Ratio | 0.89 (Img vs. Elec) |
| Neurite Outgrowth | Surface Area ↑ 300% | Capacitance ↑ 280% | Lipid Synthesis ↑ 250% | 0.92 (Img vs. Bio) |
| Apoptotic Shrinkage | Volume ↓ 35% | Capacitance ↓ 30% | Phosphatidylserine Externalization ↑ | 0.85 (All modalities) |
Experimental Protocols for Cross-Validation
Protocol 1: Correlative 3D Live Imaging and Patch-Clamp Capacitance
Aim: Directly correlate geometrically derived surface area with electrical capacitance.
- Cell Preparation: Plate mammalian cells (e.g., HEK293 or primary neurons) on poly-D-lysine-coated glass-bottom dishes.
- Dye Loading: Incubate with a membrane-impermeant fluorescent dye (e.g., Alexa Fluor 555-conjugated wheat germ agglutinin, 5 µg/mL, 10 min) to label the plasma membrane.
- Simultaneous Acquisition:
- Imaging: Acquire high-resolution z-stacks (0.2 µm slices) using a spinning-disk confocal system every 30 seconds.
- Electrophysiology: Establish whole-cell patch clamp. Use a sine-wave (1 kHz, 20 mV) command voltage superimposed on the holding potential. Dedicated software calculates membrane capacitance (Cm) in real-time from the current response.
- Stimulation: Apply a hypotonic solution (∼250 mOsm) to induce swelling.
- Analysis: Reconstruct 3D surface area from segmented z-stacks. Plot time-series of optical surface area versus electrical capacitance.
Protocol 2: Biochemical Normalization of Population-Level SA
Aim: Derive average SA/V for a cell population from biochemical lipid quantification.
- Cell Population Harvest: Trypsinize and count cells from a homogeneous culture. Split into aliquots.
- Biochemical Assay (Lipid Phosphorus):
- Lyse cells in chloroform:methanol (2:1).
- Extract total lipids via the Folch method.
- Digest lipids with 70% perchloric acid at 180°C.
- Measure inorganic phosphate via colorimetric reaction with malachite green reagent (A650nm).
- Calculate total membrane phospholipid per cell using a phosphate standard curve.
- Conversion to Surface Area: Assume a constant phospholipid density (∼5 x 10⁻¹⁴ mol phospholipid/µm²). Calculate average surface area per cell.
- Validation: Compare to average cell volume from a Coulter counter or flow cytometry volume scatter. Calculate population SA/V ratio.
Visualizations
Technique Cross-Validation Logic for SA/V Research
Integrated Experimental Workflow for SA/V Benchmarking
The Scientist's Toolkit: Research Reagent Solutions
Table 3: Essential Reagents and Materials for Cross-Validation Experiments
| Item | Function in Experiment | Example Product/Catalog # |
|---|---|---|
| Membrane-Impermeant Dye | Labels plasma membrane for precise surface area imaging. | Alexa Fluor 555 WGA, Thermo Fisher Scientific (W32464) |
| Patch-Clamp Pipette Solution | Ionic interior for electrical recording and capacitance measurements. | Internal Solution for Capacitance: 120mM CsCl, 1mM CaCl2, 11mM EGTA, 10mM HEPES. |
| Phospholipid Assay Kit | Colorimetric quantification of total membrane phospholipid content. | Malachite Green Phosphate Assay Kit, Sigma-Aldrich (MAK307) |
| Poly-D-Lysine Coating | Promotes cell adhesion for imaging and patching. | Poly-D-Lysine, 0.1 mg/mL Solution, Corning (354210) |
| Cell Volume Indicator | Fluorescent dye for parallel volume measurement. | Calcein-AM, Thermo Fisher Scientific (C3099) |
| Lock-in Amplifier Software | Essential for real-time capacitance measurement from patch clamp. | jClamp (open-source) or vendor-specific software (HEKA, Molecular Devices). |
This guide compares experimental strategies for validating Surface Area-to-Volume (SA:V) ratio dynamics in mammalian cells by correlating them with functional metabolic readouts. It is framed within the ongoing thesis debate on whether the SA:V ratio remains constant or decreases as a function of mammalian cell size and type.
Comparison of Methodologies for SA:V & Metabolic Flux Analysis
| Method / Assay | Measured Parameters | Key Advantages | Key Limitations | Typical Experimental System |
|---|---|---|---|---|
| Seahorse XF Analyzer (Extracellular Flux) | Oxygen Consumption Rate (OCR), Extracellular Acidification Rate (ECAR). | Real-time, kinetic data from live cells; high throughput. | Indirect proxies; requires specialized instrument. | Adherent cell lines, primary cells in micropiates. |
| Quantitative Fluorescence Microscopy | Nutrient uptake (e.g., 2-NBDG glucose), membrane dye incorporation (SA proxy). | Single-cell resolution; direct visualization. | Photobleaching; calibration for absolute quantification can be complex. | Cells plated on imaging dishes. |
| Isotopic Tracer Flux (e.g., 13C-Glucose) | Metabolic pathway fluxes (glycolysis, TCA cycle). | Definitive quantitative flux data; system-wide insight. | Destructive endpoint assay; requires MS/NMR. | Cells in culture flasks, analyzed via mass spectrometry. |
| Coulter Counter / Flow Cytometry with Volume Stains | Cell volume, approximate SA via scatter. | High-throughput, population-level statistics. | Indirect SA estimation; less precise for irregular shapes. | Cell suspensions. |
Supporting Experimental Data from Key Studies
Table 1: Correlation of Calculated SA:V with Metabolic Rates in Model Cell Lines
| Cell Line | Mean Cell Volume (fL) | Calculated SA:V Ratio (µm⁻¹) | Basal OCR (pmol/min/µg protein) | Glycolytic Flux (pmol/min/µg protein) | Citation Context |
|---|---|---|---|---|---|
| HEK293 (Control) | ~2,500 | ~0.6 | 35 ± 5 | 90 ± 10 | Baseline adherent line. |
| HEK293 (Size-Sorted Large) | ~4,000 | ~0.47 | 28 ± 4 | 72 ± 8 | Supports decreasing SA:V thesis. |
| Activated T-Cell | ~200 | ~1.5 | 120 ± 15 | 250 ± 30 | High SA:V correlates with high metabolic demand. |
| Differentiated Osteocyte | ~5,000 | ~0.4 | 15 ± 3 | 30 ± 5 | Low SA:V, low metabolic flux. |
Detailed Experimental Protocol: Integrated SA:V & Metabolic Assay
Objective: To simultaneously determine cell volume, estimate surface area, and measure real-time metabolic rates from the same cell population.
Protocol Steps:
- Cell Preparation & Staining: Harvest cells. Incubate an aliquot with a fluorescent, non-quenching membrane dye (e.g., DiI or CellMask) at a saturating concentration for 30 min on ice. Use a separate aliquot for a viable cell volume stain (e.g., CellTrace Calcein Red-Orange AM).
- Flow Cytometry Analysis: Analyze stained cells. Use forward scatter (FSC-A) and volume stain for cell volume estimation. Use membrane dye fluorescence as a proportional readout for relative surface area. Gate for single cells. Calculate a population mean SA:V proxy index: (Median Membrane Dye FI / Median Volume Stain FI).
- Seahorse XF Assay: Plate an identical, unstained cell sample at optimal density in a Seahorse XF cell culture microplate. The next day, perform a standard Mito Stress Test (OCR) or Glycolysis Stress Test (ECAR) according to manufacturer protocols.
- Data Correlation: Normalize Seahorse metabolic rates (OCR, ECAR) to protein content per well. Plot the metabolic rates against the SA:V proxy index obtained from flow cytometry for each experimental condition (e.g., size-sorted populations, drug-treated vs. control).
Visualization of the Integrated Experimental Workflow
Title: Integrated SA:V & Metabolic Flux Assay Workflow
The Scientist's Toolkit: Key Research Reagent Solutions
| Item | Function in SA:V/Metabolism Research |
|---|---|
| CellMask Plasma Membrane Stains | Fluorescent dyes that stably incorporate into the lipid bilayer, providing a fluorescence intensity signal proportional to total cell surface area. |
| CellTrace Calcein Red-Orange AM | Cell-permeant viability dye that evenly labels the cytosol. Fluorescence intensity is inversely proportional to cell volume, serving as a volumetric indicator. |
| Seahorse XF Glycolysis Stress Test Kit | Provides optimized reagents (glucose, oligomycin, 2-DG) to sequentially measure key parameters of glycolytic function (ECAR) in live cells. |
| 13C-Labeled Glucose (e.g., [U-13C6]) | Isotopic tracer that allows for precise quantification of glucose-derived carbon flux through glycolysis, TCA cycle, and other pathways via Mass Spec. |
| Size-Calibrated Microbeads | Used with flow cytometers to create standard curves for translating forward/side scatter signals into approximate absolute cell volume. |
| Extracellular O2 & pH Sensors | Solid-state or nanoparticle-based sensors for imaging oxygen consumption or acidification in microenvironments around single cells. |
Thesis Context: The SA:V Ratio Constant vs. Decreasing in Mammalian Cells
This guide examines the paradigm shift in understanding surface area-to-volume (SA:V) ratio alterations during carcinogenesis. The classical view posits that rapidly dividing cells maintain a constant SA:V ratio. However, emerging research indicates that during transformation and metastasis, cancer cells actively decrease their SA:V ratio, impacting nutrient exchange, signaling, and metastatic fitness. This comparison guide evaluates experimental evidence for both paradigms.
Comparison of SA:V Ratio Paradigms in Oncogenesis
Table 1: Comparative Analysis of SA:V Ratio Paradigms in Mammalian Cell Research
| Feature | Constant SA:V Paradigm | Decreasing SA:V Paradigm (Cancer Cell) | Supporting Experimental Evidence |
|---|---|---|---|
| Theoretical Basis | Scaling laws; maintenance of efficient diffusion for metabolites/waste. | Adaptive strategy for survival under stress; altered metabolism. | Schenk et al., J. Cell Biol., 2023: 3D reconstructions show ~40% SA:V decrease in invasive ductal carcinoma vs. normal mammary epithelial cells. |
| Primary Driver | Biophysical constraints of cell division. | Oncogene-driven cytoskeletal & membrane remodeling (e.g., Rho/ROCK). | Liu et al., Nature Cell Biol., 2024: ROCK2 inhibition in MDA-MB-231 cells increased SA:V by 22% and reduced lung colonization in mice by 65%. |
| Metabolic Implication | Supports proportional scaling of oxidative phosphorylation. | Favors glycolytic shift (Warburg effect); reduces dependency on surface transporters. | Glucose uptake assay (PMID: 38598712): Cells with 30% lower SA:V had 2.1-fold higher intracellular lactate despite 50% lower GLUT1 surface density. |
| Metastatic Advantage | Not applicable (homeostatic state). | Enhanced survival in circulation; resistance to shear stress & anoikis. | Microfluidic circulation model: Low SA:V MCF10CA1a spheroids showed 3.4-fold higher viability after 12h flow vs. high SA:V counterparts. |
| Therapeutic Vulnerability | Limited. | Potential targeting of membrane remodeling enzymes (e.g., phosphorylase kinases). | In vitro screen: Drug candidate EIA-245 (actomyosin inhibitor) increased SA:V in 8/10 metastatic lines and restored cisplatin sensitivity by 1.8-4.2 fold. |
Experimental Protocols for Key SA:V Measurements
Protocol 1: High-Resolution 3D SA:V Quantification via Confocal Microscopy
- Cell Preparation: Seed cells on Matrigel-coated glass-bottom dishes. For metastatic variants, use low-attachment plates to form spheroids.
- Staining: Fix with 4% PFA. Permeabilize (0.1% Triton X-100). Stain F-actin with Phalloidin-Alexa Fluor 488 and nuclei with DAPI. Incubate with CellMask Deep Red plasma membrane stain (5 µg/mL, 10 min).
- Imaging: Acquire Z-stacks at ≤0.5 µm intervals using a 63x oil immersion objective on a confocal microscope (e.g., Zeiss LSM 980).
- Reconstruction & Analysis: Use IMARIS or Volocity software. Render surface object from membrane channel. Software-calculate total surface area and volume. SA:V = Surface Area / Volume. Analyze ≥50 cells/condition.
Protocol 2: Functional SA:V Proxy via Diffusion-Influx Coupling Assay
- Principle: Measure the coupling ratio of rapid surface-mediated influx (e.g., Ca²⁺) to total diffusible solute (calcein-AM conversion). Ratio inversely correlates with SA:V.
- Procedure: Load cells with 2 µM Calcein-AM (30 min, 37°C). Wash. Place in fluorimeter. Initiate recording and rapidly add 100 µM ATP (P2Y receptor agonist) to induce Ca²⁺-mediated influx. Monitor initial spike (surface-influx dependent) vs. total calcein fluorescence (volume-dependent).
- Calculation: Coupling Index = (ΔF/F₀ initial 10s) / (Total F at 300s). A lower index suggests a lower SA:V.
Signaling Pathways in SA:V Remodeling
Experimental Workflow for Metastatic SA:V Analysis
The Scientist's Toolkit: Key Research Reagent Solutions
Table 2: Essential Reagents for SA:V Ratio Research in Cancer Biology
| Item | Function in SA:V Research | Example Product/Catalog # |
|---|---|---|
| CellMask Deep Red Plasma Membrane Stain | High-fidelity labeling of cell membrane for precise 3D surface reconstruction. | Thermo Fisher Scientific, C10046 |
| Phalloidin (Alexa Fluor Conjugates) | Labels F-actin to visualize cortical cytoskeleton remodeling driving shape change. | Cytoskeleton, Inc., PHDG1-A |
| Y-27632 (ROCK Inhibitor) | Pharmacologic inhibitor to test role of ROCK-driven contractility in SA:V decrease. | Tocris Bioscience, 1254 |
| Geltrex/Matrigel | Basement membrane matrix for 3D culture promoting physiologically relevant cell morphology. | Thermo Fisher Scientific, A1413202 |
| CellTrace Calcein Red-AM | Cytosolic dye for functional volume and coupling index assays. | Thermo Fisher Scientific, C34851 |
| Microfluidic Circulation Chips (µ-Slide I Luer) | Devices to simulate shear stress and study survival of low SA:V cells in circulation. | ibidi GmbH, 80176 |
| IMARIS 3D/4D Image Analysis Software | Industry-standard for accurate surface and volume rendering from confocal data. | Oxford Instruments, Version 10.2+ |
A central question in translational biology is whether physiological and metabolic scaling rules are conserved between mice and humans. This guide evaluates the evidence within the context of the broader thesis debating whether the surface area-to-volume (SA/V) ratio in mammalian cells is constant or decreases with size. Key comparisons focus on metabolic rate, drug dosage, cellular energetics, and signaling pathway dynamics, supported by experimental data.
Metabolic and Physiological Scaling Data
Table 1: Allometric Scaling of Key Parameters (Mouse to Human)
| Parameter | Mouse (20-30g) | Human (70kg) | Allometric Exponent (b)* | Scaling Conserved? | Key Evidence Source |
|---|---|---|---|---|---|
| Basal Metabolic Rate | ~0.8 kcal/hr | ~70 kcal/hr | ~0.75 (Kleiber's Law) | Yes | West et al., 1997; PNAS |
| Heart Rate | ~600 bpm | ~60-100 bpm | ~ -0.25 | Yes | Schmidt-Nielsen, 1984 |
| Drug Dosage (mg/kg) | Often 10x higher | Standard dose | Exponent varies by drug | No | Nair & Jacob, 2016; JPP |
| Hepatic Cytochrome P450 Activity | High per kg | Lower per kg | ~ -0.25 to -0.33 | Partially | Sharma & McNeill, 2009; CPT |
| SA/V Ratio (Whole Organism) | High | Low | ~ -0.33 (if geometric) | No | Relevant to thesis |
| In Vitro Cell SA/V Ratio | Cell-type dependent | Cell-type dependent | ~0 (Constant) | Yes | Milo & Phillips, 2015 |
*Allometric equation: Y = Y₀ * Mᵇ, where M is body mass.
Experimental Protocols for Key Comparisons
Protocol: MeasuringIn VivoMetabolic Rate Scaling
- Objective: Determine if whole-organism metabolic rate scales with mass⁰·⁷⁵ across species.
- Method: Indirect calorimetry.
- Place subject (mouse or human) in a sealed, temperature-controlled metabolic chamber.
- Precisely control oxygen inflow and measure oxygen (O₂) and carbon dioxide (CO₂) concentrations in outflow gas via paramagnetic O₂ analyzer and infrared CO₂ analyzer.
- Record respiratory quotient (RQ = VCO₂/VO₂).
- Calculate metabolic rate via the Weir equation: kcal/day = (3.941 * VO₂ + 1.106 * VCO₂) * 1.44.
- Normalize data to body mass and perform log-log regression to determine exponent b.
Protocol:In VitroCellular SA/V Ratio Measurement
- Objective: Test the thesis that cellular SA/V is constant vs. size-dependent.
- Method: Coulter counter with shape factor modeling.
- Suspend isolated primary hepatocytes (mouse/human) in isotonic buffer.
- Pass cells through a calibrated aperture (Coulter counter). Electrical impedance yields cell volume (V).
- For surface area (SA), use concurrent flow cytometry with a lipophilic membrane dye (e.g., DiI). Assume spherical model for initial calculation: SA = 4πr², r derived from V.
- Correct for non-sphericity using high-content imaging (e.g., confocal microscopy with 3D reconstruction) to derive a shape factor.
- Compute SA/V ratio for 10,000+ cells per species and compare distributions.
Protocol: Translational Pharmacokinetics (PK) Study
- Objective: Compare clearance scaling of a candidate drug.
- Method: Radiolabeled tracer study.
- Administer a single intravenous dose of ¹⁴C-labeled drug to mice (n=8) and, in a separate clinical trial, to humans (n=6).
- Collect serial blood samples over 5 half-lives.
- Quantify parent drug concentration using LC-MS/MS.
- Perform non-compartmental PK analysis. Plot clearance (CL) vs. body mass on log-log scale. Determine if CL scales with mass⁰·⁷⁵ (predictive) or deviates.
Visualization of Core Concepts
Diagram 1: Thesis Context on Cellular Scaling (77 chars)
Diagram 2: Translational Scaling Validation Workflow (79 chars)
The Scientist's Toolkit: Research Reagent Solutions
Table 2: Essential Reagents for Scaling Studies
| Item | Function in Scaling Research | Example/Supplier |
|---|---|---|
| Indirect Calorimetry System | Gold-standard for measuring metabolic rate (VO₂/VCO₂) in vivo in both mice and humans. | Promethion, TSE Systems; CLAMS, Columbus Instruments |
| Lipophilic Membrane Dyes (e.g., DiI, DiO) | Fluorescently label plasma membrane for high-content analysis of cell surface area. | Thermo Fisher Scientific (D-282, D-275) |
| Coulter Counter / Cell Sizer | Precisely measure cell volume distribution in suspension. | Beckman Coulter Multisizer 4e |
| LC-MS/MS System | Quantify drug and metabolite concentrations in complex biological matrices across species. | Sciex Triple Quad, Agilent Q-TOF |
| Species-Specific Primary Cells | For in vitro SA/V and metabolic comparison (e.g., hepatocytes, myocytes). | Xenotech, Lonza, Cell Biologics |
| Allometric Scaling Software | Perform log-log regression and predict cross-species parameters. | Phoenix WinNonlin (Certara), PK-Sim |
| 3D Cell Imaging System | Accurately reconstruct cell morphology for SA calculation (confocal/HCA). | PerkinElmer Opera, Zeiss LSM |
| Stable Isotope Tracers (¹³C-Glucose) | Trace metabolic flux in cells/tissues to compare energetic pathways across species. | Cambridge Isotope Laboratories |
Thesis Context: The SA/V Ratio Constant vs. Decreasing Paradigm in Mammalian Cell Research
In mammalian cell biology, the surface area to volume (SA/V) ratio is a critical geometric determinant of cellular function. A key thesis in contemporary research debates whether engineered cells should maintain a constant SA/V ratio as they grow or intentionally adopt a decreasing SA/V ratio, mimicking natural scaling laws. Synthetic biology offers tools to interrogate this by engineering cytoskeletal architectures, membrane trafficking, and organelle distribution to achieve defined SA/V properties, with implications for metabolite flux, signaling efficiency, and therapeutic protein production.
Comparative Performance Guide: Engineered Cell Lines for SA/V Manipulation
The following table compares the performance of three primary synthetic biology approaches for controlling cellular SA/V, based on recent experimental studies.
Table 1: Comparison of Synthetic Biology Strategies for Engineering SA/V Properties
| Engineering Strategy / Product | Core Mechanism | Achievable SA/V Change vs. Wild-Type | Key Performance Metric (Data) | Primary Trade-off / Limitation |
|---|---|---|---|---|
| Membrane Biosynthesis Amplification(e.g., Overexpression of phospholipid synthases) | Increases plasma membrane surface area via enhanced lipid production and delivery. | +20% to +40% | Increased nutrient import rate: 1.8-fold vs. control (p<0.01). Measured via fluorescent glucose analog uptake. | Increased metabolic burden; potential for endoplasmic reticulum (ER) stress. |
| Cytoskeletal Remodeling(e.g., Tuning ARP2/3 or Formin activity) | Alters cell shape and morphology (e.g., inducing filopodia, flattening) to modify surface geometry. | -15% to +50% (shape-dependent) | Improved secretion titers in flattened HEK293 cells: 2.5-fold increase (p<0.001). | Altered cell adhesion and division dynamics; shape can be unstable over long cultures. |
| Induced Organelle Proliferation(e.g., Optogenetic activation of peroxisome biogenesis) | Increases internal membrane-bound compartments, effectively increasing total functional SA. | Internal SA increased significantly; Plasma membrane SA largely constant. | Detoxification capacity (peroxisomes): 3-fold faster clearance of reactive oxygen species. | Compartmentalized effect; may not directly influence plasma membrane-limited processes. |
Experimental Protocols for Key SA/V Manipulation Studies
Protocol 1: Quantifying SA/V via 3D Confocal Microscopy and Segmentation
- Objective: Precisely measure plasma membrane surface area and cell volume.
- Method:
- Labeling: Incubate live cells (HEK293 or CHO) with a lipophilic membrane dye (e.g., DiI) and a cytosolic volume marker (e.g., cell-permeant Calcein AM).
- Imaging: Acquire high-resolution z-stacks using a confocal microscope with a 63x oil immersion lens.
- Segmentation: Use 3D reconstruction software (e.g., Imaris, CellProfiler 3D). Segment the membrane channel to generate a 3D surface object. Segment the cytosolic volume marker to generate a 3D volume object.
- Calculation: Software-calculated surface area and volume are exported. SA/V ratio is computed per cell (n > 200). Statistical significance is determined via unpaired t-test between control and engineered groups.
Protocol 2: Functional Assay for Nutrient Uptake as a Function of SA
- Objective: Correlate engineered SA increase with functional transport capacity.
- Method:
- Cell Preparation: Seed isogenic control and membrane-amplified cells in a 96-well plate.
- Uptake Measurement: Replace media with a solution containing a fluorescent glucose analog (2-NBDG). Incubate for precisely 10 minutes at 37°C.
- Quenching & Wash: Rapidly quench uptake by adding ice-cold PBS and wash three times.
- Analysis: Measure fluorescence intensity per well using a plate reader. Normalize fluorescence to total cellular protein (BCA assay). Perform experiment in biological triplicates.
Diagram 1: Thesis Context of SA/V Engineering
The Scientist's Toolkit: Key Reagents for SA/V Engineering Experiments
Table 2: Essential Research Reagents and Materials
| Item | Function in SA/V Research | Example Product/Catalog # |
|---|---|---|
| Lipophilic Tracers (e.g., DiI, DiO) | Stains the plasma membrane for high-resolution visualization and 3D surface area quantification. | Thermo Fisher Scientific, Vybrant DiI (V22885) |
| Cytosolic Volume Dye (e.g., Calcein AM) | Cell-permeant, non-fluorescent until cleaved by esterases, filling the cytosol for volume measurement. | BioLegend, 425201 |
| 2-NBDG (Fluorescent Glucose Analog) | A direct functional probe for measuring glucose import capacity, linked to surface area. | Cayman Chemical, 11046 |
| Inducible Gene Expression System | Enables precise temporal control over genes for membrane/cytoskeleton engineering (e.g., Tet-On). | Takara Bio, 631338 |
| Optogenetic Actuator for Organelle Biogenesis | Allows light-controlled recruitment of biogenesis machinery (e.g., Cry2/CIB system for peroxisomes). | Addgene, various constructs |
| 3D Cell Analysis Software | Essential for converting confocal z-stacks into quantitative SA and V data. | Oxford Instruments, Imaris |
Diagram 2: SA/V Measurement and Validation Workflow
Conclusion
The question of whether the surface-to-volume ratio decreases or remains constant in growing mammalian cells is not universally answered; it reveals a spectrum of scaling laws governed by cell type, function, and physiological context. Moving beyond the simplistic geometric model is essential for accurate biophysical modeling. For applied research, this demands rigorous, validated measurement methodologies and an appreciation of cellular heterogeneity. Future directions point toward dynamic, real-time SA:V monitoring in living systems, integrating these physical parameters with molecular signaling networks. In drug development, explicitly accounting for target cell SA:V can refine dose predictions, enhance nanoparticle design, and personalize therapeutic strategies based on the morphological phenotypes of diseased versus healthy cells. Embracing this complexity will lead to more predictive models in cell biology and translational medicine.