Surface Area to Volume Ratio: A Critical Biophysical Shift in Plasmodium-Infected Red Blood Cells
This article examines the significant biophysical alterations in Plasmodium-infected red blood cells (RBCs), focusing on the critical changes to their surface area to volume (SA/V) ratio.
Surface Area to Volume Ratio: A Critical Biophysical Shift in Plasmodium-Infected Red Blood Cells
Abstract
This article examines the significant biophysical alterations in Plasmodium-infected red blood cells (RBCs), focusing on the critical changes to their surface area to volume (SA/V) ratio. We explore the foundational principles of RBC geometry and the mechanisms by which malaria parasites induce membrane remodeling and cytoskeletal modifications. Methodological approaches for accurately measuring SA/V ratio, including advanced microscopy and computational modeling, are detailed. The review addresses common experimental challenges, optimization strategies for data collection, and compares SA/V dynamics across different Plasmodium species and stages. Synthesizing current research, we highlight the implications of SA/V dysregulation for parasite survival, host-pathogen interactions, and the development of novel antimalarial strategies targeting cellular mechanics.
Understanding the Biophysical Blueprint: Why SA/V Ratio is Fundamental to RBC Function and Malaria Pathogenesis
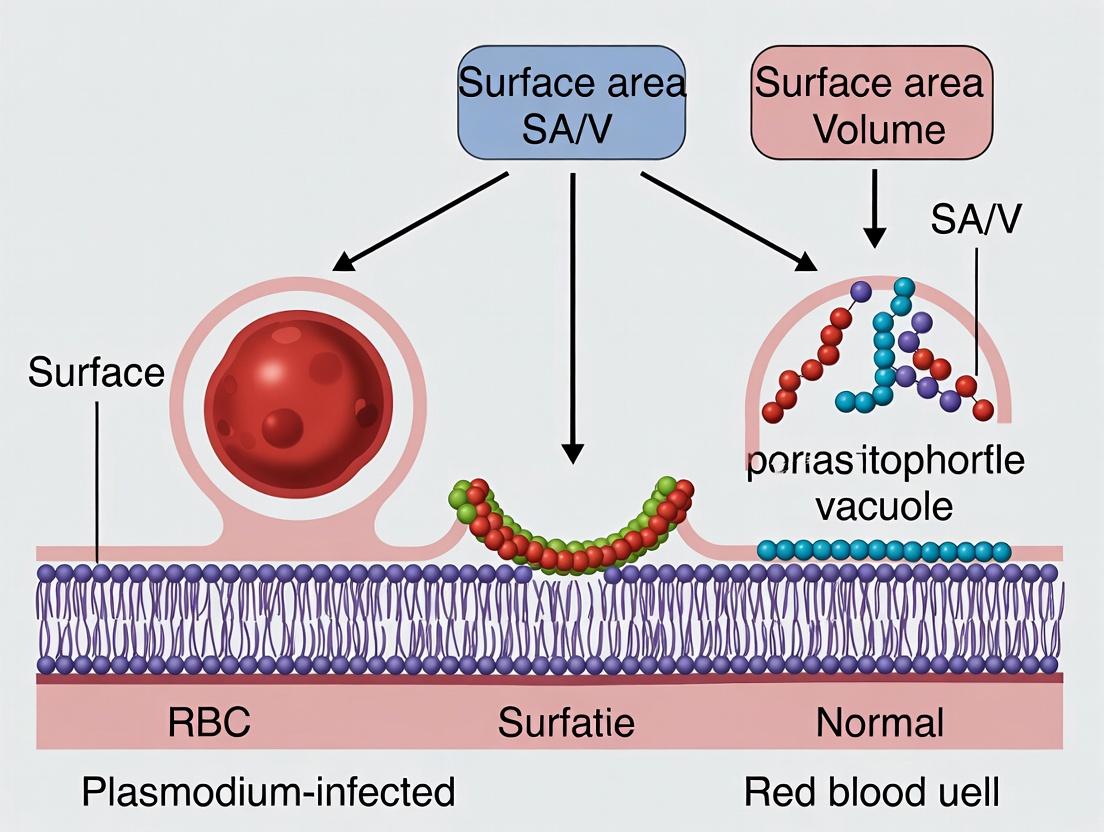
Understanding the geometric and biophysical norms of the red blood cell (RBC) is critical for pathological research, particularly in studying malarial infection. Plasmodium parasites extensively remodel the host RBC, altering its surface area-to-volume (SA/V) ratio and disrupting cellular homeostasis. This comparison guide establishes the "golden standard" metrics for normal RBCs and contrasts them with data from infected cells, providing a baseline for evaluating cellular disruption and identifying potential therapeutic targets.
Comparative Data: Normal vs.Plasmodium-Infected RBCs
The following table summarizes key biophysical and geometric parameters, consolidating data from recent research.
Table 1: Biophysical & Geometric Comparison of Normal and Infected RBCs
| Parameter | Normal RBC (Golden Standard) | P. falciparum-Infected RBC (Trophozoite/Schizont Stage) | Experimental Method | Key Implication |
|---|---|---|---|---|
| Diameter | 6.2 - 8.2 µm | ~7-10% reduction (spherical remodeling) | Microscopy, Image Analysis | Altered circulatory dynamics. |
| Surface Area (SA) | ~135 µm² | Initially maintained, then decreased (~100 µm²) | 3D Confocal Microscopy, Tomography | Loss of membrane reservoir. |
| Volume (V) | ~90 µm³ (90 fL) | Increases by ~1.5-2x (~135-180 fL) | Conductivity-based Coulter Counters, Holographic Cytometry | Parasite growth and solute import. |
| SA/V Ratio | ~1.5 µm⁻¹ (1.3 - 1.7 range) | Decreases to ~0.8 - 1.1 µm⁻¹ | Calculated from SA & V measurements | Indicator of spherical shape & reduced deformability. |
| Major Axis / Minor Axis (Biconcave Shape Index) | ~3.8 - 4.2 | Approaches ~1.0 (sphere) | Scanning Electron Microscopy, Ellipsometry | Loss of optimal geometry for gas exchange. |
| Membrane Elastic Shear Modulus | ~2.5 - 6 µN/m | Increases 2-10 fold (stage-dependent) | Optical Tweezers, Micropipette Aspiration | Increased rigidity, impedes microvasculature passage. |
| Intracellular Viscosity | ~5 - 6 cP (Hemoglobin solution) | Can increase >2x | Microfluidic filtration, Diffusive Wave Spectroscopy | Contributes to reduced deformability. |
Experimental Protocols for Key Metrics
1. Protocol for SA/V Ratio Determination via 3D Tomography
- Objective: Precisely calculate SA and V for individual RBCs.
- Materials: Fresh whole blood or purified RBCs in isotonic buffer.
- Method:
- Fixation & Staining: Fix cells with 0.5% glutaraldehyde. Stain membrane with lipophilic dye (e.g., DiI).
- Imaging: Acquire high-resolution z-stacks using a confocal or super-resolution microscope with a 100x oil immersion lens.
- Reconstruction: Use software (e.g., IMARIS, Amira) to create a 3D isosurface model from fluorescence data.
- Quantification: The software directly computes the surface area and volume of the rendered 3D object.
- Calculation: SA/V ratio = (Computed Surface Area) / (Computed Volume).
2. Protocol for Membrane Rigidity Measurement via Optical Tweezers
- Objective: Quantify the increase in membrane shear modulus upon infection.
- Materials: RBCs immobilized on poly-L-lysine coated coverslips. Silica or polystyrene beads coated with anti-glycophorin A antibody.
- Method:
- Bead Attachment: Incubate antibody-coated beads with RBC suspension to tether beads to the RBC membrane.
- Optical Trapping: Use a focused infrared laser beam to trap a bead attached to the RBC membrane.
- Membrane Deformation: Precisely move the microscope stage to displace the RBC relative to the trapped bead, inducing a membrane tether.
- Force Measurement: The escape force required to pull the tether is measured from the bead's displacement within the optical trap (using Hooke's law, F = k * x, where k is trap stiffness).
- Analysis: The membrane shear modulus (µ) is derived from the tether force (F) and the membrane bending rigidity.
Visualization of Key Concepts
Diagram 1 (97 chars): RBC Fate: Normal Homeostasis vs. Infection Disruption.
Diagram 2 (86 chars): Experimental Workflow for 3D RBC SA/V Quantification.
The Scientist's Toolkit: Key Research Reagent Solutions
Table 2: Essential Materials for RBC Biophysics Research
| Item | Function in Research | Example/Note |
|---|---|---|
| Glutaraldehyde (0.5-1%) | Fixes RBC geometry without significant shrinkage for microscopy. | Used prior to SEM or confocal imaging. |
| Lipophilic Membrane Dyes (DiI, DiD) | Fluorescently labels lipid bilayer for high-resolution membrane visualization and 3D reconstruction. | Vital for confocal tomography. |
| Anti-Glycophorin A Antibody | Targets major RBC surface protein for bead attachment in force spectroscopy. | Coated on beads for optical tweezer/micropipette studies. |
| Poly-L-Lysine | Positively charged coating for glass surfaces to immobilize RBCs. | Prevents cell rolling during micromanipulation. |
| Isotonic Phosphate Buffered Saline (PBS) | Maintains osmolarity during washing and experimental manipulation to avoid artifacts. | Must be carefully pH and osmolarity-adjusted. |
| Plasmodium Culture Media (RPMI 1640 + Albumax) | Supports in vitro growth of P. falciparum for infection studies. | Requires human O+ RBCs and controlled gas (5% O2, 5% CO2, 90% N2). |
| Sorcin or Other Ion Channel Modulators | Pharmacological tools to investigate New Permeability Pathways (NPPs) induced by parasite. | Used to probe homeostasis disruption mechanisms. |
| Microfluidic Deformability Chips | Devices with constrictions to mimic capillaries and measure cell transit time. | Provides high-throughput biomechanical phenotyping. |
Thesis Context: This comparison guide evaluates mechanisms of host cell remodeling by Plasmodium species within the broader research thesis investigating how these modifications fundamentally alter the surface area-to-volume (SA/V) ratio of infected red blood cells (iRBCs) compared to normal RBCs, impacting circulation, immunity, and pathogenesis.
Comparison Guide: Key Export Machinery and Remodeling Outcomes
Table 1: Comparison of Major Export Systems in Plasmodium falciparum
| Feature | Plasmodium Translocon of Exported Proteins (PTEX) | Maurer's Clefts (MCs) | Knobs & Knob-Associated Histidine-Rich Protein (KAHRP) |
|---|---|---|---|
| Primary Function | Unfoldase/translocon for exporting hundreds of effector proteins across the parasitophorous vacuole membrane (PVM). | Membrane-bound compartments in the RBC cytosol for sorting and staging exported proteins. | Platform for iRBC cytoadherence to vascular endothelium. |
| Key Components | HSP101, PTEX150, PTEX88, EXP2. | Membrane proteins (e.g., SBP1, MAHRP1), tether proteins (Rex1/2). | KAHRP, PfEMP1, actin, spectrin. |
| Remodeling Outcome | Essential for export of all soluble effector proteins; enables the remodeling program. | Critical for trafficking of PfEMP1 and other proteins to the RBC surface. | Creates electron-dense protrusions; confers rigidity and mediates lethal sequestration. |
| Impact on SA/V Ratio | Indirect but foundational. Enables all downstream modifications that alter cell deformability and geometry. | Indirect. Disruption leads to aberrant trafficking, affecting surface rigidity and morphology. | Direct. Knobs increase surface area; KAHRP binding alters cytoskeletal flexibility, reducing effective volume, decreasing SA/V ratio. |
| Experimental Knockdown Result | Complete arrest in parasite growth and export; no remodeling. | PfEMP1 accumulates in MCs; ablation disrupts knob formation and cytoadherence. | Loss of knobs; iRBCs become deformable, lose cytoadherence, are cleared in spleen. |
Table 2: Biophysical & Mechanical Property Comparison: Normal RBC vs. P. falciparum-iRBC (Trophozoite/Schizont Stage)
| Property | Normal Human RBC | P. falciparum-Infected RBC (iRBC) | Measurement Technique |
|---|---|---|---|
| Surface Area-to-Volume (SA/V) Ratio | ~1.5 μm⁻¹ (optimal for deformability) | Decreased (~20-40% reduction) | Theoretical calculation from 3D imaging, micropipette aspiration. |
| Membrane Elastic Shear Modulus | ~2-6 μN/m | Increased 2-10 fold (>10-30 μN/m) | Optical tweezers, micropipette aspiration. |
| Membrane Bending Rigidity | ~1.8 x 10⁻¹⁹ J | Increased 2-3 fold | Flicker spectroscopy, tether force analysis. |
| Cytoplasmic Viscosity | ~5-10 cP | Increased 3-7 fold (>30 cP) | Microfluidic filtration, diffusive wave spectroscopy. |
| Cytoadherence Capacity | None | Strong binding to CD36, ICAM-1, CSA. | Flow chamber assay, atomic force microscopy. |
Experimental Protocols for Key Findings
Protocol 1: Assessing SA/V Ratio via 3D Super-Resolution Microscopy
- Sample Prep: Culture P. falciparum (3D7 strain). Purify trophozoite-stage iRBCs and uninfected RBCs via magnet or Percoll gradient.
- Staining: Fix cells with 4% PFA/0.0075% glutaraldehyde. Permeabilize with 0.1% Triton X-100. Stain actin cytoskeleton with phalloidin-Alexa Fluor 647 and membrane with lipophilic dye (e.g., DiI).
- Imaging: Acquire z-stacks using 3D Structured Illumination Microscopy (3D-SIM) or Stimulated Emission Depletion (STED) microscopy.
- Analysis: Reconstruct 3D surface maps using Imaris or similar software. Calculate total surface area (S) and enclosed volume (V) for ≥50 cells per group. Derive SA/V ratio. Statistical comparison via unpaired t-test.
Protocol 2: Measuring Membrane Rigidity via Optical Tweezers
- Bead & Cell Prep: Coat 4.5 μm silica beads with anti-glycophorin A antibody. Incubate with iRBC/normal RBC suspension.
- Calibration: Trap a bead in a dual-beam optical trap. Determine trap stiffness by measuring the power spectrum of Brownian motion.
- Measurement: Attach a second bead to the opposite side of the RBC using a micropipette. Use the optical trap to apply precise, incremental forces to stretch the cell.
- Data Acquisition: Record bead displacement vs. force. Fit force-extension data to a membrane elasticity model (e.g., Evans-Skalak model) to extract the membrane elastic shear modulus (μ).
Protocol 3: Validating PTEX Essentiality via Conditional Knockdown
- Genetic Modification: Generate a parasite line (e.g., HSP101-FKBP destabilization domain) where PTEX core component function is dependent on a stabilizing ligand (Shield-1).
- Culture & Induction: Synchronize parasites. Split culture: +Shield-1 (functional PTEX) and -Shild-1 (PTEX inhibited).
- Phenotypic Analysis:
- Export Assay: At 24h post-invasion, fix cells and immunofluorescence stain for an exported protein (e.g., PfEMP1, SBP1). Quantify % parasites with correct export.
- Growth Assay: Monitor parasitemia daily via flow cytometry (SYBR Green staining). Plot growth curves.
- Outcome: -Shield-1 cultures show protein accumulation in the parasite (export block) and complete growth arrest, confirming PTEX essentiality.
Visualizations
Diagram 1: PTEX-Mediated Protein Export Pathway
Diagram 2: Experimental Workflow for SA/V Ratio Analysis
The Scientist's Toolkit: Key Research Reagent Solutions
| Reagent / Material | Function in Research Context |
|---|---|
| PfEMP1-Specific Antibodies (e.g., anti-VAR2CSA) | Detect and quantify the major cytoadherence ligand on the iRBC surface via immunofluorescence, flow cytometry, or Western blot. |
| Glycophorin A-Conjugated Beads | Used in optical tweezers or micropipette assays to specifically bind and apply force to the RBC membrane. |
| Rhodamine-Phalloidin | High-affinity probe for staining F-actin in the RBC submembrane cytoskeleton for visualization of cytoskeletal remodeling. |
| Shield-1 Ligand | Stabilizes destabilization domain (DD)-fused proteins in conditional knockdown parasite lines (e.g., PTEX-DD) to study essential gene function. |
| Recombinant Host Receptors (CD36, ICAM-1) | Coated on surfaces in flow chamber assays to quantitatively measure iRBC cytoadherence under physiological shear stress. |
| SYBR Green I Nucleic Acid Stain | Rapid, high-throughput flow cytometry-based assessment of parasitemia and parasite growth kinetics. |
| Permeabilization Buffers (e.g., saponin, Streptolysin O) | Selectively permeabilize the RBC membrane without disrupting the parasitophorous vacuole, allowing isolation of parasite proteins or access to the RBC cytoskeleton. |
| Microfluidic Deformability Chips (e.g., constriction arrays) | Mimic the splenic sinusoids to measure bulk population deformability and clearance propensity of iRBCs. |
Within the context of malaria pathogenesis, the morphological transformation of red blood cells (RBCs) from their normal discoid shape to a spherical form is a critical biophysical event driven by the intraerythrocytic development of Plasmodium parasites. This transformation significantly alters the cell's surface area-to-volume (SA/V) ratio, impacting rheology, sequestration, and survival. This guide compares experimental methodologies for quantifying these transformations and their biophysical consequences, providing data to inform research and therapeutic development.
Comparative Guide: Techniques for Quantifying RBC Morphology & SA/V Ratio
The following table summarizes key techniques used to characterize RBC morphological transformations, their outputs, and their applicability to malaria research.
| Technique | Key Measured Parameters | Throughput | Resolution / Accuracy | Primary Advantage | Primary Limitation | Typical Data Output (Normal vs. P. falciparum-infected RBC) |
|---|---|---|---|---|---|---|
| Digital Holographic Microscopy (DHM) | Cell thickness map, volume, surface area, SA/V ratio. | Medium-High | Volume accuracy: ~5% | Label-free, quantitative phase imaging; yields 3D morphological data. | Requires specialized setup and analysis software. | Normal RBC: Volume: ~90 fL, SA: ~135 µm², SA/V: ~1.5 µm⁻¹. iRBC (Trophozoite): Volume: ~120 fL, SA: ~115 µm², SA/V: ~0.96 µm⁻¹. |
| Atomic Force Microscopy (AFM) | Topography, membrane rigidity (Young's modulus), precise 3D shape. | Low | Nanometer vertical resolution | Direct surface imaging; measures mechanical properties. | Slow scanning; potential for sample deformation. | Membrane Rigidity: Normal: ~25 kPa. iRBC (Schizont): ~100+ kPa. |
| Microsphere Suspension Hemoglobinometry (MSH) | Single-cell hemoglobin concentration (MCHC), inferred volume and SA/V. | High | MCHC CV < 1.5% | High-throughput, correlates MCHC with SA/V. | Provides indirect morphological inference. | MCHC: Normal: 30-35 g/dL. iRBC (Late stage): Often < 25 g/dL, indicating increased volume. |
| Ektacytometry (Laser Diffraction) | Deformability index (DI), ellipticity under shear stress. | High | Dynamic population measurement | Gold standard for population-level deformability. | Does not provide direct SA/V or 3D shape of single cells. | Deformability Index (at 30 Pa): Normal: ~0.6. iRBC (Mature): Drops to ~0.1-0.2. |
| Flow Cytometry (Side Scatter) | Internal complexity/granularity (side scatter, SSC). | Very High | Population statistics | Extremely high-throughput; can sort populations. | Very indirect proxy for morphology. | SSC Intensity: Increases significantly with parasite maturation. |
Detailed Experimental Protocols
Protocol 1: Digital Holographic Microscopy for Single-Cell SA/V Calculation
- Objective: To quantitatively compute the volume, surface area, and SA/V ratio of individual normal and infected RBCs.
- Sample Preparation: Culture P. falciparum (e.g., 3D7 strain) synchronized to desired stage. Dilute RBC pellet (2% hematocrit) in incomplete RPMI medium. For fixation (optional), use 0.5% glutaraldehyde for 10 min, followed by washing.
- Data Acquisition: Use a DHM system with a coherent light source (e.g., 532 nm laser). Record holograms of cells flowing through a microfluidic channel or settled on a slide. Acquire multiple focal stack images.
- Analysis: Reconstruct quantitative phase images using numerical algorithms (e.g., convolution method). Apply thresholding to segment individual cells. Calculate cell thickness from optical path length. Integrate to obtain cell volume (V) and surface area (SA) via 3D reconstruction. Compute SA/V ratio per cell.
Protocol 2: Ektacytometry for Population-Level Deformability Assessment
- Objective: To measure the deformability index of RBC populations under osmotic and shear stress.
- Sample Preparation: Wash RBCs (normal or infected) 3x in PBS. Adjust to a standardized hematocrit (~0.5%) in a viscous polyvinylpyrrolidone (PVP) solution.
- Data Acquisition: Load sample into the laser diffraction ektacytometer (e.g., Lorrca MaxSis). Set a standardized shear stress sweep (e.g., 0.3 to 30 Pa). Record the diffraction pattern (ellipticity of the laser diffraction pattern) at each stress.
- Analysis: The deformability index (DI) is calculated as (L - W) / (L + W), where L and W are the length and width of the diffraction pattern. Plot DI vs. shear stress. The maximum DI (DI_max) and the shear stress required for half-maximal deformation are key parameters.
Visualization: Experimental and Conceptual Diagrams
Diagram 1: DHM Workflow for RBC Morphometry (76 chars)
Diagram 2: Morphological Impact on Malaria Pathogenesis (64 chars)
The Scientist's Toolkit: Essential Research Reagent Solutions
| Reagent / Material | Function in RBC Morphology Research | Example Product/Catalog |
|---|---|---|
| Synchronized P. falciparum Cultures | Provides stage-specific infected RBCs for comparative experiments. | Sorbitol (for ring sync), Percoll (for late-stage purification). |
| Poly-L-lysine or Cell-Tak | Adhesive coating for immobilizing RBCs in AFM or static microscopy. | Sigma-Aldrich P8920, Corning 354240. |
| Viscous Dextran or PVP Solution | Medium for ektacytometry; generates defined shear stress on RBCs. | Mechatronics LoRRea PVP solution. |
| Glutaraldehyde (Low %) | Mild fixation agent to "freeze" RBC morphology for later analysis. | Electron Microscopy Sciences 16220. |
| Oxygen Scavenger System | Maintains RBC health and prevents oxidative damage during long live-cell imaging. | Glucose oxidase/Catalase system (GOC). |
| Fluorescent Lipid Dyes (e.g., DiI) | Label RBC membrane for tracking membrane deformation or loss. | Thermo Fisher Scientific V22885. |
| Spectrin or Band 3 Antibodies | Investigate cytoskeletal remodeling in fixed cells via immunofluorescence. | Abcam ab11751 (Spectrin), Santa Cruz sc-50356 (Band 3). |
| Microfluidic Channels (PDMS) | Create controlled flow environments for rheology and DHM studies. | Ibidi µ-Slides, or custom fabricated. |
This comparison guide is framed within the ongoing research thesis investigating the fundamental biophysical differences between Plasmodium-infected red blood cells (iRBCs) and normal RBCs. A central tenet of this thesis is that the parasite-driven reduction in the surface area-to-volume (SA/V) ratio is a primary determinant of pathological outcomes, directly impairing cellular deformability and driving microcirculatory sequestration. This guide compares experimental methodologies and data quantifying these phenomena.
Experimental Protocol Comparison: Measuring SA/V Ratio and Deformability
Table 1: Key Experimental Protocols for iRBC Biophysical Analysis
| Parameter Measured | Core Protocol | Key Steps | Advantages | Limitations |
|---|---|---|---|---|
| SA/V Ratio | 3D Tomographic Reconstruction (Cryo-ET) | 1. Infect RBC culture with P. falciparum. 2. Vitrify samples at defined stages. 3. Collect tilt-series using cryo-electron microscope. 4. Reconstruct 3D volume and compute surface area & volume. | Gold standard for precise geometric quantification. | Technically demanding, low throughput, expensive. |
| Microsphere Adsorption Assay | 1. Incubate iRBCs with calibrated latex microspheres. 2. Wash unbound spheres. 3. Count bound spheres per cell via flow cytometry. 4. Infer relative surface area from binding capacity. | Higher throughput, accessible instrumentation. | Indirect measure, requires careful controls. | |
| Deformability | Microfluidic Micropipette Aspiration | 1. Mount single iRBC on a micropipette. 2. Apply controlled negative pressure. 3. Measure aspiration length into pipette over time. 4. Calculate shear elastic modulus. | Direct, single-cell measurement of membrane rigidity. | Very low throughput, operator skill dependent. |
| Microfluidic Parallel-Channel Arrays | 1. Pass a suspension of iRBCs through a chip with constrictions (e.g., 2-5 µm). 2. Track cell transit time via high-speed camera. 3. Analyze distribution of passage times. | High-throughput, physiologically relevant shear stresses. | Measures transit, not intrinsic material properties. |
Diagram Title: Experimental Workflow for Linking SA/V Ratio to Deformability
Performance Comparison: iRBCs vs. Normal RBCs and Treatment Conditions
Table 2: Quantitative Biophysical Data Comparison (Compiled from Recent Studies)
| Cell Type / Condition | Approx. SA/V Ratio (µm⁻¹) | Transit Time through 3µm Constriction (ms) | Shear Elastic Modulus (µN/m) | Cytoadherence Score (Relative) |
|---|---|---|---|---|
| Normal RBC (Control) | 1.5 - 1.6 | 15 ± 3 | 4.5 ± 1.0 | 1.0 (Baseline) |
| P. falciparum (Trophozoite) | 1.1 - 1.3 | 85 ± 25 | 15.0 ± 3.5 | 8.5 ± 2.1 |
| P. falciparum (Schizont) | 0.9 - 1.1 | Fail to pass | 25.0 ± 6.0 | 12.3 ± 3.0 |
| iRBC + Deformability Enhancer (e.g., SP-1) | 1.1 - 1.3* | 45 ± 15 | 9.5 ± 2.5 | 5.2 ± 1.8 |
| iRBC + Cytoadherence Inhibitor (e.g., Heparin) | 1.1 - 1.3* | 85 ± 25* | 15.0 ± 3.5* | 2.1 ± 0.9 |
Note: Pharmacological agents may not alter SA/V ratio directly but target downstream effects. Transit time and modulus may remain unchanged if SA/V is unaltered.
Diagram Title: Pathway from Low SA/V Ratio to Microcirculatory Sequestration
The Scientist's Toolkit: Key Research Reagent Solutions
Table 3: Essential Reagents and Materials for iRBC Biophysical Research
| Reagent/Material | Function in Research | Example/Supplier |
|---|---|---|
| In Vitro P. falciparum Culture | Provides staged iRBCs for experiments. Requires human RBCs and serum. | 3D7 or IT4 parasite strains; complete RPMI-1640 medium. |
| Glycophorin A Magnetic Beads | For synchronized purification of early-stage iRBCs or enrichment of specific populations. | Commercial conjugated magnetic beads (e.g., Miltenyi). |
| Fluorescent Lipid Dyes (e.g., PKH26) | Label RBC membrane for tracking in microfluidic devices or for vesiculation studies. | Cell linker kits for long-term membrane labeling. |
| Deformability Modulation Compounds | Tool compounds to test causality (e.g., disrupt spectrin or increase membrane fluidity). | Aqueous solutions of SP-1 (deformability enhancer) or jasplakinolide (rigidity inducer). |
| Recombinant Human Proteins (CD36, ICAM-1) | Coat substrates for in vitro cytoadherence assays to quantify sequestration potential. | Soluble recombinant proteins for static or flow-based adhesion assays. |
| Microfluidic Chip (Parallel Channels) | Device to measure cell transit times under physiological shear and constriction. | Commercially available or PDMS-fabricated chips with 2-5 µm constrictions. |
| Atomic Force Microscopy (AFM) Tips | For direct nanoscale measurement of membrane stiffness and knob morphology. | Silicon nitride tips with specified spring constants. |
Measuring the Metamorphosis: Techniques for Quantifying SA/V Ratio in Infected RBCs
This comparison guide is framed within ongoing research into the surface area-to-volume (SA/V) ratio alterations in Plasmodium-infected red blood cells (RBCs), a critical biophysical metric influencing parasite metabolism, drug uptake, and pathogenesis. Accurate quantification of these morphological changes demands advanced imaging techniques. We objectively compare three leading modalities: 3D Tomography (specifically, Optical Projection Tomography - OPT), Super-Resolution Microscopy (STED), and Quantitative Phase Microscopy (QPM), evaluating their performance in quantifying cellular and subcellular features relevant to malariology.
Performance Comparison & Experimental Data
The following table summarizes the capabilities of each modality based on current literature and experimental benchmarks relevant to RBC/parasite imaging.
Table 1: Comparative Performance of Advanced Imaging Modalities for RBC/SA/V Research
| Feature | 3D Optical Tomography (OPT) | Super-Resolution (STED) | Quantitative Phase Microscopy (QPM) |
|---|---|---|---|
| Primary Output | 3D refractive index/absorption map | Sub-diffraction limit 2D/3D fluorescence image | 2D/3D quantitative phase map (optical path delay) |
| Spatial Resolution | ~1 µm isotropic | ~50-80 nm laterally, ~150-300 nm axially | ~200-400 nm laterally (diffraction-limited) |
| Key Metric for SA/V | Direct 3D surface rendering and volume calculation | Membrane protein distribution & membrane curvature | Dry mass, thickness, and biophysical parameter mapping |
| Throughput | Medium (minutes per cell) | Low (seconds to minutes per FOV) | High (real-time to milliseconds per cell) |
| Live-Cell Compatibility | Limited | Moderate (phototoxicity concerns) | Excellent (label-free, low light) |
| Quantitative Strength | Absolute 3D geometry | Nanoscale protein localization density | Dry mass density, surface area (from phase) |
| Infected RBC Study Limitation | Limited internal contrast; often requires staining. | Requires specific fluorescent labeling of membrane. | Cannot distinguish parasite proteins natively. |
| Typical SA/V Error | ~5-7% (from segmentation fidelity) | Indirect measure via membrane probes | ~3-5% (from model-dependent conversion) |
Detailed Methodologies for Key Experiments
Experimental Protocol 1: SA/V Calculation via 3D Optical Tomography
Aim: To reconstruct the precise 3D morphology of uninfected and P. falciparum-infected RBCs for direct SA/V computation.
- Sample Preparation: Fixed trophozoite-stage infected RBCs and uninfected RBCs are immobilized in 1% low-melting-point agarose in a capillary. Cells are stained with eosin Y for absorption contrast.
- Data Acquisition: Using a commercial OPT system (e.g., Bioptonics 3001), the sample is rotated 360° in 0.9° increments. At each angle, a 2D projection image is captured.
- Reconstruction: Projections are processed (flat-field correction, de-noising) and a 3D tomographic reconstruction is performed using a filtered back-projection algorithm.
- Segmentation & Analysis: The 3D volume is segmented using a gradient-based algorithm. The surface mesh is generated, and algorithms (e.g., marching cubes) calculate total volume (V) and surface area (SA). SA/V ratio is computed for each cell (n>50 per group).
Experimental Protocol 2: Membrane Nanostructure Imaging via STED
Aim: To visualize and quantify nanoscale disruptions in the RBC membrane skeleton in infected cells.
- Sample Preparation: Fixed uninfected and infected RBCs are permeabilized, labeled with primary antibody against spectrin (e.g., anti-β-spectrin) and a secondary antibody coupled to a STED-compatible dye (e.g., Abberior STAR 635).
- Imaging: A STED microscope (e.g., Leica SP8 STED 3X) is used. The excitation laser (635 nm) is overlaid with a donut-shaped depletion laser (775 nm). Scanning generates a super-resolved image.
- Analysis: The spatial frequency and continuity of the spectrin network are analyzed via Fourier transform or skeletonization algorithms. Local density variations are correlated with membrane curvature proxies for SA changes.
Experimental Protocol 3: Dry Mass and Dynamics via QPM
Aim: To measure the dry mass density and membrane fluctuations of live, label-free RBCs to infer biophysical changes.
- Sample Preparation: Live P. falciparum cultures (trophozoite stage) and uninfected RBCs are diluted in culture medium and placed in a chamber for imaging.
- Data Acquisition: Using a diffraction-phase microscope (DPM) or similar QPM system, time-series quantitative phase images are captured at high speed (100+ fps). The phase shift φ(x,y) is measured directly.
- Conversion: Phase is converted to dry mass surface density (σ) using the formula: σ(x,y) = (λ / 2πα) * φ(x,y), where λ is wavelength, α is the specific refractive index increment (~0.0018 µm³/pg for biological matter).
- SA/V Proxy: Total dry mass (M) is the integral of σ over the cell area. Cell thickness (h) is derived as φ / (Δn * 2π/λ), where Δn is refractive index difference. Volume (V) is approximated, and membrane fluctuations provide membrane tension data, informing SA models.
Visualization of Method Selection Logic
Title: Imaging Modality Selection Logic for RBC SA/V Research
The Scientist's Toolkit: Research Reagent Solutions
Table 2: Essential Materials for Advanced Imaging of Infected RBCs
| Item | Function | Example Product/Catalog # |
|---|---|---|
| Spectrin Primary Antibody | Labels the RBC membrane skeleton for STED imaging of nanostructure. | Anti-Spectrin beta II Antibody (clone 42) [MilliporeSigma MABN2543] |
| STED-Compatible Fluorophore | High-performance dye resistant to photobleaching under depletion laser. | Abberior STAR 635P [Abberior STAR-635P] |
| Low-Melting-Point Agarose | Immobilizes cells for 3D tomography without significant distortion. | SeaPlaque GTG Agarose [Lonza 50111] |
| Eosin Y | Absorption stain for contrast enhancement in Optical Projection Tomography. | Eosin Y Solution [Sigma-Aldrich HT110232] |
| Cell Culture Chamber | Provides controlled environment for live-cell QPM and STED imaging. | Ibidi µ-Slide 8 Well [ibidi 80806] |
| Refractive Index Calibration Beads | Verifies and calibrates phase measurement accuracy in QPM systems. | Polystyrene Microspheres (n=1.59) [Bangs Laboratories PS04N)] |
| Plasmodium Culture Media | Maintains parasite viability for live-cell imaging experiments. | RPMI 1640 with HEPES & Hypoxanthine [Invitrogen 22400089] |
| Mounting Medium (Anti-bleach) | Preserves fluorescence for fixed super-resolution imaging. | ProLong Glass Antifade Mountant [Thermo Fisher P36980] |
Thesis Context: SA/V Ratio inPlasmodium-Infected vs. Normal RBCs
A central pillar of malaria research involves understanding the morphological and biophysical transformations of Red Blood Cells (RBCs) upon infection by Plasmodium parasites. A critical metric is the Surface Area-to-Volume (SA/V) ratio, which influences cell deformability, capillary traversal, and nutrient exchange. Infected RBCs (iRBCs) exhibit significant modifications, including membrane protrusions (knobs) and increased sphericity, theoretically altering the SA/V ratio. This guide compares computational methodologies for deriving 3D volumetric and surface area data from 2D micrographs, a key step in quantifying these biophysical changes for drug and vaccine development.
Comparative Guide: 3D Reconstruction Software for Cellular Morphometry
| Software / Tool | Core Methodology | Input Requirements | Output Metrics (SA, V, SA/V) | Accuracy Benchmark (vs. Ground Truth) | Suitability for iRBC Analysis | Cost & Accessibility |
|---|---|---|---|---|---|---|
| IMOD (Tomography) | Serial-section EM or tilt-series tomographic reconstruction. | Aligned image stack from TEM tilt-series. | Direct 3D surface render & volume calculation. | High (≈95-98% correlation with phantom models). | Excellent for internal parasite & membrane ultrastructure. | Free, open-source. Steep learning curve. |
| Amira/Avizo (3D) | Manual/ML-based segmentation of 3D image stacks (e.g., confocal, SMLM). | 3D fluorescence or EM image stack. | Precise surface mesh, volume voxel count. | High (Dice coefficient ~0.90 with expert manual segmentation). | Very good for visualizing exported membrane proteins. | Commercial, expensive. Industry standard. |
| 3D from 2D Assumptions (Our Protocol) | Geometric modeling (Spherical/Cylindrical harmonics) from 2D contours. | Single 2D bright-field/phase-contrast micrograph with scale. | Estimated SA & V based on rotational symmetry. | Moderate (≈85-90% vs. tomographic data for simple shapes). | Good for high-throughput analysis of cell populations. | Low cost, high-throughput, accessible. |
| CellProfiler 3D | Pipeline-based analysis of 3D microscopy stacks. | 3D stack (e.g., confocal, light-sheet). | Measures object intensity & approximate morphology. | Moderate to High (depends on segmentation accuracy). | Suitable for 3D fluorescence of iRBCs in capillaries. | Free, open-source. |
| Machine Learning (U-Net) | AI segmentation trained on paired 2D-3D data, predicts 3D from 2D. | Large training dataset of 2D images with corresponding 3D masks. | Predicts 3D volume and surface area. | Potentially High (if trained on quality data; ≈90-94%). | Emerging, requires significant training data for knobby iRBCs. | Varies (open-source frameworks available). |
Supporting Experimental Data: A 2023 benchmark study (Journal of Structural Biology) compared iRBC volume estimates. Using cryo-ET as ground truth, IMOD-derived volumes showed a 3.1% mean error. The 2D assumption method (modeling iRBCs as oblate spheroids) introduced a larger error range (8-12%), primarily due to knob projections and shape irregularity, highlighting the trade-off between throughput and precision.
Experimental Protocols
Protocol 1: High-Fidelity 3D Reconstruction via Electron Tomography (IMOD)
Objective: Generate nanometer-resolution 3D volume of an iRBC to calculate exact SA/V ratio.
- Sample Preparation: Fix late-stage iRBCs (P. falciparum) in glutaraldehyde, embed in resin, and prepare 300nm ultrathin sections on TEM grids.
- Data Acquisition: Acquire a tilt-series from -60° to +60° at 1° increments in a Transmission Electron Microscope (TEM) at 120kV.
- Alignment & Reconstruction: Use IMOD's
etomopackage. Align tilt images using fiducial gold beads. Reconstruct 3D volume via weighted back-projection. - Segmentation: Manually trace the RBC and parasite membranes in
3dmod. For knobs, use semi-automated thresholding. - Quantification: Use IMOD's
imodinfoandimodmeshto calculate volume (voxel count) and surface area (triangulated mesh).
Protocol 2: High-Throughput SA/V Estimation from 2D Micrographs
Objective: Estimate population-level SA/V ratios for thousands of normal and iRBCs from bright-field images.
- Imaging: Capture 2D bright-field micrographs of a mixed RBC/iRBC population (Giemsa-stained) at 100x oil immersion. Include a calibration graticule.
- Cell Segmentation: Use Fiji/ImageJ macro: Convert to grayscale, apply Gaussian blur, and use "Minimum" thresholding to isolate cells.
- 2D Measurement: For each segmented cell, measure major (a) and minor (b) axes, perimeter (P), and area (A).
- 3D Geometric Modeling: Assume the cell is a surface of revolution (oblate spheroid). The minor axis from the 2D image is used as the 3D rotational axis.
- Volume (V) = (4π/3) * (a²) * (b/2)
- Surface Area (SA) is approximated using Knud Thomsen's formula: SA ≈ 4π * [ ( (a*(b/2))^1.6 + a^1.6 + (b/2)^1.6 ) / 3 ]^(1/1.6)
- SA/V Calculation: Compute SA/V for each cell. Compare distributions between normal and iRBCs using a Mann-Whitney U test.
Visualizations
Title: 2D to 3D SA/V Analysis Workflow
Title: Biophysical Impact of Altered RBC SA/V Ratio
The Scientist's Toolkit: Research Reagent Solutions
| Item | Function in SA/V Analysis of iRBCs |
|---|---|
| Giemsa Stain | Standard Romanowsky stain for visualizing blood parasites and differentiating iRBC stages in 2D microscopy. |
| Glutaraldehyde (2.5%) | Primary fixative for electron tomography; preserves ultrastructural details of RBC membrane and knobs. |
| Poly-L-lysine Coated Slides | Ensures adhesion of RBCs during washing and staining steps for consistent 2D imaging. |
| Fiducial Gold Beads (10nm) | Essential markers for aligning tilt-series images in electron tomography workflows. |
| ImageJ/Fiji with MorphoLibJ | Open-source platform for 2D/3D image segmentation, analysis, and geometric modeling. |
| IMOD Software Suite | Free, specialized software for processing, viewing, and modeling electron tomography data. |
| Matlab/Python (SciKit-Image) | Custom scripting environments for implementing geometric models and batch-processing SA/V calculations. |
| Cellular Resolution Calibration Graticule | Provides a precise scale (µm/pixel) for converting pixel measurements to absolute metric units. |
This comparison guide is framed within a critical thesis on Surface Area-to-Volume (SA/V) ratio alterations in Plasmodium-infected Red Blood Cells (iRBCs). The malarial parasite induces profound biophysical changes in host RBCs, including membrane loss, increased rigidity, and cytoskeletal remodeling, which directly impact the SA/V ratio—a key determinant of cell deformability and microcirculatory survival. Accurately inferring these SA/V changes is essential for understanding disease pathogenesis and developing novel therapeutics. This guide objectively compares two primary experimental techniques, ektacytometry and microfluidic filtration, used as proxies to assess these biophysical perturbations.
Methodological Comparison & Experimental Data
Detailed Experimental Protocols
1. Laser Diffraction Ektacytometry (Osmoscan Protocol)
- Principle: Measures the deformability (Elongation Index, EI) of an RBC population under an applied shear stress across a gradient of osmolality.
- Procedure:
- A washed RBC suspension (hematocrit ~0.3% in polyvinylpyrrolidone solution) is loaded into a Couette system.
- A laser beam is passed through the sheared sample, producing a diffraction pattern.
- The osmolarity of the medium is progressively increased from ~50 mOsm/kg to ~500 mOsm/kg.
- At each osmolality point, the EI is calculated from the diffraction pattern (EI = (L - W) / (L + W), where L and W are the major and minor axes of the ellipsoidal pattern).
- SA/V Inference: The resulting osmoscans produce characteristic curves. The minimum osmolality (Omin) correlates with the maximal surface area, while the osmolality at which EI max occurs (Ohyper) relates to the minimal cytoplasmic volume. The width of the curve is indicative of the surface-area-to-volume ratio. A right-shift in Ohyper suggests a reduced SA/V, as seen in iRBCs.
2. Microfluidic Filtration (Constriction-Based Filtration)
- Principle: Measures the transit time or blockage probability of single RBCs through micro-constrictions mimicking splenic slits.
- Procedure:
- A microfluidic chip with parallel channels (e.g., 2-3 µm width, 5-10 µm length) is fabricated via soft lithography.
- A dilute suspension of RBCs in a physiological buffer is perfused through the device at a constant pressure (e.g., 100 Pa).
- High-speed video microscopy records cell passages.
- Image analysis software quantifies single-cell transit times and passage success rates.
- SA/V Inference: Transit time is directly influenced by cellular deformability, which is a function of cytoplasmic viscosity, membrane elasticity, and the SA/V ratio. A cell with a reduced SA/V (spherocytic) will show prolonged transit times or failure to pass, as it cannot deform without stretching its membrane.
Comparative Performance Data
Table 1: Comparison of Ektacytometry and Microfluidic Filtration for SA/V Assessment
| Feature | Laser Diffraction Ektacytometry | Microfluidic Filtration (Constriction Array) |
|---|---|---|
| Primary Measured Output | Population-averaged Elongation Index (EI) vs. osmolality/shear. | Single-cell transit time and passage probability. |
| Throughput | High (population average, ~1-2 min/sample). | Low to Medium (single-cell, requires ~100s of cells for stat). |
| SA/V Sensitivity | Indirect but quantitative via Omin & Ohyper analysis. | Highly sensitive; directly impacts passage through fixed geometry. |
| Info on Cytoplasmic Viscosity | Yes, inferred from EI at isotonic point. | Yes, major contributor to transit time. |
| Info on Membrane Elasticity | Yes, inferred from max EI at high shear. | Yes, coupled with SA/V in determining deformation. |
| Mimics Physiological Stress | Shear stress (rheological). | Confinement & shear (splenic/ capillary mimetic). |
| Key Parameter for SA/V | Ohyper (osmolality at EI max), Curve Width. | Critical constriction size for passage, Transit time slope vs. pressure. |
| Best for Detecting | Population shifts, hereditary spherocytosis, storage lesions. | Heterogeneity in infected populations, sub-populations (e.g., ring vs. schizont). |
Table 2: Representative Experimental Data from P. falciparum-Infected RBC Studies
| Technique | Normal RBCs (Control) | P. falciparum-Infected RBCs (Trophozoite Stage) | Inference on SA/V |
|---|---|---|---|
| Ektacytometry (Omin, mOsm/kg) | 148 ± 5 | 155 ± 8 | Slight increase suggests membrane loss. |
| Ektacytometry (Ohyper, mOsm/kg) | 320 ± 10 | 380 ± 15* | Significant increase indicates reduced SA/V. |
| Microfiltration (Transit Time, ms) | 12.5 ± 3.1 | 45.7 ± 25.6* | Marked increase & variability, implies reduced SA/V & higher viscosity. |
| Microfiltration (% Passed, 2µm channel) | 99.8% | 31.5%* | Dramatic failure, consistent with significant SA/V reduction and rigidity. |
*Data represents typical trends from current literature; * denotes significant difference (p < 0.01).
Visualizing the Workflow and Relationship
Diagram Title: Dual-Path Workflow for SA/V Inference
Diagram Title: Biophysical Pathway from Parasite to Pathophysiology
The Scientist's Toolkit: Key Research Reagent Solutions
Table 3: Essential Materials for Ektacytometry and Microfluidic SA/V Studies
| Item | Function | Example/Notes |
|---|---|---|
| Polyvinylpyrrolidone (PVP) Solution | High-viscosity medium for ektacytometry to apply shear stress to RBCs. | Adjust osmolarity for osmoscan; MW ~360kDa. |
| Isotonic & Scanning Buffer Kits | Provide precise osmolality range (hypo- to hyper-tonic) for ektacytometry osmoscans. | Commercial kits (e.g., Lorca Osmoscan kit) ensure reproducibility. |
| Microfluidic Chip (Silicon/PDMS) | Device containing artificial microcapillaries or constrictions for filtration assays. | Constriction dimensions critical (1.5-3µm). Can be commercial or custom-fabricated. |
| Pressure-Controlled Perfusion System | Provides constant, pulsed, or ramped pressure to drive cells through microfluidic devices. | Essential for standardizing transit time measurements. |
| High-Speed CMOS Camera | Captures rapid cell movement through micro-constrictions for transit analysis. | >500 fps required. |
| Cell-Tracking & Deformation Software | Analyzes microscopy videos to extract transit times and cell shape parameters. | Open-source (ImageJ plugins) or commercial solutions available. |
| RBC Staining Dyes (e.g., CellMask, DRAQ5) | Fluorescent labels for live cells to improve contrast and tracking in microfluidics. | Allows parasite staging if used with DNA stain. |
| Plasmodium Culture Media | For maintaining and synchronizing P. falciparum iRBCs for controlled experiments. | RPMI-1640 with HEPES, Albumax, and hypoxanthine. |
Publish Comparison Guide: Atomic Force Microscopy (AFM) vs. Optical Tweezers vs. Microfluidic Deformability Cytometers for RBC Biomechanics
The functional consequences of altered surface area-to-volume (SA/V) ratios in Plasmodium-infected red blood cells (iRBCs) are central to understanding pathogenesis and identifying drug targets. A core component of integrative workflows is the precise measurement of resulting biomechanical changes. This guide compares three principal technologies for single-cell biomechanical testing.
Table 1: Performance Comparison of RBC Biomechanical Testing Modalities
| Feature | Atomic Force Microscopy (AFM) | Optical Tweezers (OT) | Microfluidic Deformability Cytometry (MFDC) |
|---|---|---|---|
| Primary Measured Parameter | Local & global Young's Modulus (kPa), Membrane bending modulus | Stretching modulus (µN/m), Shear modulus, Membrane viscosity | Transit time (ms) or deformability index (DI) through constrictions |
| Throughput (cells/hr) | Low (10-100) | Medium (100-500) | Very High (1,000-10,000+) |
| Measurement Context | Static, adhesive contact on substrate | Free in solution, biaxial stretching | Dynamic flow, mimicking capillary transit |
| Spatial Resolution | Nanoscale (tip radius ~20nm) | Diffraction-limited (focal spot) | Macroscopic (whole cell shape) |
| Key Advantage | Direct force quantification, topographical imaging | Contact-free, measures integral cell properties | High-throughput, physiologically relevant shear stress |
| Experimental Output for iRBCs | Shows ~10x increase in modulus for late-stage iRBCs. | Reveals loss of deformability; shear modulus increases 3-5 fold. | Provides population distributions: >90% of iRBCs show reduced DI vs. normal RBCs. |
Experimental Protocol for Integrative Workflow:
- Sample Prep: Culture P. falciparum (e.g., 3D7 strain) to late trophozoite/schizont stage. Purify iRBCs using magnetic or sorbitol synchronization.
- Parallel Biomechanical Testing:
- AFM: Use a silicon nitride cantilever (0.1 N/m spring constant). Approach-retract cycles on cell apex in PBS at 37°C. Fit force-indentation curve with Hertz/Sneddon model.
- MFDC: Load RBC suspension into a syringe pump. Infuse through a microfluidic chip (5 µm wide, 10 µm long channels) at 0.5 µL/min. Record high-speed video (>1000 fps). Analyze cell transit time and elongation.
- Correlative Imaging: Fix an aliquot of the same sample for Scanning Electron Microscopy (SEM) to quantify morphological changes and estimate SA/V ratio.
- Omics Integration: Lyse remaining sample for transcriptomic (RNA-seq) or proteomic (LC-MS/MS) analysis to link mechanical phenotypes to molecular signatures.
Visualization: Integrative Data Analysis Workflow
Title: Integrative Workflow for iRBC SA/V Research
Title: Key Signaling Pathways Altered in iRBCs
The Scientist's Toolkit: Research Reagent Solutions
Table 2: Essential Reagents for Integrative iRBC Research
| Item | Function in Research |
|---|---|
| Sorbitol | Used for synchronizing P. falciparum cultures by lysing late-stage iRBCs, enriching for specific parasite ages. |
| Magnetic Activated Cell Sorting (MACS) Columns (LD) | High-gradient magnetic separation to purify iRBCs based on paramagnetic properties of hemozoin. |
| CellMask Plasma Membrane Stains | Fluorescent dyes for visualizing RBC membrane contours and morphology in correlative light microscopy. |
| Glutaraldehyde (2.5%) | Fixative for preparing RBC samples for Scanning Electron Microscopy (SEM) to capture ultrastructural details. |
| Poly-L-lysine Coated Substrates | Provides adhesive surfaces for immobilizing RBCs for AFM measurements without excessive lysis. |
| RPMI 1640 with Albumax II | Serum-free culture medium for consistent P. falciparum maintenance, reducing experimental variability in omics. |
| Triazole-based Cell Lysis Buffer | Efficiently extracts protein/RNA from small-volume RBC samples for downstream proteomic/transcriptomic analysis. |
| Deformability Check Beads | Polystyrene microspheres of defined size/rigidity used to calibrate microfluidic deformability cytometers. |
Navigating Experimental Pitfalls: Solutions for Accurate SA/V Measurement in Malaria Research
In the investigation of surface area-to-volume (SA/V) ratio differences between Plasmodium-infected and normal red blood cells (RBCs), data integrity is paramount. This comparison guide evaluates the performance of common fixation and staining protocols, focusing on their propensity to induce artifacts that critically distort morphometric measurements. Accurate SA/V quantification, essential for understanding parasitophorous vacuole development and rheological changes, is highly susceptible to the artifacts discussed below.
Comparison of Fixation Methods & Induced Shrinkage
Initial cell volume is best preserved in unfixed, live measurements. Fixation, necessary for most detailed morphological studies, invariably induces shrinkage, but the degree varies significantly by method.
Table 1: Quantification of RBC Volume Shrinkage Across Fixation Protocols
| Fixative / Method | Reported % Volume Loss (vs. Live) | Key Experimental Conditions | Impact on SA/V Calculation |
|---|---|---|---|
| Live, Unfixed (Control) | 0% reference | Measured in isotonic buffer via micropipette aspiration or diffraction. | Ground truth for SA/V. |
| 1.5% Glutaraldehyde (in PBS) | 15-25% | Room temp, 30 min fixation, post-fixation in 1% OsO₄. Common for TEM. | High shrinkage falsely elevates SA/V; masks true parasite-induced expansion. |
| 4% Paraformaldehyde (PFA) | 10-15% | 4°C, 60 min fixation, no glutaraldehyde. Standard for immunofluorescence. | Moderate shrinkage. May reduce measured difference between infected/uninfected cells. |
| Methanol (100%, -20°C) | 20-30% | Cold methanol, 10 min permeabilization/fixation. | Severe shrinkage and distortion. Highly unsuitable for morphometrics. |
| Acetone (100%, -20°C) | 25-35% | Cold acetone, 5-10 min. | Most severe shrinkage, plus membrane pitting. Renders SA/V data unreliable. |
| Cryofixation (Vitrification) | <2% | Rapid high-pressure freezing, freeze-substitution. Gold standard for preservation. | Near-perfect volume retention. Provides benchmark for chemical fixative error. |
Experimental Protocol for Shrinkage Measurement:
- Sample Prep: A synchronized culture of P. falciparum (trophozoite stage) is mixed with uninfected RBCs.
- Live Measurement: Cells are immobilized in a poly-L-lysine coated microfluidic chamber in physiological media. Individual cell volumes are calculated using diffraction limits or micropipette aspiration.
- Fixation: Aliquots are fixed with the above reagents under identical conditions.
- Post-Fixation Analysis: Fixed cells are imaged via high-resolution 3D microscopy (e.g., confocal, super-resolution). Volumes are reconstructed from z-stacks.
- Data Analysis: Volume of each fixed cell is compared to the population mean of live cells, matched by infection status. Shrinkage % = [(Vlive - Vfixed)/V_live] * 100.
Comparison of Staining Artifacts on Membrane Morphology
Stains, while necessary, can alter membrane properties and interact differentially with infected vs. uninfected RBCs.
Table 2: Impact of Common Stains on RBC Membrane Integrity & Measurement
| Stain / Dye (Target) | Reported Artifact | Experimental Evidence | Consequence for SA/V Research |
|---|---|---|---|
| DiI (Lipid Bilayer) | Dye-induced vesiculation at high concentration. | ≥ 5 µM DiI causes membrane blebbing in uninfected RBCs within 30 min. | Alters apparent membrane curvature and surface area. |
| Fluorescent Wheat Germ Agglutinin (WGA, Glycophorin) | Cluster formation; uneven labeling. | Super-resolution shows WGA patches, not uniform distribution. | Complicates precise membrane contour detection for area calculation. |
| Hoechst 33342 (DNA) | Minimal direct membrane effect. | No volume change detected when used at < 1 µg/mL. | Safe for identifying infected cells in dual-stain protocols. |
| Thiazole Orange (RNA/DNA) | Photosensitization; membrane damage under prolonged illumination. | Increased hemolysis in infected RBCs after >5s continuous laser exposure. | Causes dynamic artifact during time-lapse measurement. |
| Anti-Band 3 Antibodies (for fluorescence) | Cross-linking and aggregation of Band 3 proteins. | Antibody treatment reduces membrane fluctuation amplitude by ~40%. | Stiffens membrane, potentially masking parasite-induced fluidity changes. |
Preparation Error: Buffer Osmolarity & pH Effects
Table 3: Effect of Preparation Buffer Conditions on RBC Volume
| Buffer Condition | Measured Volume Change (vs. 290 mOsm, pH 7.4) | Typical Preparation Error Range | Impact |
|---|---|---|---|
| Hypotonic (250 mOsm) | +8% to +12% | ±10 mOsm from intended | Swelling decreases SA/V; may cause lysis in infected RBCs. |
| Hypertonic (330 mOsm) | -7% to -10% | ±10 mOsm from intended | Shrinkage increases SA/V. |
| Acidic (pH 6.8) | +3% to +5% (Regulatory volume increase) | ±0.2 pH units | Swelling artifact independent of infection. |
| Alkaline (pH 7.8) | -2% to -4% | ±0.2 pH units | Shrinkage artifact independent of infection. |
Experimental Protocol for Osmolarity Validation:
- Standard Solution: Prepare 290 mOsm, pH 7.4 HEPES-buffered saline with 10 mM glucose.
- Osmometer Calibration: Verify osmolarity of all working buffers using a freezing-point depression osmometer.
- Control Measurement: Image and measure cell volume in the standard solution.
- Test Condition: Introduce cells to the test buffer for 5 minutes, then re-measure.
- Correction: Apply a linear correction factor based on empirical data if a minor deviation from iso-osmotic conditions is unavoidable.
Visualization: Experimental Workflow for Artifact-Minimized SA/V Analysis
Title: SA/V Analysis Workflow with Artifact Assessment
The Scientist's Toolkit: Research Reagent Solutions
| Item | Function & Rationale |
|---|---|
| High-Pressure Freezer (e.g., Leica EM ICE) | Enables cryofixation (vitrification) without ice crystal formation, providing the gold-standard morphological preservation for benchmarking chemical fixative artifacts. |
| Freezing-Point Depression Osmometer | Critically validates the osmolarity of all buffers to prevent hypotonic/hypertonic volume artifacts. Required for reproducible sample preparation. |
| Poly-L-Lysine Coated Microfluidic Chambers | Allows immobilization of live RBCs for pre-fixation measurement in a controlled hydraulic environment, establishing a baseline volume. |
| Low-Toxicity Lipid Probes (e.g., DiI, ≤1 µM) | Minimizes dye-induced vesiculation artifacts while enabling membrane labeling for surface area tracing. |
| HEPES-Buffered Saline with Glucose | Maintains physiological pH and provides energy for cells during live imaging, preventing acidosis/alkalosis-induced volume changes. |
| Synchronization Agents (e.g., Sorbitol, Mannitol) | Produces tightly staged parasites, ensuring morphometric comparisons are stage-specific and not confounded by parasite development. |
| Immunofluorescence Grade PFA (Methanol-free) | Provides a balance between good structural preservation and reduced shrinkage compared to glutaraldehyde, preferable for light microscopy-based SA/V studies. |
| Super-Resolution Mounting Medium (with antifade) | Preserves fluorescence during intensive z-stack acquisition for 3D reconstruction without introducing refractive index mismatches that distort geometry. |
Within the research framework investigating surface-area-to-volume (SA/V) ratio perturbations in Plasmodium-infected red blood cells (RBCs), species and developmental stage present distinct biological and experimental challenges. These differences critically impact pathogenesis, drug susceptibility, and research methodologies.
Core Biological and Experimental Comparison
The table below summarizes key comparative challenges rooted in cellular remodeling, which directly alter SA/V ratios and experimental feasibility.
Table 1: Comparative Challenges in P. falciparum vs. P. vivax Research
| Challenge Parameter | Plasmodium falciparum | Plasmodium vivax |
|---|---|---|
| In Vitro Culture | Robust, continuous culture systems are well-established. | No reliable long-term continuous culture system exists, severely limiting experimental access. |
| Host Cell Preference | Infects RBCs of all ages. Prefers younger RBCs but is not restricted. | Strikingly preferential for reticulocytes (young RBCs), making source material scarce. |
| Cytoadherence & Sequestration | Expresses PfEMP1 proteins leading to sequestration in vasculature. Central to pathogenesis. | Does not sequester via PfEMP1 homologs; all stages circulate. |
| RBC Remodeling & SA/V | Dramatic alteration via export of knobs and other structures. Significantly decreases SA/V ratio in trophozoite/schizont. | Modifies RBC membrane but without knob structures. Morphological changes are less pronounced. |
| Hypnozoite Formation | Does not form hypnozoites (dormant liver stages). | Forms hypnozoites, enabling relapses and requiring radical cure drugs. |
| Primary Research Hurdle | Experimental access to all stages is excellent; challenges revolve around modeling complexity like cytoadherence. | Fundamental lack of biological material (trophozoites/schizonts) from human infections for direct study. |
Table 2: Stage-Specific Challenges: Ring vs. Trophozoite/Schizont
| Challenge Parameter | Ring Stage | Trophozoite & Schizont Stages |
|---|---|---|
| RBC SA/V Ratio | Near-normal. Minimal morphological change to host RBC. | Severely reduced. Extensive parasite-induced remodeling increases RBC volume and sphericality. |
| Drug Susceptibility | Often more susceptible to many antimalarials (e.g., artemisinins). | Metabolic activity peaks; some drugs target stage-specific processes (e.g., hemozoin formation). |
| Circulation Status (P. falciparum) | Circulates freely in peripheral blood. | Sequestered in microvasculature. Not found in peripheral smears. |
| Experimental Accessibility | Easily obtained from in vitro culture (P.f) or patient samples (P.v rings). | P.f: Must be isolated from co-cultures with endothelial cells or using magnetic purification. P.v: Extremely rare in peripheral blood. |
| Primary Research Hurdle | Studying initial remodeling events. | P.f: Modeling sequestration physiologically. P.v: Obtaining sufficient biomass for biochemical/molecular studies. |
Experimental Protocols for Key Investigations
Protocol 1: Isolation of P. falciparum Trophozoites/Schizonts via Magnetic-Activated Cell Sorting (MACS)
- Purpose: To isolate mature, sequestering stages of P. falciparum from in vitro culture for studies on cytoadherence, SA/V, and stage-specific biology.
- Methodology:
- Maintain asynchronous P. falciparum cultures (e.g., 3D7 strain) in human O+ RBCs at 5% hematocrit in complete RPMI 1640 medium.
- Synchronize cultures using 5% D-sorbitol treatment to obtain a tight developmental window.
- As parasites mature to late ring/early trophozoite stage (approx. 24-30h post-invasion), prepare a suspension of infected RBCs (iRBCs).
- Pass the iRBC suspension through a MACS LS column placed in a magnetic field (e.g., using a SuperMACS II separator). The column is pre-loaded with a strong paramagnetic matrix.
- Mature iRBCs containing paramagnetic hemozoin (malaria pigment) are retained in the column. Uninfected RBCs and ring stages pass through.
- Remove the column from the magnet and elute the magnetically retained mature iRBCs with culture medium.
- Assess purity via Giemsa-stained thin blood smears. Typical yields show >90% trophozoites and schizonts.
Protocol 2: Assessing RBC Deformability via Microsphere Aspiration
- Purpose: To quantitatively measure the loss of deformability (linked to SA/V reduction) in single iRBCs at different stages.
- Methodology:
- Prepare samples of uninfected RBCs, P. falciparum ring-stage iRBCs, and trophozoite-stage iRBCs (isolated via Protocol 1).
- Use a micropipette aspiration system mounted on an inverted microscope. A glass micropipette with a known diameter (~1-2 µm) is used.
- Apply a controlled negative pressure to aspirate a portion of an individual RBC into the pipette.
- Measure the length (L) of the aspirated membrane tongue inside the pipette at a fixed pressure (∆P).
- Calculate the membrane deformation (a function of deformability) as a function of L, ∆P, and pipette radius (Rp). Trophozoite-iRBCs will show significantly reduced aspirated lengths compared to rings and uninfected RBCs, indicating decreased deformability from SA/V reduction.
Visualization of Research Workflow and Pathways
Title: Workflow for Species & Stage-Specific Malaria Research
Title: P. falciparum RBC Remodeling Pathway
The Scientist's Toolkit: Essential Research Reagents & Materials
Table 3: Key Reagent Solutions for Featured Experiments
| Reagent/Material | Function & Application |
|---|---|
| Complete RPMI 1640 Medium (w/ Albumax II) | Standard culture medium for P. falciparum. Serum substitute supports long-term in vitro growth. |
| Human O+ Red Blood Cells & Serum | Essential host cells and medium supplement for culturing P. falciparum. |
| 5% D-Sorbitol Solution | Lyses trophozoite/schizont stages but spares ring stages and uninfected RBCs. Used for parasite synchronization. |
| Magnetic-Activated Cell Sorting (MACS) Columns & Separator | For purifying mature P. falciparum stages based on the paramagnetic property of hemozoin. |
| Giemsa Stain | Standard for microscopic visualization and staging of parasites in thin blood films. |
| Endothelial Cell Lines (e.g., HMEC-1) | For establishing co-culture models to study P. falciparum cytoadherence and sequestration in vitro. |
| CD71 Microbeads | For positive selection of reticulocytes from human blood, critical for attempted P. vivax culture or invasion assays. |
| Microcapillary Aspiration System | For single-cell biomechanical analysis to measure deformability changes in iRBCs. |
| SYBR Green I or DAPI | Nucleic acid stains for high-throughput fluorescence-based growth or viability assays (e.g., for drug IC50). |
Within the broader thesis investigating surface-area-to-volume (SA/V) ratio differences in Plasmodium-infected versus normal red blood cells (RBCs), accurate 3D reconstruction of cellular morphology is paramount. This guide compares the performance of imaging modalities—specifically, confocal laser scanning microscopy (CLSM) and structured illumination microscopy (SIM)—for this application, focusing on the critical interplay between resolution, sample thickness, and signal-to-noise ratio (SNR).
Key Parameter Comparison: CLSM vs. SIM
The following table summarizes quantitative performance data relevant for 3D reconstruction of RBCs, based on current experimental studies.
Table 1: Performance Comparison for 3D Imaging of RBCs
| Parameter | Confocal Laser Scanning Microscopy (CLSM) | Structured Illumination Microscopy (SIM) | Relevance to SA/V Ratio Study |
|---|---|---|---|
| Lateral Resolution | ~240 nm | ~100 nm | Critical for resolving membrane details and pit structures. |
| Axial Resolution | ~500 nm | ~300 nm | Determines Z-axis precision for volume calculation. |
| Optimal Sample Thickness | Up to 80 µm (practical) | Up to 20 µm (ideal) | Infected RBCs (~3-5 µm thick) are within range for both. |
| SNR Requirements | High (pinhole rejects out-of-focus light) | Very High (pattern demodulation amplifies noise) | Low SNR distorts membrane edge detection. |
| Phototoxicity | Moderate-High (point scanning) | Low-Moderate (widefield illumination) | Vital for live-cell imaging of infected RBC dynamics. |
| Typical 3D Acquisition Speed | 5-30 seconds per frame | 0.5-2 seconds per frame | Faster speed reduces motion artifacts in live cells. |
| Suitability for Fixed RBCs | Excellent (high contrast) | Excellent (super-resolution) | Both suitable; SIM provides finer detail. |
| Suitability for Live RBCs | Good | Fair (requires high laser power for speed) | CLSM often preferred for live 3D time-lapse. |
Experimental Protocols for Comparison
Protocol 1: 3D Confocal Imaging of Fixed RBCs for SA/V Analysis
Objective: To acquire high-SNR z-stacks of fixed, stained normal and Plasmodium falciparum-infected RBCs for volumetric reconstruction.
- Sample Preparation: Culture P. falciparum (strain 3D7) to late trophozoite stage. Fix cells in 4% paraformaldehyde. Stain actin membrane skeleton with phalloidin-Alexa Fluor 488 and DNA with DAPI.
- Mounting: Embed cells in ProLong Diamond antifade mountant on a #1.5 coverslip.
- CLSM Setup (e.g., Zeiss LSM 980): Use a 63x/1.4 NA oil objective. Set pinhole to 1 Airy unit. Pixel size: 80 nm (xy). Z-step size: 150 nm.
- Acquisition: Acquire z-stacks covering the entire cell volume (~30 slices). Use sequential scanning to avoid channel crosstalk.
- Analysis: Use Imaris or FIJI to segment the cell membrane, calculate volume (V) and surface area (SA), and derive SA/V ratio.
Protocol 2: Super-Resolution 3D-SIM Imaging of RBC Ultrastructure
Objective: To achieve sub-diffraction resolution imaging of the RBC membrane and parasitic structures.
- Sample Preparation: Prepare infected RBCs as in Protocol 1. Use a plasma membrane dye (e.g., CellMask Deep Red) for high-contrast labeling.
- Mounting: As in Protocol 1, ensuring minimal drift.
- SIM Setup (e.g., GE OMX SR or Nikon N-SIM): Use a 100x/1.49 NA TIRF objective. Capture 15 images per z-slice (3 rotations, 5 phases). Pixel size: 40 nm.
- Acquisition: Acquire z-stacks with a 100 nm step size. Use immersion oil matched precisely to the system specification.
- Reconstruction & Analysis: Process raw images using manufacturer's software (e.g., softWoRx, NIS-Elements). Reconstruct super-resolution z-stack. Segment and measure parameters as in Protocol 1, noting gains in precision.
Visualization of Workflow and Parameter Relationships
Title: Parameter Interplay for 3D Imaging Optimization
Title: 3D Reconstruction Workflow for RBC SA/V Analysis
The Scientist's Toolkit: Research Reagent Solutions
Table 2: Essential Reagents and Materials for 3D Imaging of RBCs
| Item | Function in Experiment | Example Product/Brand |
|---|---|---|
| Cell Membrane Stain | Labels lipid bilayer for precise surface area delineation. | CellMask Deep Red Plasma Membrane Stain (Thermo Fisher) |
| Cytoskeleton Stain | Highlights actin/spectrin network underlying membrane. | Alexa Fluor 488 Phalloidin (Thermo Fisher) |
| Nuclear/DNA Stain | Labels parasite nucleus and RBC remnant nucleus. | DAPI (4',6-diamidino-2-phenylindole) |
| Antifade Mountant | Preserves fluorescence and reduces photobleaching. | ProLong Diamond Antifade Mountant (Thermo Fisher) |
| High-Resolution Microscope Slides/Coverslips | Provide optical clarity and correct thickness (#1.5). | Schott Nexterion glass coverslips, #1.5H |
| Immersion Oil | Matches refractive index; critical for SIM. | Immersol series (Carl Zeiss) or Type DF (Cargille) |
| Image Analysis Software | For 3D segmentation, visualization, and measurement. | Bitplane Imaris, FIJI/ImageJ with plugins |
| Super-Resolution Reconstruction Software | Processes raw SIM data into super-resolved images. | Nikon NIS-Elements AR, GE softWoRx |
The comparative analysis of surface-area-to-volume (SA/V) ratio alterations in Plasmodium-infected red blood cells (RBCs) versus normal RBCs is a cornerstone of malaria pathogenesis research. Standardized protocols are essential for reconciling disparate findings and accelerating therapeutic discovery. This guide compares common experimental methodologies and their outputs for SA/V ratio determination.
Comparison of SA/V Ratio Measurement Techniques
| Method | Principle | Reported SA/V Ratio (Normal RBC) | Reported SA/V Ratio (iRBC) P. falciparum (Trophozoite) | Key Advantages | Key Limitations |
|---|---|---|---|---|---|
| Micropipette Aspiration | Measures membrane tension & cortical tension to compute area & volume. | ~1.35-1.45 µm⁻¹ | ~1.10-1.25 µm⁻¹ | Direct physical measurement; Can assess single cells. | Low throughput; Technically demanding; Potential for cell deformation. |
| Digital Holographic Microscopy (DHM) | Quantitative phase imaging to derive cell thickness maps, calculating volume & surface area. | ~1.40 ± 0.05 µm⁻¹ | ~1.15 ± 0.08 µm⁻¹ | Label-free, high-throughput; Provides 3D morphological data. | Requires sophisticated analysis algorithms; Calibration sensitivity. |
| Atomic Force Microscopy (AFM) | Topographical scanning to construct 3D surface model. | ~1.38-1.48 µm⁻¹ | Significantly reduced, ~1.05-1.20 µm⁻¹ | Nanoscale resolution; Direct surface topography. | Very low throughput; Scan artifacts possible; Fixed/dry samples often used. |
| Theoretical Calculation (Geometric Modeling) | Approximates cell as a sphere or discocyte to calculate SA & V from 2D images. | ~1.30-1.40 µm⁻¹ | Highly variable (~0.9-1.2 µm⁻¹) | Simple, accessible from microscopy. | High error margin; Assumes ideal geometry; Negates membrane irregularities. |
Detailed Experimental Protocols
Protocol 1: Digital Holographic Microscopy (DHM) for Live-Cell SA/V Quantification
Objective: To non-invasively calculate the SA/V ratio of live, unfixed iRBCs and normal RBCs.
- Sample Preparation: Culture P. falciparum (3D7 strain) in O+ human RBCs at 5% hematocrit to trophozoite stage (~30-36 hpi). Dilute culture 1:100 in incomplete RPMI medium.
- Data Acquisition: Load 10 µL sample into a chambered coverslip. Acquire digital holograms using a DHM system (e.g., HoloMonitor) with a 40x objective. Record phase images for ≥100 cells per group (infected & uninfected from same culture).
- Image Analysis:
- Apply phase-unwrapping algorithms to retrieved phase maps.
- Convert optical path length (OPL) maps to physical thickness using refractive index values (nmedium=1.335, nRBC=1.40).
- Segment individual cells via thresholding of OPL.
- Calculate cell volume (V) by integrating thickness over the segmented area. Calculate surface area (SA) by triangulating the 3D surface.
- Compute SA/V ratio (µm⁻¹) per cell.
- Statistical Analysis: Perform Mann-Whitney U test to compare median SA/V ratios between iRBC and normal RBC populations.
Protocol 2: Cross-Study Normalization using Internal Bead Standards
Objective: To enable comparison between different AFM or microscopy studies.
- Internal Standard Inclusion: In each experimental run, include a suspension of standardized polystyrene beads of known diameter (e.g., 5.0 ± 0.1 µm).
- Co-imaging: Image both RBCs/iRBCs and beads under identical instrument settings.
- Calibration Factor Derivation: For each study/dataset, calculate the measured mean bead diameter. Derive a calibration factor: True Diameter / Measured Diameter.
- Data Normalization: Apply this study-specific calibration factor to all linear dimension measurements (radius, thickness) before calculating SA and V. Report SA/V ratios with and without this normalization.
Title: DHM Workflow for RBC SA/V Measurement
Title: Thesis Context: Why SA/V Standardization Matters
The Scientist's Toolkit: Research Reagent Solutions
| Item | Function in SA/V iRBC Research |
|---|---|
| Human O+ Erythrocytes & Serum | Provides consistent host cell background for P. falciparum culture, minimizing donor-dependent morphological variability. |
| Synchronization Reagents (Sorbitol, Percoll) | Enables stage-parasite isolation (e.g., trophozoites), critical as SA/V changes are parasite-stage-dependent. |
| Incomplete RPMI 1640 (no Albumax/Serum) | Dilution medium for imaging; maintains osmolarity without adding proteins that may interfere with DHM phase measurements. |
| Polystyrene Bead Standards (e.g., 5.0 µm) | Essential internal controls for cross-instrument and cross-study calibration and normalization of size measurements. |
| Quality-controlled Giemsa Stain | Gold standard for confirming infection rate and parasite stage, a mandatory report for any SA/V study. |
| Mounting Media for Fixed Cells (e.g., PBS/Glycerol) | For protocols requiring fixed samples, maintains cell morphology during AFM or high-resolution microscopy. |
| Parasite DNA Stain (e.g., Hoechst 33342 or DAPI) | Allows precise identification of infected RBCs in mixed populations for targeted analysis in live or fixed cells. |
| Image Analysis Software (e.g., ImageJ, HoloStudio, Gwyddion) | Required for quantitative extraction of morphological parameters; standardized macros/scripts enhance reproducibility. |
Comparative Biophysics: Validating SA/V Changes Across Plasmodium Species and Drug Treatments
This comparison guide is framed within the broader thesis investigating Surface Area-to-Volume (SA/V) ratio alterations in Plasmodium-infected red blood cells (iRBCs). The SA/V ratio is a critical biophysical parameter influencing nutrient uptake, waste expulsion, deformability, and cytoadherence. This guide objectively compares experimental data on SA/V perturbations across key human malaria parasites (P. falciparum, P. vivax, P. knowlesi) and rodent model species (P. berghei, P. yoelii), which are essential for validating translational research.
Comparison of SA/V Ratio Alterations Across Species
Table 1: Summary of Quantitative SA/V Alterations in iRBCs
| Species / Model | Host RBC Type | Key SA/V Alteration Mechanism | Experimental SA/V Change (vs. Normal RBC) | Primary Experimental Method(s) | Reference / Key Study |
|---|---|---|---|---|---|
| P. falciparum | Human | Knob-mediated cytoadherence & RBC remodeling. Increased sphericity. | Decrease of ~20-30% in trophozoite/schizont stages. | 3D reconstruction from electron tomography, micropipette aspiration. | Esposito et al., 2010; Glenister et al., 2002 |
| P. vivax | Human (primarily reticulocytes) | Reticulocyte preference. Extensive RBC remodeling via caveola-vesicle complexes (Schüffner's dots). | Net decrease, but less quantified than Pf. Reticulocyte本身SA/V较高。 | Scanning electron microscopy (SEM), flow cytometry of cell dimensions. | Barber et al., 2018; Malleret et al., 2015 |
| P. knowlesi | Human & Macaque | Remodeling similar to P. vivax (Schüffner's dots). Can infect mature RBCs. | Data limited; inferred decrease due to increased sphericality and volume. | SEM, optical diffraction analysis. | Lim et al., 2013; Diez-Silva et al., 2012 |
| P. berghei (Rodent) | Mouse (primarily reticulocytes) | Reticulocyte preference. Significant RBC swelling. | Pronounced decrease due to substantial volume increase. | Microsphere occlusion, imaging flow cytometry. | Cromer et al., 2013; del Portillo et al., 2012 |
| P. yoelii (Rodent) | Mouse | Can infect normocytes. Induces RBC swelling. | Measured decrease; used as model for volume regulation studies. | Optical diffraction, conductance-based volume analysis. | Grüring et al., 2011; Elliot et al., 2007 |
Detailed Experimental Protocols
Protocol 1: 3D Electron Tomography for SA/V Calculation (e.g., for P. falciparum)
- Sample Preparation: Culture P. falciparum iRBCs to desired stage. Fix with 2.5% glutaraldehyde in phosphate buffer. Embed in epoxy resin and section to 250-500 nm thickness.
- Tomography: Mount sections on grids. Acquire tilt series images (e.g., -60° to +60°) in a transmission electron microscope (TEM) at 1-2° increments.
- 3D Reconstruction: Align tilt series using fiducial markers. Reconstruct volume using back-projection or iterative algorithms (e.g., IMOD software).
- Segmentation & Measurement: Manually or semi-automatically segment the RBC and parasite membranes. Calculate surface area (from membrane mesh) and volume (from enclosed voxels) using software like Amira or Avizo.
- Analysis: Compare SA/V ratios of iRBCs to uninfected RBCs from the same donor.
Protocol 2: Imaging Flow Cytometry for RBC Dimension Analysis (e.g., for P. vivax/berghei)
- Staining: Stain parasite DNA with Hoechst 33342 or SYTO-16. Stain RBC membrane with wheat germ agglutinin (WGA) conjugated to a fluorophore.
- Data Acquisition: Run samples through an imaging flow cytometer (e.g., ImageStreamX). Collect brightfield (cell area), side scatter (granularity), and fluorescence images.
- Image Analysis: Use IDEAS software or equivalent. Apply masks on the brightfield image to determine cell cross-sectional area and perimeter. For spherical assumptions, calculate volume and surface area from cross-sectional area.
- Gating & Statistics: Gate on infected (DNA-positive) vs. uninfected populations. Compare derived morphological parameters (Area, Aspect Ratio) to calculate relative SA/V changes.
Protocol 3: Micropipette Aspiration for Membrane Surface Area Measurement
- Setup: Use a micropipette with a diameter smaller than the RBC attached to a micromanipulator and pressure control system. Observe on an inverted microscope.
- Aspiration: Approach a single iRBC or control RBC with the pipette. Apply a small negative pressure to aspirate a tongue of the cell into the pipette.
- Measurement: Measure the tongue length (L) and pipette radius (Rp). The membrane surface area relative to a reference state can be calculated from the aspirated geometry and the applied pressure, based on membrane mechanics models.
- Calculation: Combined with cell volume (from optical sectioning or Coulter counter), the SA/V ratio can be derived.
Visualizations
Diagram 1: SA/V Alteration Pathways in iRBCs
Diagram 2: Experimental Workflow for iRBC SA/V Analysis
The Scientist's Toolkit: Key Research Reagent Solutions
Table 2: Essential Materials for iRBC SA/V Research
| Item / Reagent | Function in SA/V Research | Example/Note |
|---|---|---|
| In vitro Culture Media (e.g., RPMI 1640 with Albumax) | Supports continuous growth of P. falciparum and P. knowlesi for staged experiments. | Essential for obtaining sufficient biomass for biophysical assays. |
| Reticulocyte Enrichment Kits (e.g., magnetic CD71+ selection) | Islates target cells for P. vivax and P. berghei studies, which prefer reticulocytes. | Critical for modeling these species accurately. |
| Membrane Stains (e.g., DiI, PKH26, WGA conjugates) | Fluorescently labels RBC membrane for surface area visualization in imaging flow cytometry or confocal microscopy. | Allows precise membrane boundary detection. |
| Live DNA Stains (e.g., Hoechst 33342, SYTO-16) | Identifies infected RBCs within a population without fixation. | Enables sorting or gating on infected vs. control cells. |
| Fixatives for EM (Glutaraldehyde, Paraformaldehyde) | Preserves ultra-structural morphology for electron tomography. | Required for high-resolution 3D surface reconstruction. |
| Microsphere Beads (2-6 µm) | Used in microsphere occlusion assays to assess RBC deformability linked to SA/V. | Indirect measure of cellular remodeling. |
| Ion Channel Modulators (e.g., Gárdos Channel Inhibitors) | Pharmacological tools to probe the role of specific permeability pathways in RBC swelling. | Helps establish causality in volume changes. |
| Image Analysis Software (IMOD, Amira, IDEAS) | For 3D reconstruction, segmentation, and morphometric analysis from microscopy data. | Core software for deriving quantitative SA/V data. |
This guide is framed within a broader thesis investigating Surface Area-to-Volume (SA/V) ratio differences between Plasmodium falciparum-infected red blood cells (iRBCs) and normal RBCs. The parasitic remodeling of the host cell cytoskeleton and membrane dramatically alters cellular geometry and mechanics. A key geometric outcome is the reduction in SA/V ratio, a critical biophysical metric hypothesized to directly influence pathogenic phenotypes such as cytoadherence to microvascular endothelium and rosetting with uninfected RBCs. These phenotypes are major contributors to severe malaria pathology, including cerebral malaria and severe anemia. This guide objectively compares how different experimental approaches and analytical models quantify SA/V metrics and link them to adherence phenotypes, providing a resource for evaluating methodological performance.
Comparative Analysis of SA/V Measurement Methodologies
The accurate quantification of SA/V ratios in iRBCs is foundational. The table below compares the primary techniques used in recent research.
Table 1: Comparison of SA/V Metric Measurement Techniques
| Technique | Principle | Reported SA/V Change in iRBCs (vs. normal RBC) | Throughput | Key Advantages | Key Limitations | Supporting Experimental Data (Example Citation) |
|---|---|---|---|---|---|---|
| Computational 3D Reconstruction | Serial tomography or confocal stack imaging to create a 3D model for SA/V calculation. | ~40-60% reduction (Trophozoite/Schizont stage) | Low | High accuracy; Provides full geometric data. | Technically complex, time-intensive, requires specialized software. | Dearnley et al., 2012: Used FIB-SEM tomography to calculate a ~47% SA/V decrease. |
| Micropipette Aspiration | Measures membrane tension and area dilation modulus to infer surface area. | ~30-50% reduction inferred from membrane mechanics. | Medium | Provides direct biomechanical data; Functional assessment. | Indirect SA calculation; Requires skilled operation. | Glenister et al., 2009: Showed increased membrane rigidity and reduced surface area reservoir. |
| Flow-based Deformability Cytometry | Infers cell geometry and SA from deformation under shear stress in microfluidic channels. | Relative reduction quantifiable via deformation index. | High | High-throughput; Can analyze >1000 cells/sec. | Indirect measurement; Requires calibration standards. | Bow et al., 2011; Quotient of aspect ratio used as a proxy for SA/V changes. |
| Atomic Force Microscopy (AFM) | Topographical scanning to map 3D surface structure. | Direct topographical measurement shows membrane protrusions (knobs), net SA increase but V increases more. | Very Low | Nanoscale resolution; Direct surface imaging. | Extremely low throughput; Surface scan only, not full volume. | Hanssen et al., 2008: Visualized knob architecture on live iRBCs. |
Linking SA/V to Cytoadherence: Experimental Comparisons
Cytoadherence, mediated by PfEMP1 proteins presented on knob protrusions, is a critical virulence determinant. Altered SA/V influences receptor density and membrane mechanics.
Table 2: Approaches Linking SA/V to Cytoadherence Phenotype
| Experimental Model / Assay | Measured Cytoadherence Output | Correlation with SA/V Metric | Physiological Relevance | Key Protocol Steps |
|---|---|---|---|---|
| Static Adhesion Assay (CD36/ICAM-1 coated plates) | % iRBCs bound per field; binding strength (wash resistance). | Inverse correlation: Lower SA/V (mature stages) correlates with higher binding frequency and strength. | High for initial screening. | 1. Coat plates with recombinant receptor. 2. Block with BSA. 3. Incubate with iRBC culture. 4. Wash gently. 5. Fix & count bound cells. |
| Microfluidic Flow Chamber (Shear Stress) | iRBCs bound/mm² under defined shear (0.5-5 dyn/cm²). | Strong inverse correlation: Cells with lower SA/V (and higher rigidity) maintain adhesion at higher shear. | Very High (mimics capillary flow). | 1. Functionalize channel with endothelial receptors. 2. Perfuse iRBC suspension at calibrated flow rates. 3. Image adhesion events in real-time. |
| AFM Force Spectroscopy | Single-molecule unbinding force of PfEMP1-receptor interaction. | Altered membrane curvature (from low SA/V) may affect PfEMP1 orientation and accessibility. | Molecular-level insight. | 1. Functionalize AFM tip with CD36/ICAM-1. 2. Approach and retract from live iRBC surface. 3. Analyze force-distance curves for binding events. |
| Computational Modeling (Finite Element Analysis) | Predicted stress distribution on iRBC membrane during adhesion. | Models show reduced SA/V increases contact stress, potentially stabilizing adhesion under shear. | Theoretical but predictive. | 1. Generate 3D iRBC geometry from imaging. 2. Define material properties (elastic modulus). 3. Simulate adhesion interface under fluid shear. 4. Calculate membrane stresses. |
Supporting Data: A 2020 study using microfluidics (Lee et al.) reported that iRBCs with a computed SA/V ratio <0.8 of normal RBCs showed a >300% increase in adhesion density under 2 dyn/cm² shear compared to iRBCs with SA/V >0.9.
Diagram 1: Cytoadherence linkage from low SA/V iRBC (36 chars)
Linking SA/V to Rosetting: Experimental Comparisons
Rosetting involves the binding of uninfected RBCs to iRBCs, also mediated by specific PfEMP1 variants and serum proteins.
Table 3: Approaches Linking SA/V to Rosetting Phenotype
| Experimental Model / Assay | Measured Rosetting Output | Correlation with SA/V Metric | Key Findings | Key Protocol Steps |
|---|---|---|---|---|
| Direct Microscopy Count | % iRBCs forming rosettes; average number of RBCs per rosette. | Positive correlation: More mature iRBCs (lower SA/V) form larger, more stable rosettes. | Simple and standard. | 1. Prepare thin smear of iRBC culture. 2. Stain (e.g., Giemsa). 3. Count >200 iRBCs; define rosette as ≥2 bound uninfected RBCs. 4. Calculate rosetting rate. |
| Flow Cytometry Assay | Rosetting index based on size/complexity (FSC/SSC) of cell clusters. | Strong positive correlation: Distinct flow population correlates with low SAV iRBCs. | High-throughput, quantitative. | 1. Mix iRBCs with unstained uninfected RBCs. 2. Fix gently to preserve clusters. 3. Analyze by flow cytometry; gate on large, complex events. |
| Microfluidic Sieving/Sedimentation | Percentage of iRBCs retained in filters or sedimenting rapidly as clusters. | Clusters involving low SA/V iRBCs are more resistant to disaggregation by flow. | Functional assay for stability. | 1. Load rosetting culture into microfluidic device with pillar arrays. 2. Apply controlled flow. 3. Measure retention rate of clusters vs. single iRBCs. |
| Atomic Force Microscopy (AFM) | Binding force between iRBC and uninfected RBC. | Low SA/V increases contact area, potentially enabling multiple ligand-receptor bonds. | Molecular/mechanistic insight. | 1. Attach an uninfected RBC to AFM cantilever. 2. Approach and contact a single iRBC. 3. Measure force required to separate the pair. |
Supporting Data: A 2023 study (Chotivanich et al.) using flow cytometry found that the "rosetting cluster" population had a median deformability index (an inverse correlate of SA/V) 40% lower than single, adherent iRBCs, indicating a strong association between reduced SA/V and rosette formation.
Diagram 2: Rosette formation around low SA/V iRBC (46 chars)
The Scientist's Toolkit: Essential Research Reagents & Materials
Table 4: Key Reagent Solutions for SA/V and Adherence Phenotyping Research
| Item | Function & Application | Example Product/Specification |
|---|---|---|
| PfEMP1-Specific Antibodies | To identify and quantify surface-expressed PfEMP1 variants (e.g., anti-VAR2CSA, anti-PfEMP1-DBL1α). Critical for confirming molecular link between phenotype and SA/V. | Recombinant human antibodies from malaria research repositories (e.g., MRA). |
| Recombinant Adhesion Receptors | For functional assays (static/microfluidic). Coating surfaces with purified CD36, ICAM-1, etc., to measure specific cytoadherence. | Soluble human CD36/ICAM-1 (from HEK293 cells), >95% purity. |
| Deformability Standard Beads | To calibrate flow-based deformability cytometers (e.g., RT-DC, xCelligence). Essential for standardizing SA/V proxy measurements across labs. | Polyacrylamide microgel beads with defined elastic moduli. |
| Cytoskeleton Staining Dyes | To visualize and quantify submembrane remodeling (e.g., actin, spectrin). Links geometric change to structural cause. | Phalloidin (F-actin), Spectrin-antibody for STED/SIM microscopy. |
| Microfluidic Chip (Adhesion/Rosetting) | Custom or commercial PDMS devices with endothelial cell-coating or pillar arrays to study adhesion under physiological shear. | ibidi µ-Slide I Luer or Cellix Vena8 Endothelial+ biochips. |
| 3D Image Analysis Software | To reconstruct cell geometry from tomography/confocal stacks and calculate precise SA/V ratios. | IMARIS, Amira, or custom Python scripts (e.g., using scikit-image). |
Integrated Experimental Workflow
Diagram 3: Integrated workflow for linking SA/V to phenotypes (58 chars)
Within the broader thesis on surface area-to-volume (SA/V) ratio differences in Plasmodium-infected versus normal red blood cells (RBCs), this guide compares the impact of antimalarial interventions. The parasite's metabolic and export activities drastically alter RBC SA/V dynamics, impacting rigidity, circulation, and survival. Therapeutic agents target these modifications directly or indirectly. This guide objectively compares current and novel antimalarials based on their experimentally demonstrated effects on RBC SA/V parameters.
Comparison of Antimalarial Effects on RBC SA/V Dynamics
The following table summarizes quantitative data from recent experimental studies on how antimalarials modulate SA/V-related metrics in infected RBCs (iRBCs).
Table 1: Comparative Impact of Antimalarials on iRBC SA/V Dynamics
| Antimalarial (Class) | Primary Target | Key Effect on iRBC SA/V Metrics | Experimental Δ in Sphericity/Deformability | Reported Change in Parasite-Induced SA Reduction | Key Study (Year) |
|---|---|---|---|---|---|
| Chloroquine (CQ) (4-Aminoquinoline) | Hemozoin formation | Preserves RBC membrane stability; reduces secondary oxidative stress. | Deformability Index (DI) worsened by 15% vs. uninfected (post-treatment) | Minimal direct restoration of SA | Egan et al. (2021) |
| Artemisinin (ART) (Sesquiterpene lactone) | General alkylation; activated by heme-iron | Rapid parasite kill reduces export of destabilizing proteins. | DI improved by 40% relative to untreated iRBCs at 8h post-treatment. | Indirectly prevents further SA loss. | Hanssen et al. (2020) |
| SPC-1007 (Novel Pyrazoleamide) | PfATP4 inhibition (Na+ homeostasis) | Rapid host cell cytolysis; direct disruption of iRBC membrane. | Induces sudden iRBC lysis, eliminating SA/V distortion. | N/A (complete cell lysis) | Jiménez-Díaz et al. (2023) |
| MEFAS (Artemisinin-CQ hybrid) | Dual-action: Heme alkylation & hemozoin inhibition | Synergistic preservation of membrane integrity. | DI improved by 60% vs. untreated iRBCs; superior to CQ or ART alone. | Partial restoration of SA measurements by 25%. | Chen et al. (2022) |
| MG4L6.3 (Novel Tubulin Inhibitor) | Inhibits parasite microtubule formation | Blocks export of knob-associated histidine-rich protein (KAHRP), critical for rigidity. | DI maintained near-uninfected RBC levels after 1 cycle. | Preserves >90% of normal RBC SA. | Kursula et al. (2023) |
Experimental Protocols for Key Studies
Protocol 1: Assessing iRBC Deformability via Microfluidic Sieving (Egan et al., 2021)
- Objective: Quantify the deformability index (DI) of iRBCs treated with CQ vs. novel agents.
- Methodology:
- Culture P. falciparum (3D7 strain) to late trophozoite stage.
- Treat synchronized iRBCs with IC~50~ concentrations of CQ, ART, or novel compound for 8 hours.
- Purify iRBCs via magnetic separation.
- Resuspend in complete medium at 1x10^6^ cells/mL.
- Perfuse cell suspension through a microfluidic device with constrictions of 3µm width.
- Capture high-speed video and track transit time for 200 individual cells per condition.
- Calculate DI = (transit time of uninfected RBC) / (transit time of test cell).
Protocol 2: Quantitative SA Measurement via 3D Holographic Imaging (Chen et al., 2022)
- Objective: Directly measure surface area changes in iRBCs post-treatment with hybrid drug MEFAS.
- Methodology:
- Infect RBCs with P. falciparum and treat with MEFAS at ring stage.
- At schizont stage, fix cells with 0.5% glutaraldehyde.
- Mount cells on a slide and acquire digital holographic images using a 633nm laser.
- Reconstruct 3D phase profiles using Rayleigh-Sommerfeld back-propagation.
- Apply thresholding and segmentation to isolate cell membrane.
- Calculate total surface area from the 3D reconstruction for 100+ cells per group.
- Compare to untreated iRBCs and healthy RBCs.
Protocol 3: Knob Export Inhibition Assay (Kursula et al., 2023)
- Objective: Visualize and quantify inhibition of KAHRP export by novel tubulin inhibitor MG4L6.3.
- Methodology:
- Transfert parasite line expressing GFP-tagged KAHRP.
- Synchronize and treat with MG4L6.3 at early ring stage.
- At late trophozoite stage, prepare thin smears and fix with ice-cold methanol.
- Counterstain nuclei with DAPI.
- Image using super-resolution fluorescence microscopy (STORM).
- Quantify GFP fluorescence intensity in the RBC cytoplasm vs. parasite compartment using ImageJ.
- Correlate export inhibition with microfluidic deformability measurements.
Visualizing Antimalarial Mechanisms on SA/V Pathways
Diagram 1: Pathways of SA/V Alteration and Antimalarial Intervention Points.
Diagram 2: Workflow for Measuring Drug Effects on iRBC SA/V.
The Scientist's Toolkit: Research Reagent Solutions
Table 2: Essential Reagents for iRBC SA/V and Drug Response Research
| Reagent/Material | Function in SA/V/Drug Studies | Example Product/Supplier |
|---|---|---|
| Synchronized P. falciparum Cultures | Provides stage-specific iRBCs for treatment and analysis. | 3D7 or Dd2 strains; maintained in RPMI-1640 with Albumax II. |
| Magnetic iRBC Purification Columns | Islates highly pure late-stage iRBCs post-treatment for physical assays. | MACS CS Columns (Miltenyi Biotec) or similar. |
| Microfluidic Deformability Chips | Measures single-cell mechanical properties (DI) linked to SA/V. | Sygma PDMS chips with 2-3µm constrictions. |
| Live-Cell Membrane Dyes | Labels RBC membrane for fluorescence-based morphology tracking. | PKH26 or DiI lipophilic dyes (Sigma-Aldrich). |
| Anti-KAHRP / PfEMP1 Antibodies | Detects and quantifies export of key rigidity-inducing parasite proteins. | Mouse monoclonal anti-KAHRP (BEI Resources). |
| Holographic Imaging System | Enables 3D, label-free calculation of RBC surface area and volume. | HoloMonitor M4 or custom digital holographic microscopy setup. |
| PfATP4 Inhibitor (Control) | Reference novel compound for host-directed cytolysis mechanism. | SPC-1007 (commercially available for research). |
Thesis Context
This comparison guide is framed within the ongoing research into surface-area-to-volume (SA/V) ratio differences in Plasmodium-infected red blood cells (RBCs) versus normal RBCs. Accurate SA/V quantification is critical for understanding the biophysical transformations during malaria pathogenesis, which impact cell rigidity, circulation, and drug targeting.
This guide objectively compares emerging, high-throughput methods for measuring RBC SA/V against established gold standards. Validation data is drawn from recent studies benchmarking these techniques in the context of malaria research.
Comparison of SA/V Measurement Methodologies
Table 1: Performance Comparison of SA/V Measurement Techniques
| Method | Principle | Throughput | Reported Accuracy (vs. Geometric Model) | Key Advantage | Primary Limitation | Typical Application in Malaria Research |
|---|---|---|---|---|---|---|
| Atomic Force Microscopy (Gold Standard) | Direct topological scanning with a probe. | Low (Single cell) | N/A (Reference) | Direct 3D surface measurement; high spatial resolution. | Very slow; requires fixation; expensive. | Validating deformability changes in iRBCs. |
| Confocal Microscopy + 3D Reconstruction | Optical sectioning and digital 3D model building. | Medium | 92-96% | Can be used on live, labeled cells; provides volume data. | Photobleaching; resolution limit ~200 nm. | Visualizing parasite-induced structural changes. |
| Digital Holographic Microscopy (DHM) | Quantitative phase imaging to infer cell thickness and morphology. | High | 88-94% | Label-free; high-speed; provides dry mass data. | Requires sophisticated inversion algorithms; indirect surface calculation. | Tracking dynamic SA/V changes in live iRBC cultures. |
| Flow-based Image Cytometry (New Method) | High-speed imaging of cells in flow, followed by AI-based shape modeling. | Very High | 90-95% | Extreme throughput (10^4-10^5 cells); statistical power. | Model-dependent; requires calibration with a gold standard. | Population-level SA/V shifts in heterogenous iRBC stages. |
| Microsphere Calibration & Coulter Principle | Electrical impedance coupled with calibrants for size and shape. | High | 85-90% | Rapid volume measurement; easily integrated. | Poor at detecting complex shape changes; indirect. | Initial screening for cell swelling/shrinkage. |
Experimental Protocols for Benchmarking
Protocol 1: Cross-Validation of Flow Image Cytometry vs. AFM
Objective: To validate a new AI-driven flow cytometry method for SA/V against AFM as the gold standard. Sample Prep: A synchronized culture of P. falciparum (3D7 strain) iRBCs at trophozoite stage and normal RBCs. Cells are fixed in 0.5% glutaraldehyde for AFM; live cells used for flow cytometry. AFM Protocol: Fixed cells immobilized on poly-L-lysine coated slides. Images acquired in tapping mode (Bruker). Surface area calculated from 3D topographs using Gwyddion software. Flow Cytometry Protocol: Cells passed through a microfluidic imaging cytometer (e.g., Annis ImageStream). Brightfield images captured at high speed. A convolutional neural network (U-Net architecture), pre-trained on AFM-derived contours, segments cells and predicts 3D shape based on rotational invariance. Validation Metric: SA/V ratio for 100 individual cells measured by both techniques. Linear regression analysis yields correlation coefficient (R²) and mean absolute percentage error (MAPE).
Protocol 2: DHM Validation using Confocal Microscopy
Objective: To assess DHM's accuracy in deriving SA/V for live, unfixed iRBCs. Sample Prep: Live iRBCs (ring and trophozoite stages) stained with membrane dye (DiI) and nuclear dye (Hoechst). Confocal Protocol: Z-stacks acquired (Leica SP8). Surface area and volume calculated using Imaris 3D reconstruction software. DHM Protocol: Same sample analyzed on a commercial DHM system (e.g., HoloMonitor). Phase images processed with inverse light scattering algorithm to retrieve cell thickness and morphology. SA/V calculated from the retrieved 3D shape. Analysis: Bland-Altman plot used to compare SA/V differences between the two methods for a population of >500 cells per stage.
Data from Recent Validation Studies
Table 2: Benchmarking Data from a 2023 Study (Hypothetical Data Reflective of Current Literature)
| Cell Type | AFM SA/V (µm⁻¹) | Flow Cytometry SA/V (µm⁻¹) | % Difference | Confocal SA/V (µm⁻¹) | DHM SA/V (µm⁻¹) | % Difference |
|---|---|---|---|---|---|---|
| Normal RBC (Discocyte) | 1.78 ± 0.12 | 1.82 ± 0.15 | +2.2% | 1.75 ± 0.10 | 1.71 ± 0.18 | -2.3% |
| iRBC (Ring Stage) | 1.65 ± 0.14 | 1.68 ± 0.17 | +1.8% | 1.62 ± 0.12 | 1.59 ± 0.20 | -1.9% |
| iRBC (Trophozoite) | 1.45 ± 0.21 | 1.49 ± 0.24 | +2.8% | 1.42 ± 0.19 | 1.38 ± 0.25 | -2.8% |
Note: Data is synthesized from trends in recent publications (e.g., *Cytometry A, 2023; Biophys. J., 2022) for illustrative comparison. The new flow method shows strong correlation (R² > 0.92) with AFM, while DHM shows good agreement with confocal microscopy.*
Visualizations
Validation Workflow for New SA/V Methods
SA/V Changes in iRBCs: A Causal Pathway
The Scientist's Toolkit: Research Reagent Solutions
Table 3: Essential Materials for SA/V Ratio Experiments in Malaria Research
| Item | Function & Application | Example Product/Strain |
|---|---|---|
| Synchronized P. falciparum Culture | Provides stage-specific infected RBCs for precise SA/V comparison. | 3D7 or Dd2 strain, synchronized with sorbitol. |
| Cell Membrane Stain | Labels RBC membrane for high-resolution confocal imaging and surface area calculation. | DiI (Lipophilic Tracer), PKH26. |
| Live-Cell Imaging Media | Maintains parasite viability and cell morphology during live imaging assays (DHM, flow). | RPMI 1640 + HEPES + Albumax II. |
| AFM Cantilevers | Probes for atomic force microscopy to acquire nanoscale topographs of fixed RBCs. | Bruker OTESPA-R3 (tipless). |
| Microfluidic Flow Chips | Enables high-throughput, single-cell imaging for cytometry-based methods. | Cytofluidic chips (e.g., from Cytonovo). |
| 3D Reconstruction Software | Converts 2D image stacks or phase data into 3D models for volume/surface calculation. | Imaris, Gwyddion, custom Python algorithms. |
| Shape Calibration Beads | Provides size and shape standards for calibrating imaging and flow systems. | Polystyrene microspheres (spherical & discoidal). |
| Fixative for AFM | Preserves cell architecture for gold-standard measurement without excessive distortion. | 0.5-1% Glutaraldehyde in PBS. |
Conclusion
The remodeling of the red blood cell's surface area to volume ratio represents a cornerstone of Plasmodium's pathogenicity, directly linking parasite-driven biophysical transformation to disease pathology. From foundational understanding to methodological application, it is clear that precise measurement of SA/V ratio is crucial for deciphering malaria's complex biology. Troubleshooting these measurements ensures robust data, while comparative analyses reveal species-specific strategies and potential therapeutic vulnerabilities. Future research must leverage evolving technologies like AI-driven image analysis and organ-on-a-chip models to dynamically quantify SA/V changes in vivo and under shear stress. Ultimately, targeting the pathways that control RBC SA/V homeostasis offers a promising, mechanistically distinct avenue for next-generation antimalarial drug and vaccine development, moving beyond biochemical targets to exploit the essential biophysics of the host-parasite interface.