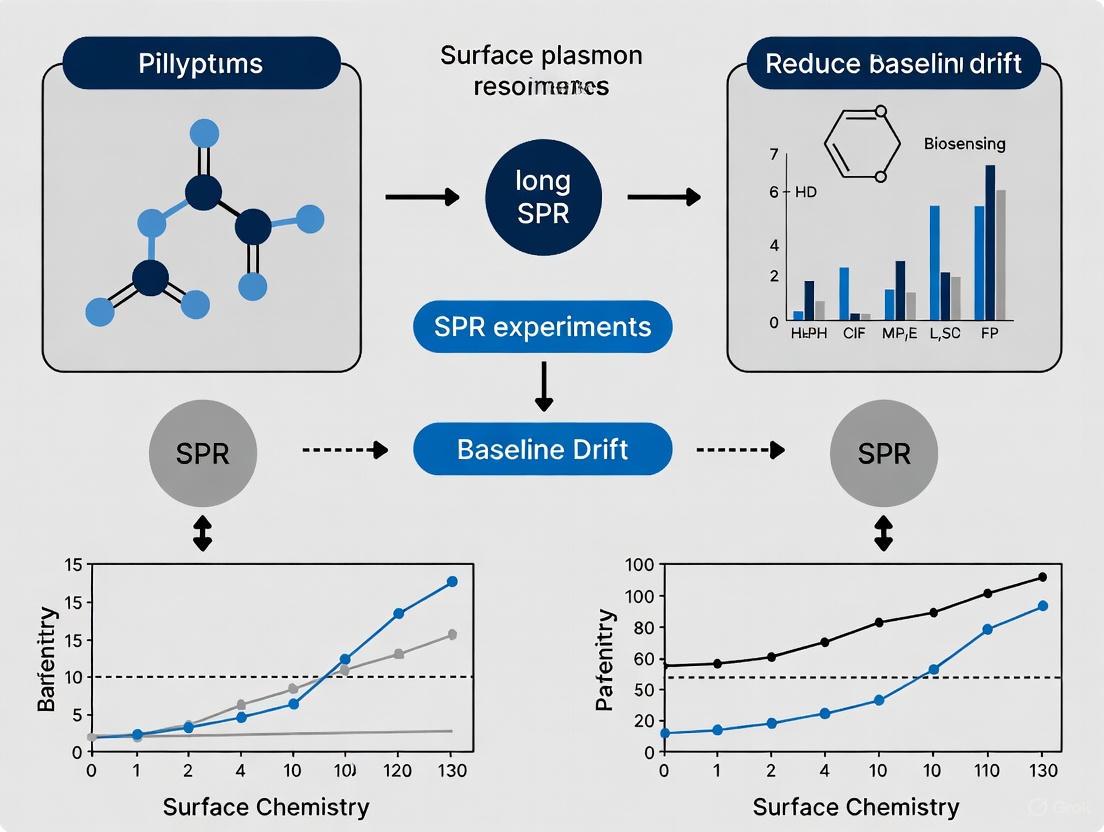
Stable Signals: A Comprehensive Guide to Reducing Baseline Drift in Long SPR Experiments
This article provides researchers, scientists, and drug development professionals with a complete framework for managing baseline drift in extended Surface Plasmon Resonance (SPR) studies.
Stable Signals: A Comprehensive Guide to Reducing Baseline Drift in Long SPR Experiments
Abstract
This article provides researchers, scientists, and drug development professionals with a complete framework for managing baseline drift in extended Surface Plasmon Resonance (SPR) studies. Covering both foundational principles and advanced applications, it details the root causes of instability—from surface equilibration and buffer effects to instrumental factors. The content offers a systematic troubleshooting workflow and proven optimization strategies, including proper buffer hygiene, surface preconditioning, and advanced referencing techniques. Furthermore, it explores next-generation sensor architectures and algorithmic approaches designed to inherently minimize drift, empowering scientists to achieve the high-quality, reproducible data essential for reliable kinetic and affinity analysis in long-duration experiments.
Understanding the Root Causes of SPR Baseline Drift
Defining Baseline Drift and Its Impact on Data Integrity in Kinetic Analysis
FAQs: Understanding Baseline Drift
What is baseline drift?
Baseline drift is a gradual, one-directional change in the background signal of an analytical instrument while only the mobile phase or running buffer is flowing, without any sample injection. In an ideal scenario, the baseline remains stable at a constant steady-state level, but in practice, it can slowly rise or fall over time, from minutes to hours. [1]
Why is a stable baseline critical for reliable kinetic analysis in SPR?
Kinetic analysis requires measuring small changes in response units (RU) over time to determine association and dissociation rates. Baseline drift distorts the sensorgram's starting point, leading to incorrect calculation of these kinetic parameters. A drifting baseline makes it difficult to distinguish true binding events from background noise, compromising data integrity and the accuracy of affinity measurements (Ka/Kd) and rate constants (kon/koff). For interactions with slow dissociation rates, even minor drift can significantly impact the calculated off-rate. [2] [3]
What are the most common causes of baseline drift in long SPR experiments?
The following table summarizes the primary causes and their mechanisms:
| Cause | Mechanism & Impact |
|---|---|
| Improper System Equilibration | Sensor surfaces rehydrate and wash out immobilization chemicals, causing signal drift until fully equilibrated with the flow buffer. [2] |
| Temperature Fluctuations | Changes in lab temperature affect the detector, mobile phase, and sensor surface, causing expansion/contraction and changes in reaction rates, leading to drift. [1] |
| Buffer-Related Issues | Buffer contamination, degradation, or improper degassing causes shifting background absorbance. Changing buffers without thorough priming causes mixing and waviness. [2] [4] |
| Sensor Surface Issues | Residual sample components eluting slowly, leaching from column packing materials, or non-specific binding to the surface can cause a gradual signal change. [1] |
Troubleshooting Guides
My baseline is drifting continuously. What should I do?
Follow this systematic troubleshooting workflow to identify and resolve the root cause.
My baseline is stable at the start but drifts after multiple injection cycles. How can I fix this?
This issue is common in long experiments. The following solutions target cycle-specific drift:
- Optimize Regeneration: Inefficient regeneration can leave residual analyte on the surface, causing a buildup that shifts the baseline over cycles. Optimize your regeneration conditions (e.g., pH, ionic strength, buffer composition) to completely remove bound analyte without damaging the ligand. [5] [6]
- Incorporate Blank Injections: Regularly space blank (buffer alone) injections throughout your experimental method. It is recommended to have one blank cycle for every five to six analyte cycles. These blanks are essential for performing double referencing, which compensates for drift and bulk effects during data analysis. [2]
- Switch to Single-Cycle Kinetics (SCK): For surfaces that are difficult to regenerate or where regeneration inactivates the ligand, consider the SCK method. SCK involves sequential injections of increasing analyte concentrations without regeneration between them, followed by a single long dissociation phase. This minimizes surface damage and reduces drift associated with repeated regeneration steps. [3]
- Ensure Sample Purity: Impurities in your analyte sample can accumulate on the sensor surface over multiple cycles, leading to a rising baseline. Ensure thorough purification of your samples before the experiment. [6]
Essential Protocols for Drift Reduction
Protocol 1: Systematic Buffer Preparation and System Equilibration
A rigorous start-up protocol is the most effective defense against drift. [2]
Methodology:
- Fresh Buffer Preparation: Prepare running buffer daily. Filter through a 0.22 µM filter and degas thoroughly. Do not add fresh buffer to old stock. [2]
- System Priming: After a buffer change, prime the system multiple times to fully replace the liquid in the pumps and tubing. [2]
- Initial Equilibration: Flow running buffer at the experimental flow rate until a stable baseline is obtained. This can take 5-30 minutes, or sometimes even overnight for new or heavily used sensor chips. [2] [7]
- Start-Up Cycles: Program at least three start-up cycles into your experimental method. These cycles should be identical to your analyte cycles but inject only running buffer. If regeneration is used, include it. Do not use these cycles for data analysis. [2]
Protocol 2: Double Referencing for Data Correction
Double referencing is a data processing technique that mathematically corrects for residual drift and bulk refractive index effects. [2]
Methodology:
- Reference Channel Subtraction: First, subtract the signal from the reference flow channel (which should have a surface as similar as possible to the active surface but without the ligand) from the active channel signal. This compensates for the majority of the bulk effect and some drift.
- Blank Subtraction: Second, subtract the response from the blank injections (running buffer) from the analyte injection responses. This compensates for differences between the reference and active channels and further corrects for drift. The blanks spaced throughout the experiment allow for tracking and subtracting drift over time. [2]
The Scientist's Toolkit: Research Reagent Solutions
| Item | Function & Rationale |
|---|---|
| 0.22 µM Filters | Removes particulate matter and microbes from buffers to prevent clogging and contamination, a common source of drift and spikes. [2] |
| High-Purity Water & Solvents | Using the highest grade available minimizes UV-absorbing impurities that contribute to baseline rise and noise. A case study showed that switching methanol brands resolved recurrent sensitivity loss and drift. [1] |
| Degassing Equipment | Inline degassers or helium sparging remove dissolved air from the mobile phase, preventing bubble formation in the flow cell which causes sudden spikes and drift. [4] |
| Detergents (e.g., Tween-20) | Added to the running buffer after degassing to reduce non-specific binding to the sensor chip and tubing. Reduces baseline drift caused by slow accumulation of contaminants. [2] [6] |
| Appropriate Sensor Chips | Selecting the correct chip (e.g., CM5 for amine coupling, NTA for His-tagged capture) ensures stable ligand immobilization and minimizes surface-induced drift. [6] |
| Effective Regeneration Solutions | Solutions like glycine-HCl or NaOH are used to clean the sensor surface between cycles without damaging the ligand. Proper selection is key to preventing carryover and drift over multiple cycles. [5] |
The tables below summarize key metrics and thresholds related to baseline performance.
Table 1: Acceptable Operational Standards for Baseline Stability
| Parameter | Target Value / Guideline | Application Note |
|---|---|---|
| Overall Noise Level | < 1 Response Unit (RU) | Measured after system equilibration with buffer injections. [2] |
| Bulk Shift Compensation | < 10 RU | Low shifts are easily compensated by the reference surface; avoid larger shifts. [7] |
| Start-Up Cycles | Minimum of 3 cycles | Recommended to prime the surface and stabilize the system before data collection. [2] |
| Blank Injection Frequency | 1 per 5-6 analyte cycles | Provides sufficient data points for effective double referencing against drift. [2] |
Table 2: Common Drift Scenarios and Corrective Actions
| Drift Scenario | Most Likely Cause | Immediate Action |
|---|---|---|
| Continuous drift after docking chip | Surface not equilibrated | Continue flowing buffer; can take 30 min to several hours for full hydration. [2] |
| Drift after buffer change | System not adequately primed | Prime system at least 2-3 times with the new buffer. [2] |
| Drift correlated with room temperature | Uncontrolled lab environment | Stabilize room temp 2+ hours prior; use water bath for mobile phase bottles. [1] |
| Drift increasing over many cycles | Inefficient regeneration or sample impurities | Optimize regeneration solution; include regular blank injections and washes. [2] [5] |
FAQs on SPR System Equilibration
1. What is baseline drift and why is it a problem in SPR experiments? Baseline drift is an unstable or gradually shifting signal when no analyte is present. It is a problem because it makes analyzing sensorgrams difficult and can lead to erroneous results, wasting valuable experimental time and resources. A stable baseline is the foundation for accurate kinetic and affinity measurements [2] [5].
2. What are the primary causes of baseline drift? The main causes are:
- Non-optimal surface equilibration: This includes rehydration of a newly docked sensor chip and wash-out of chemicals from the immobilization procedure [2].
- Improper buffer handling: Using old, contaminated, or poorly degassed buffers can introduce drift and spikes [2] [5].
- Systemic issues: Changes in running buffer without sufficient priming, or start-up effects after a flow standstill can cause waviness and drift [2].
- Regeneration solutions: These can cause different drift rates on reference and active surfaces [2].
3. How can I prevent drift after immobilizing a ligand or docking a new chip? It is often necessary to run the running buffer overnight to fully equilibrate the sensor surface. Drift after immobilization is due to the rehydration of the surface and the adjustment of the bound ligand to the flow buffer. Allowing for an extended buffer flow ensures complete stabilization [2] [7].
4. What is the best practice for preparing and using running buffer?
- Prepare fresh buffers daily and filter them through a 0.22 µM filter [2].
- Degas the buffer before use to prevent air spikes [2] [5].
- Store buffers in clean, sterile bottles at room temperature. Avoid storage at 4°C as cold buffers contain more dissolved air [2].
- Do not add fresh buffer to old buffer to avoid contamination [2].
- Add detergents after the degassing step to prevent foam from forming [2].
5. My baseline is noisy and fluctuating. What should I check?
- Instrument environment: Ensure the instrument is in a stable environment with minimal temperature fluctuations and vibrations [5].
- Buffer quality: Use a clean, filtered buffer solution [5].
- Electrical noise: Confirm the instrument is properly grounded [5].
- Surface contamination: Check for contamination on the sensor surface and clean or regenerate it if necessary [5].
Troubleshooting Guide: Baseline Drift
| Observation | Possible Cause | Recommended Solution |
|---|---|---|
| Continuous drift after chip docking | Sensor surface rehydration | Flow running buffer for an extended period (e.g., overnight) for full equilibration [2]. |
| Drift & waviness after buffer change | System not equilibrated with new buffer | Prime the system several times after each buffer change and wait for a stable baseline before starting experiments [2]. |
| Drift after regeneration | Regeneration solution inducing matrix effects | Use milder regeneration conditions and extend the post-regeneration equilibration/wash time. Ensure system is fully re-equilibrated before the next injection [2] [8]. |
| Unstable or noisy baseline | Poor buffer quality; air bubbles; temperature fluctuations | Use fresh, filtered, and degassed buffer. Check for leaks in the fluidic system. Place instrument in a stable environment [2] [5]. |
| Start-up drift after flow is initiated | Sensor surface susceptibility to flow changes | Wait for a stable baseline (5-30 min) before analyte injection. Incorporate start-up cycles with buffer injections [2]. |
Experimental Protocols for System Equilibration
Protocol 1: Standard System and Surface Equilibration
This protocol is designed to stabilize the SPR instrument and sensor surface before critical experiments.
Key Reagent Solutions:
| Reagent | Function in Equilibration |
|---|---|
| Fresh Running Buffer | Maintains a consistent solvent environment; prevents contamination [2]. |
| 0.5 M NaCl Solution | Used in system diagnostics to check for carry-over and sample dispersion [7]. |
- Buffer Preparation: Prepare 2 liters of fresh running buffer. Filter through a 0.22 µM filter and degas. Add appropriate detergents after degassing [2].
- System Priming: Prime the fluidic system several times with the new running buffer to completely replace the old buffer [2].
- Initial Stabilization: Flow running buffer at your experimental flow rate until the baseline is stable. For new or recently immobilized chips, this may require an extended period, even overnight [2] [7].
- Start-up Cycles: Program at least three start-up cycles into your method. These are identical to analyte cycles but inject running buffer instead of sample. If regeneration is used, include the regeneration step. Do not use these cycles in your final analysis [2].
- System Diagnostic Check: Inject a 0.5 M NaCl solution followed by a running buffer injection. The NaCl injection should show a sharp rise and fall with a flat steady-state. The buffer injection should be almost flat, confirming the system is clean and well-washed [7].
Protocol 2: Diagnostic Check for Noise and Drift Levels
This protocol assesses the instrument's stability and noise level after equilibration.
- Equilibrate System: Follow the steps in Protocol 1 to minimize drift [2] [8].
- Inject Running Buffer: Perform several injections of running buffer only [2] [8].
- Observe Baseline Response: Monitor the average baseline response and the shape of the curves. The overall noise level should be very low (e.g., < 1 RU) [2] [8].
- Check for Issues: If there is significant drift or the curves are not level shortly after injection starts, further equilibration or system cleaning is required [8].
System Equilibration Workflow
The following diagram illustrates the logical workflow for achieving a stable SPR system, integrating the key protocols and checks described above.
In Surface Plasmon Resonance (SPR) experiments, a stable baseline is the foundation for obtaining reliable kinetic and affinity data. Baseline drift—a gradual shift in the signal when no analyte is binding—is a common challenge that can compromise data integrity, particularly in long-term studies. This instability is frequently traced back to a single, often-overlooked factor: buffer hygiene. This guide details how proper buffer preparation, including degassing, filtration, and fresh preparation, is a critical preventative measure for ensuring baseline stability and data quality.
FAQs on Buffer Hygiene and Baseline Stability
What is buffer hygiene and why is it critical for SPR?
Buffer hygiene refers to the set of practices used to prepare and handle the running buffers in an SPR experiment to ensure they are free from chemical contaminants, particulate matter, and dissolved air. It is critical because the SPR signal is exquisitely sensitive to changes in the refractive index at the sensor surface. Contaminants or air bubbles in the buffer can cause significant baseline drift, noise, and spikes, making it difficult to distinguish true binding events from experimental artifacts [2] [9].
How does dissolved air in buffers cause instability?
Dissolved air in buffers is a primary cause of instability. When buffer stored at 4°C warms to room temperature, dissolved air can come out of solution, forming microscopic bubbles. These bubbles create sudden, sharp spikes in the sensorgram when they pass through the microfluidic system [2]. Furthermore, the presence of dissolved gas can lead to a gradual baseline drift as the system struggles to equilibrate.
What are the consequences of using old or contaminated buffer?
Using old or contaminated buffer introduces multiple risks:
- Chemical Degradation: Buffer components can break down or support microbial growth over time, leading to a change in composition [2].
- Non-Specific Binding: Particulates or contaminants can adsorb non-specifically to the sensor chip surface, gradually changing its properties and causing drift [6].
- System Clogging: Particulate matter can clog the instrument's delicate microfluidic channels. It is considered bad practice to add fresh buffer to old buffer, as this can introduce contaminants and exacerbate these issues [2].
How does proper buffer hygiene prevent baseline drift in long experiments?
For long experiments, system equilibration is paramount. Proper buffer hygiene promotes a stable baseline by:
- Eliminating Bubble-Induced Spikes: Degassing prevents the formation of air spikes [2] [5].
- Ensuring Chemical Consistency: Fresh preparation and filtration maintain consistent buffer composition, preventing slow drift caused by contaminants or microbial metabolites [2].
- Facilitating Surface Equilibration: A clean, consistent buffer allows the sensor surface to fully hydrate and equilibrate, which is especially important after docking a new chip or immobilizing a ligand [2] [7].
Experimental Protocols for Optimal Buffer Preparation
Protocol 1: Standard Procedure for Fresh Buffer Preparation
This protocol is designed to prepare 2 liters of clean, degassed running buffer, suitable for most SPR experiments [2].
Materials Needed:
- High-purity water (e.g., 18 MΩ resistivity)
- Analytical grade buffer salts and reagents
- 0.22 µm bottle-top or vacuum filtration unit
- Clean (preferably sterile) storage bottles
- Degassing unit (e.g., sonicator, in-line degasser, or vacuum degassing)
Step-by-Step Method:
- Preparation: Dissolve all buffer components in high-purity water to the desired concentration. It is advised that the running buffer matches the analyte storage buffer to minimize refractive index changes [10].
- Filtration: Filter the entire volume of buffer through a 0.22 µm filter. This step removes particulate matter and sterilizes the solution, preventing microbial contamination [2] [10].
- Storage: Transfer the filtered buffer to clean, sterile bottles. Store at room temperature. Avoid storage at 4°C, as cold liquid holds more dissolved air, which will form bubbles upon warming [2].
- Aliquot and Degas: Just before use, transfer a working aliquot to a new clean bottle and degas it. If you are using detergents (e.g., Tween-20), add them after filtering and degassing to prevent foam formation [2] [6].
- System Priming: Prime the SPR instrument's fluidic system several times with the new, degassed buffer before starting the experiment to ensure complete equilibration [2].
Protocol 2: Validating Buffer Hygiene and System Equilibration
This method uses a simple injection test to diagnose issues related to buffer quality or system equilibration [7].
Materials Needed:
- Freshly prepared, degassed running buffer (from Protocol 1)
- 0.5 M Sodium Chloride (NaCl) solution, freshly prepared
Step-by-Step Method:
- System Setup: Dock a sensor chip and prime the system with your running buffer.
- Baseline Monitoring: Flow the running buffer and monitor the baseline until it appears stable.
- NaCl Injection: Program a method to inject the 0.5 M NaCl solution.
- Expected Result: A sharp rise and fall in the response signal, with a flat steady-state region during the injection [7].
- Problem Indication: A slow rise/fall or a non-flat steady state suggests issues with sample dispersion or mixing in the fluidic path.
- Buffer Injection: Program a method to inject the running buffer itself.
- Expected Result: An almost flat line, indicating no refractive index change and excellent needle washing [7].
- Problem Indication: Any significant signal change during a buffer injection indicates carry-over from previous samples or insufficient washing.
Troubleshooting Guide: Buffer-Related Baseline Issues
| Problem | Possible Cause | Recommended Solution |
|---|---|---|
| Frequent sharp spikes in the sensorgram | Air bubbles in the buffer or fluidic system [2] [5] | Ensure buffers are freshly degassed before use. Check for leaks in the fluidic system. Prime the system thoroughly [5]. |
| Continuous baseline drift (up or down) | System not equilibrated; Sensor surface not hydrated; Contaminated buffer [2] [6] | Prepare fresh buffer. Flow running buffer overnight to equilibrate the surface. Add "start-up cycles" with buffer injections to stabilize the system [2]. |
| Large bulk shift at injection start/end | Mismatch between running buffer and analyte buffer [7] | Dialyze or prepare the analyte in the running buffer. Use a desalting column to exchange buffers. |
| High noise level | Particulate matter in buffer; Temperature fluctuations [5] | Filter buffer through a 0.22 µm filter. Ensure the instrument is in a stable environment, free from vibrations. |
| Drift after buffer change | Incomplete system priming; Buffer mixing in pump [2] | Always prime the system after a buffer change. Flow the new buffer for sufficient time to completely purge the old buffer. |
The Scientist's Toolkit: Essential Reagent Solutions
| Reagent / Material | Function in Buffer Hygiene | Key Considerations |
|---|---|---|
| 0.22 µm Filter | Removes particulate matter and sterilizes the buffer to prevent clogging and non-specific binding [2] [10]. | Use a membrane compatible with your buffer chemistry. Sterile, disposable filters are ideal. |
| Degassing Apparatus | Removes dissolved air to prevent bubble formation in the microfluidics, which causes spikes and drift [2] [5]. | Can be a sonication bath, vacuum degasser, or an in-line degasser on the instrument. |
| Clean Storage Bottles | Prevents introduction of chemical or biological contaminants during buffer storage [2]. | Use sterile, dedicated bottles. Avoid topping off old buffer with new. |
| Detergents (e.g., Tween-20) | Added to the buffer to reduce non-specific binding of analytes to the sensor chip and fluidic walls [6]. | Always add after filtering and degassing to prevent excessive foam formation [2]. |
| High-Purity Water | Serves as the solvent for all buffers; ensures no interference from ionic or organic impurities [10]. | Use ultrapure water (18 MΩ resistivity) [10]. |
Buffer Preparation and Stability Workflow
The following diagram illustrates the logical workflow for preparing SPR running buffers and the consequences of each step on system stability.
Key Takeaways
Meticulous buffer hygiene is not a minor preparatory step but a fundamental requirement for robust SPR data. The core principles are simple yet must be rigorously applied: prepare fresh buffers daily, filter through a 0.22 µm membrane, and degas immediately before use. By integrating these protocols and validation tests into your standard workflow, you can effectively prevent the common instabilities of baseline drift, spikes, and noise, thereby ensuring the integrity of your biomolecular interaction data in even the longest experiments.
Frequently Asked Questions (FAQs)
FAQ 1: Why does the baseline often drift significantly immediately after I start the fluidic system or dock a new sensor chip?
This is a common phenomenon known as start-up drift and is primarily caused by system equilibration. When a sensor chip is newly docked or the flow is started after a standstill, several processes occur: the sensor surface rehydrates, chemicals from immobilization procedures are washed out, and the immobilized ligand adjusts to the flow buffer. This creates a period of instability that can last from 5 to 30 minutes before the baseline levels out. The exact duration depends on the sensor type and the properties of the immobilized ligand [2].
FAQ 2: Are certain types of sensor chips more prone to specific drift profiles?
Yes, different sensor chips exhibit distinct susceptibility to drift based on their surface chemistry and structure. For instance, negatively charged carboxylated surfaces (e.g., CM5 chips) can experience drift with positively charged analytes due to non-specific electrostatic interactions. Hydrophobic surfaces may drift with certain protein samples due to non-specific hydrophobic binding. Furthermore, capture-based chips (e.g., NTA for His-tagged proteins, SA for biotinylated ligands) can be susceptible to drift if the capture ligand itself is unstable or if the regeneration step is incomplete, leading to gradual ligand loss [11] [6].
FAQ 3: What is the most critical step to minimize drift before starting my experiment?
The single most critical step is thorough system equilibration. This involves flowing running buffer over the sensor surface until a stable baseline is achieved. For a new chip or after a buffer change, this can require priming the system several times and sometimes even flowing buffer overnight to fully equilibrate the surface. Always confirm a stable, low-noise baseline before injecting your first sample [2] [5].
FAQ 4: How can I distinguish between system-related drift and a true, very slow binding event?
True binding events typically show a concentration-dependent response. To distinguish drift from binding, include blank injections (buffer alone) and analyze the response on a reference surface. Drift will manifest as a similar signal change on both the active and reference surfaces, whereas specific binding will only (or primarily) occur on the active surface. Furthermore, a slow binding event will usually reach a plateau during the association phase, while drift often appears as a continuous, linear change [2] [11].
Troubleshooting Guide: Baseline Drift
Problem: Significant Baseline Drift Upon Flow Start-Up
Description A continuous rise or fall in the baseline signal is observed immediately after initiating fluid flow or docking a new sensor chip.
| Probable Cause | Diagnostic Steps | Recommended Solution |
|---|---|---|
| System not equilibrated [2] | Monitor baseline for 5-30 minutes after flow start. | Flow running buffer until baseline stabilizes (≥ 5 min). Prime system after any buffer change [2]. |
| Air bubbles in fluidic system [5] | Check for sudden spikes or irregular noise accompanying drift. | Ensure buffer is properly degassed. Check for and eliminate leaks in the fluidic path [5]. |
| Sensor surface rehydration [2] | Drift occurs after docking a new, dry sensor chip. | Follow manufacturer's chip priming procedure. Allow extended buffer flow for rehydration [2]. |
| Buffer mismatch or contamination [2] [5] | Check if drift persists after thorough priming with fresh buffer. | Prepare fresh, filtered (0.22 µm), and degassed buffer daily. Avoid adding fresh buffer to old stock [2]. |
Problem: Chip-Specific or Sustained Drift During Experiment
Description A persistent drift is observed throughout the experiment, which may vary in intensity depending on the sensor chip type or immobilized ligand.
| Probable Cause | Diagnostic Steps | Recommended Solution |
|---|---|---|
| Non-specific binding (NSB) [12] [11] | Inject a high analyte concentration over a bare reference surface. A significant signal indicates NSB. | Add blocking agents (e.g., 1% BSA), non-ionic surfactants (e.g., 0.05% Tween 20), or increase salt concentration in the running buffer [11]. |
| Incomplete regeneration [11] | Observe if the baseline does not return to the pre-injection level after regeneration. | Optimize regeneration solution (e.g., glycine pH 2.0, NaOH, high salt). Use short, fast-flow regeneration pulses [11]. |
| Unstable ligand immobilization [2] [13] | Drift is more pronounced on the active surface vs. reference. Check ligand activity with a positive control. | Use a milder immobilization chemistry. Ensure ligand purity and stability. Avoid harsh regeneration conditions that damage the ligand [13]. |
| Inappropriate sensor chip chemistry [11] [6] | Drift is consistently high with a specific chip type and analyte pair. | Switch sensor chip to one with a more compatible surface chemistry (e.g., neutral hydrogel to reduce electrostatic NSB) [11]. |
Experimental Protocols for Drift Mitigation
Protocol for System Equilibration and Start-Up
Purpose: To minimize initial baseline drift caused by fluidic and surface instability at the start of an experiment [2].
Materials:
- Fresh running buffer (filtered through 0.22 µm and degassed)
- Docked sensor chip
Method:
- Prime the System: After docking the chip and changing the buffer, perform a minimum of two prime procedures using the instrument's software to flush the entire fluidic path with the new buffer.
- Initial Stabilization: Initiate a constant flow of running buffer at the experimental flow rate. Allow the system to stabilize for a minimum of 5 minutes, or until the baseline drift falls below an acceptable threshold (e.g., < 5 RU/min).
- Execute Start-Up Cycles: Program and run at least three "start-up" or "dummy" cycles. These should be identical to your experimental cycles but inject running buffer instead of analyte. If your method includes a regeneration step, include it in these cycles.
- Verify Stability: After the start-up cycles, confirm that the baseline is stable. The baseline noise level should be low (e.g., < 1 RU) [2]. Do not use data from start-up cycles for analysis.
- Begin Experiment: Once a stable baseline is confirmed, commence the experimental cycles with analyte injections.
Protocol for Diagnostic Flow Rate Test
Purpose: To determine if observed binding kinetics are distorted by mass transport limitations, which can manifest as a specific type of drift in the association phase [11].
Materials:
- A single concentration of analyte (at a mid-range level, e.g., near the expected KD)
- Immobilized ligand surface
Method:
- Design the Method: Create a method that injects the same analyte concentration over the ligand surface multiple times, but vary the flow rate for each injection (e.g., 10, 30, 50, 100 µL/min). Use a sufficiently long dissociation phase.
- Run the Experiment: Execute the method, ensuring the surface is fully regenerated between injections.
- Analyze the Sensorgrams: Plot the response versus time for the different flow rates.
- Interpretation: If the observed association rate (ka) increases with increasing flow rate, it indicates that the binding is limited by the diffusion of the analyte to the surface (mass transport limitation), not just by the intrinsic kinetics. A lack of flow rate dependence suggests mass transport is not a significant issue [11].
Diagram 1: Diagnostic flowchart for baseline drift.
Research Reagent Solutions
The following table lists key reagents and materials essential for diagnosing and mitigating baseline drift in SPR experiments.
| Reagent/Material | Function in Drift Mitigation | Key Considerations |
|---|---|---|
| Fresh, Filtered (0.22 µm), Degassed Buffer [2] | Removes dissolved air (prevents bubbles), particles, and microbial contaminants that cause spikes and drift. | Prepare fresh daily. Do not top up old buffers. Filter before degassing. Add detergents after degassing to prevent foam [2]. |
| Bovine Serum Albumin (BSA) [11] | A blocking agent used at ~1% concentration to coat non-specific binding sites on the sensor surface, reducing charge- and hydrophobic-based NSB. | Use during analyte runs only. Do not use during ligand immobilization, as it will bind to the surface [11]. |
| Non-Ionic Surfactant (e.g., Tween 20) [11] | Disrupts hydrophobic interactions that lead to NSB. Typical concentration is 0.005%-0.05%. | Use mild, high-purity detergents to avoid damaging the instrument or ligand. |
| High-Salt Solutions (e.g., 1-2 M NaCl) [11] | Shields electrostatic charges on the sensor surface and analyte, reducing non-specific ionic binding. | The required concentration is analyte-dependent. Test different levels to find the optimum without disrupting the specific interaction. |
| Regeneration Buffers (e.g., 10-100 mM Glycine pH 2.0-3.0, 10-50 mM NaOH, high salt) [11] | Removes bound analyte completely between cycles without damaging the ligand, preventing carryover and baseline rise. | Start with the mildest option and increase stringency. Always include a positive control to verify ligand activity remains after regeneration [11]. |
| Reference Sensor Chip Surface [2] [13] | A surface without the specific ligand, used to measure and subtract signals from NSB and bulk refractive index changes (double referencing). | Should be as chemically and structurally similar as possible to the active surface to provide an accurate reference [2]. |
Diagram 2: Workflow for a low-drift SPR experiment.
Frequently Asked Questions (FAQs)
Q1: Why are SPR experiments so sensitive to minor temperature changes? Temperature fluctuations cause changes in the refractive index (RI) of the buffer and the optical components of the sensor chip itself. The SPR signal is exquisitely sensitive to RI changes at the sensor surface. Even small temperature variations can induce a baseline drift or shift the resonance signal, mimicking a binding event or obscuring a real one [14] [15]. The gold film's plasma frequency, a critical property, is also temperature-dependent, directly contributing to the resonant wavelength shift [16].
Q2: How do pressure changes affect my SPR baseline? Sudden pressure changes, often from air bubbles in the microfluidic system or irregular flow from pump refilling, can cause instant spikes or a noisy, drifting baseline [17] [5]. These events disrupt the consistent flow and liquid composition over the sensor surface.
Q3: What are the most common instrumental signs of temperature and pressure issues? The table below summarizes the key symptoms to watch for.
Table: Common Symptoms of Temperature and Pressure Issues in SPR
| Symptom | Description | Likely Cause(s) |
|---|---|---|
| Baseline Drift [7] [5] | A gradual, continuous rise or fall of the baseline signal before analyte injection. | Slow thermal equilibration of the instrument/sample; temperature fluctuation in the room; undegassed buffer [6] [5]. |
| Signal Spikes [17] | Sudden, sharp increases or decreases in the signal. | Air bubbles passing through the flow cell; pump refill cycles; carry-over from previous injections [17]. |
| Bulk Refractive Index Shifts [17] | A large, instantaneous signal jump at the start and end of an injection, with a flat "steady-state" level during injection. | A mismatch between the running buffer and the analyte buffer (e.g., different salt concentration, DMSO content, or temperature) [17]. |
Q4: How can I minimize the impact of temperature fluctuations?
- Equilibration: Allow the instrument and all solutions to thermally equilibrate completely before starting the experiment. This may require running buffer overnight [7].
- Buffer Handling: Always degas your buffers to prevent bubble formation, especially if they have been stored cold [17] [5].
- Environmental Control: Operate the instrument in a temperature-stable environment, away from drafts, direct sunlight, or heating/cooling vents [5].
Q5: What steps can I take to prevent pressure-related problems?
- Degas Buffers: This is the most critical step for preventing air bubbles [17] [5].
- Avoid Bubbles in Samples: Centrifuge samples before loading them into vials to remove any microscopic bubbles.
- System Maintenance: Perform routine instrument priming and flushing as recommended by the manufacturer to clear the fluidic system of contaminants and bubbles [5].
Troubleshooting Guides
Guide 1: Troubleshooting Temperature-Induced Baseline Drift
Problem: The baseline signal continuously drifts upward or downward.
Investigation and Resolution Protocol:
- Confirm Equilibration: Ensure the instrument and all buffers have reached a stable operating temperature. If the system was recently started or the buffer was recently replaced, allow at least 30-60 minutes for stabilization. For new surfaces, overnight equilibration may be necessary [7].
- Check Buffer Quality: Prepare a fresh batch of running buffer, filter (0.22 µm) and degas it thoroughly immediately before use. Do not top off old buffer with new buffer [17].
- Inspect for Environmental Drafts: Verify that the instrument is not in the path of an air conditioning vent or other source of temperature fluctuation.
- Verify System Calibration: Consult your instrument manual to perform a system calibration check if drift persists [5].
Guide 2: Troubleshooting Pressure Spikes and Air Bubbles
Problem: Sudden, sharp spikes appear in the sensorgram.
Investigation and Resolution Protocol:
- Identify Spike Source:
- Pump Refill Spikes: Check if spikes correlate with the instrument's pump refill cycle. These are often periodic [17].
- Air Bubbles: Bubbles typically cause random, large spikes. Visually inspect the fluidic path and sensor surface if possible.
- Degas Solutions: Thoroughly degas all buffers and samples. If your instrument has an in-line degasser, ensure it is functioning correctly [17].
- Purge the System: Run a high flow rate (e.g., 50-100 µL/min) for a few minutes to flush any existing bubbles out of the flow cells [17].
- Review Injection Method:
Guide 3: Troubleshooting Bulk Refractive Index Shifts
Problem: A large, square-shaped signal jump occurs at the beginning and end of an injection.
Investigation and Resolution Protocol:
- Match Buffer Compositions: The most common cause is a difference between the running buffer and the analyte buffer. Dialyze your analyte into the running buffer or use a size-exclusion column for buffer exchange [17].
- Handle Additives with Care: If using additives like DMSO, ensure the DMSO concentration is identical in the running buffer and the analyte sample. Evaporation from sample vials can change concentration, so cap them securely [17].
- Temperature Matching: Ensure the analyte sample is at the same temperature as the running buffer when injected. A cold sample injected into a warm system will cause a significant bulk shift.
- Use Instrument Features: If available, use features like real-time bulk refractive index compensation (e.g., PureKinetics on BioNavis instruments) to correct for these shifts [17].
Quantitative Data on Temperature Sensitivity
The following table summarizes key experimental findings on the intrinsic temperature sensitivity of SPR systems, which underpins the need for careful control.
Table: Experimental Findings on SPR Temperature Sensitivity
| Study Focus | Key Finding | Experimental Context |
|---|---|---|
| Contribution of Gold Film [16] | The temperature-dependent change in the gold film's plasma frequency contributed to 19.6% of the total SPR wavelength shift. | A PCS optical fiber SPR sensor in ethanol, with temperature increase from 0°C to 50°C [16]. |
| Overall Sensor Sensitivity [14] | Instrumental sensitivity (Sθ) in angular interrogation mode deteriorated from 120°/RIU to 30°/RIU as temperature dropped below 300 K (~27°C). | A commercial SPR (SPREETA) device at the gold-water interface, using angular interrogation [14]. |
| Impact of Interrogation Mode [14] | The effect of higher device temperatures (300K |
Theoretical evaluation of SPR performance using a BK7 glass prism, gold film, and aqueous analyte [14]. |
Experimental Protocols
Protocol 1: System Equilibration and Baseline Stability Test
This protocol is designed to verify that your SPR system is thermally stable and ready for a long-term experiment.
Objective: To achieve a stable baseline with minimal drift (< 10 RU over 30 minutes). Materials:
- Freshly prepared, filtered (0.22 µm), and degassed running buffer.
- A clean, unused or properly regenerated sensor chip.
Methodology:
- Install the sensor chip and prime the fluidic system with the degassed running buffer according to the manufacturer's instructions.
- Set the instrument to continuous flow at your experimental flow rate (e.g., 30 µL/min) and temperature.
- Start monitoring the baseline signal and allow the system to equilibrate. A significant initial drift is normal.
- Once the drift slows, continue monitoring for at least 30 minutes. The baseline is considered stable when the drift is minimal and linear [7].
- If the baseline continues to drift significantly, perform several buffer injections and continue equilibration. Persistent drift may indicate a need for more thorough buffer degassing or system cleaning [17].
Protocol 2: Injection System Integrity Test
This protocol checks for issues related to sample dispersion, carry-over, and bulk shifts.
Objective: To verify that the instrument delivers a sharp, consistent sample plug without artifacts. Materials:
- Running buffer.
- High-salt solution (e.g., running buffer + 0.5 M NaCl).
Methodology:
- Prepare a dilution series of the high-salt solution in the running buffer (e.g., 50, 25, 12.5, 0 mM extra NaCl) [17].
- Using a plain gold chip, inject the solutions from low to high concentration in a single-cycle kinetics program. End with an injection of running buffer alone.
- Analyze the sensorgrams:
- The rise and fall of each injection should be sharp and immediate.
- The steady-state response during injection should be flat, indicating no mixing with the running buffer (no sample dispersion) [17].
- The final running buffer injection should show no signal, confirming no carry-over from the high-salt samples [17].
- Any deviation from this ideal behavior indicates a need to optimize the injection routine or wash steps.
The Scientist's Toolkit
Table: Essential Reagents and Materials for Stable SPR Experiments
| Item | Function | Considerations for Stability |
|---|---|---|
| Buffer Components | To provide a stable chemical and ionic environment for biomolecular interactions. | Always filter (0.22 µm) and degas before use. Prepare fresh daily to prevent microbial growth or contamination [17] [5]. |
| Detergent (e.g., Tween-20) | A common additive to reduce non-specific binding to the sensor surface. | Can also help prevent bubble formation. Use at low, consistent concentrations (e.g., 0.005-0.01%) [6]. |
| Blocking Agents (e.g., BSA, Ethanolamine) | To passivate unused active sites on the sensor surface after ligand immobilization. | Reduces non-specific binding, which can be a source of signal drift and noise [6] [5]. |
| Regeneration Solutions | To remove bound analyte from the ligand without damaging it. | An optimized, effective regeneration step is vital for reproducible results and preventing carry-over, which affects baseline stability [5]. |
Diagnostic Workflow Diagram
The following diagram outlines a logical, step-by-step process for diagnosing and resolving baseline instability issues related to instrumental and environmental factors.
Proactive Experimental Design for Drift-Free SPR Assays
Why is buffer optimization critical for Surface Plasmon Resonance (SPR) experiments?
In Surface Plasmon Resonance (SPR), the running buffer is the medium in which molecular interactions occur. A poorly matched buffer can introduce bulk effects (or bulk shifts), which are false signals caused by differences in refractive index between the analyte solution and the running buffer [11]. These artifacts can obscure genuine binding events, complicate data analysis, and reduce the reliability of your kinetic and affinity measurements. Proper buffer optimization, focusing on ionic strength, pH, and additives, is therefore a fundamental step in experimental design to ensure high-quality, publication-ready data.
Troubleshooting Common Buffer-Related Issues
Q: What does a "square-shaped" sensorgram indicate, and how is it resolved? A: A large, square-shaped response at the start and end of an injection is a classic sign of a bulk shift [11]. This occurs when the refractive index of your analyte sample does not match that of your running buffer. To resolve this:
- Match buffer composition: Ensure the running buffer and the buffer used to prepare your analyte dilutions are identical [11].
- Use a reference channel: Always subtract the signal from a reference flow cell to correct for bulk refractive index differences [2] [11].
- Prepare buffers fresh: Always prepare fresh running buffer daily, filter (0.22 µm), and degas it to eliminate air spikes and contamination [2].
Q: How does buffer contribute to baseline drift, and how can it be stabilized? A: Baseline drift is often a sign of a system that is not fully equilibrated, which can be exacerbated by the buffer [2] [7].
- Ensure thorough equilibration: After a buffer change or sensor chip docking, prime the system and flow running buffer until the baseline is stable. For some surfaces, this may require flowing buffer overnight [2] [7].
- Use start-up cycles: Incorporate several "dummy" injections (injecting buffer instead of analyte) at the beginning of your experiment to stabilize the system and sensor surface [2].
- Check for contamination: Use fresh, filtered, and degassed buffers to prevent the introduction of particles or microbes that can cause drift [2] [5].
Q: How can I minimize non-specific binding (NSB) through buffer composition? A: Non-specific binding occurs when analytes interact with the sensor surface or ligand through non-targeted, often charge-based or hydrophobic, interactions [6] [12] [11].
- Adjust pH: A positively charged analyte can interact non-specifically with a negatively charged dextran matrix. Adjusting the buffer pH to your protein's isoelectric point can neutralize these charges [11].
- Increase ionic strength: Adding salt (e.g., NaCl) to your running buffer can shield charge-based interactions [11].
- Add detergents: Incorporating non-ionic surfactants like Tween-20 (e.g., 0.005% P20 in HBS buffers) can disrupt hydrophobic interactions that cause NSB [6] [11].
- Use blocking agents: Adding proteins like Bovine Serum Albumin (BSA) to analyte samples can block non-specific sites [12] [11].
Buffer Composition and Optimization Guidelines
The following table summarizes the role and optimization strategy for key buffer components to minimize bulk effects and other artifacts.
Table 1: Optimization of Key Buffer Components
| Component | Function & Impact | Optimization Strategy |
|---|---|---|
| Ionic Strength | Controls electrostatic interactions. Low ionic strength can increase NSB; very high ionic strength can mask charges and hinder specific binding. | Use a moderate starting concentration (e.g., 150 mM NaCl). Increase to shield charges if NSB is high; decrease to enhance pre-concentration during immobilization [18] [11]. |
| pH | Affects the charge and stability of proteins and the sensor surface. A mismatch can cause NSB and ligand inactivity. | Choose a pH that maintains biological activity. Adjust to the ligand's isoelectric point (pI) to reduce NSB. For immobilization, use a pH 0.5-1.0 unit below the ligand's pI for pre-concentration [18] [11]. |
| Detergents (e.g., Tween-20, P20) | Reduce NSB by disrupting hydrophobic interactions. Can cause foam if added before degassing. | Add after filtering and degassing the buffer to avoid foam formation [2]. Use at low concentrations (e.g., 0.005%-0.05%) [6]. |
| Organic Solvents (e.g., DMSO) | Essential for solubilizing small molecules. Causes significant bulk shifts if mismatched. | Match the DMSO concentration precisely between the running buffer and all analyte samples [19]. Keep the concentration as low as possible (typically ≤1%). |
| Blocking Agents (e.g., BSA) | Occupies non-specific binding sites on the sensor surface. | Add BSA (typically 0.1-1%) to analyte samples during runs only. Do not use during ligand immobilization, as it will coat the surface [11]. |
Optimized Buffer Preparation Workflow
The following diagram illustrates a systematic workflow for preparing and validating an optimized SPR running buffer.
Protocol:
- Define Base Buffer: Select a biologically relevant buffer such as HEPES, PBS, or Tris [19].
- Add Salts: Incorporate salts like NaCl to a moderate ionic strength (e.g., 150 mM) to minimize non-specific electrostatic interactions [11].
- Adjust pH: Titrate to the desired pH using a calibrated pH meter. Ensure the pH is optimal for your ligand-analyte interaction and surface stability [18] [11].
- Filter and Degas: Pass the buffer through a 0.22 µm filter to remove particulates, then degas to prevent air spikes in the microfluidics [2].
- Add Additives: After degassing, add detergents like Tween-20 or other stabilizers to avoid foam formation [2].
- Match Solvent: For small molecule studies, add the correct percentage of organic solvent (e.g., DMSO) to the running buffer to match the analyte solution [19].
- Validate: Perform a buffer injection test. A flat sensorgram response indicates good buffer matching and a clean system [7].
The Scientist's Toolkit: Essential Research Reagents
Table 2: Key Reagents for SPR Buffer Optimization and Troubleshooting
| Reagent | Function | Example Usage & Notes |
|---|---|---|
| HEPES | A common buffering agent for maintaining stable pH. | Used at 10-50 mM concentration in running buffers for protein interactions [19]. Prefered for its stability at room temperature. |
| NaCl | Modifies the ionic strength of the solution to shield charge-based interactions. | Used to reduce non-specific binding; concentrations can be scouted from 0 to 500 mM [11]. |
| Tween-20 / P20 | Non-ionic surfactant that reduces hydrophobic non-specific binding. | Typically used at 0.005%-0.05% (v/v). Must be added after degassing to prevent foam [2] [6]. |
| DMSO | Organic solvent for solubilizing small molecule analytes. | Concentration must be matched exactly (e.g., 0.5-1%) in running buffer and all analyte samples to prevent major bulk shifts [19]. |
| BSA (Bovine Serum Albumin) | Blocking agent to occupy non-specific binding sites. | Added to analyte samples at ~1% concentration to reduce NSB. Avoid using during ligand immobilization [11]. |
| Glycine | Used in regeneration buffers to remove bound analyte. | A low-pH (pH 2.0-3.0) glycine solution is a common, mild regeneration scouting solution [19] [12]. |
| NaOH | Used in regeneration buffers to remove bound analyte. | A common, harsher regeneration scouting solution (e.g., 10-50 mM) [12]. |
| Sodium Acetate | Low pH immobilization buffer. | Used for pre-concentration and covalent coupling of ligands to carboxymethylated dextran chips (e.g., CM5) [18]. |
Keywords: Surface Plasmon Resonance, SPR, Baseline Drift, Pre-conditioning, Overnight Equilibration, Start-Up Cycles, Surface Equilibration
Why is my baseline unstable at the beginning of an SPR experiment, and how can I stabilize it?
Baseline drift, often observed as an unstable signal at the start of an experiment, is typically a sign of a non-optimally equilibrated sensor surface [2]. This frequently occurs after docking a new sensor chip or following the immobilization procedure, due to the rehydration of the surface and the wash-out of chemicals used during immobilization [2]. A poorly equilibrated system can lead to drift and changing analyte binding performance in initial cycles, compromising data quality [20].
Solution: Implement a comprehensive surface pre-conditioning protocol.
- Overnight Equilibration: In cases of significant drift, it can be necessary to run the running buffer overnight to equilibrate the surfaces fully [2] [7].
- Stabilization Cycles: Subject the ligand surface to several cycles of analyte injection and regeneration to stabilize it before formal data collection begins. This provides valuable information on the stability and reproducibility of the interaction [20].
- Buffer Matching: Ensure that your analyte and flow buffers are perfectly matched. Buffer mismatches are a common cause of bulk effects and large residuals, which contribute to instability [20] [11].
What is the detailed protocol for implementing start-up cycles?
Start-up cycles, also known as dummy injections, are a critical procedural step to "prime" the system and surface, minimizing drift and other artifacts during the actual analyte injections [20] [2].
Experimental Protocol:
- Initial System Prime: After a buffer change or system start-up, prime the system with your running buffer until a stable baseline is obtained [2].
- Incorporate Start-Up Cycles: In your experimental method, program at least three to five start-up cycles before the first analyte injection [20] [2].
- Cycle Composition: These cycles should be identical to your experimental cycles, but inject running buffer instead of analyte. If your method includes a regeneration step, include the regeneration injection in these start-up cycles as well [2].
- Exclude from Analysis: The data from these start-up cycles are used solely for system stabilization and should be left out of the final analysis. They should not be used as blanks for referencing [2].
Table 1: Components of a Start-Up Cycle Protocol
| Step | Description | Purpose |
|---|---|---|
| 1. Prime | Flush the system with running buffer | To equilibrate the entire fluidic system and remove air bubbles |
| 2. Buffer Injection | Inject running buffer as a sample | To stabilize the injection system and identify pressure-related spikes |
| 3. Regeneration | Apply the regeneration solution (if used) | To condition the surface to the regeneration process and stabilize ligand activity |
| 4. Repeat | Perform steps 2-3 for 3-5 cycles | To ensure system and surface responses are consistent and stable |
How does overnight equilibration work, and when is it necessary?
Overnight equilibration is an extended process used to achieve a perfectly stable baseline, which is foundational for high-quality, reproducible SPR data, especially in long-duration experiments.
Methodology:
- Procedure: Continuously flow fresh, filtered, and degassed running buffer over the docked sensor chip at a constant flow rate for an extended period, typically overnight [2] [7].
- Purpose: This process allows for the complete rehydration of the sensor surface and the thorough wash-out of any residual chemicals from the immobilization process, allowing the bound ligand to fully adjust to the flow buffer conditions [2].
Table 2: Equilibration Troubleshooting Guide
| Observation | Potential Cause | Recommended Action |
|---|---|---|
| Persistent high drift (> ± 0.3 RU/min) after docking | Surface not fully equilibrated | Extend the equilibration time; implement overnight buffer flow |
| Drift after buffer change | System not adequately primed with new buffer | Prime the system several times after each buffer change |
| Drift after regeneration | Differences in surface response between reference and active flow cells | Use double referencing to compensate for drift differences |
| Start-up drift after flow is initiated | Sensor surface susceptibility to flow changes | Allow additional time (5–30 minutes) for baseline to stabilize before first injection |
The following workflow diagram illustrates the strategic decision-making process for implementing these pre-conditioning steps.
What other experimental strategies can I use to minimize drift and improve data quality?
Beyond start-up cycles and extended equilibration, several other strategies are essential for a robust experimental setup.
- Use Fresh Buffers: Prepare running buffer fresh daily. Filter through a 0.22 µM filter and degas before use to eliminate particles and air bubbles, which are common causes of noise and spikes [5] [2]. Avoid adding fresh buffer to old stock, as contamination can occur.
- Implement Double Referencing: This is a powerful data processing technique to compensate for residual drift, bulk refractive index effects, and differences between flow channels. It involves subtracting both a reference surface signal and blank (buffer) injections spaced evenly throughout the experiment [20] [2].
- Include Blank Injections: Throughout your experimental run, incorporate blank cycles (running buffer only) at a rate of approximately one blank every five to six analyte cycles. This provides the necessary data for effective double referencing [2].
Research Reagent Solutions
Table 3: Essential Materials for SPR Surface Pre-conditioning
| Reagent / Equipment | Function / Purpose | Key Considerations |
|---|---|---|
| Running Buffer | Hydrates the surface and provides the solvent for interactions | Must be filtered (0.22 µm) and degassed; composition should match analyte buffer |
| Sensor Chip | Platform for ligand immobilization | Type (e.g., CM5, NTA, SA) must be compatible with ligand and immobilization chemistry |
| Regeneration Solution | Removes bound analyte between cycles in start-up and main experiments | Must be harsh enough to dissociate the complex but mild enough to preserve ligand activity (e.g., 10 mM Glycine pH 1.5–2.5) |
| Blocking Agent (e.g., BSA, Ethanolamine) | Occupies unused active sites on the sensor surface | Reduces non-specific binding, which can contribute to signal instability |
| SPR Instrument | Performs fluidic handling, injection, and real-time detection | Regular calibration and maintenance (e.g., "desorb" and "sanitize" routines) are critical |
How do I know if my pre-conditioning strategy is successful?
A successful pre-conditioning strategy results in a stable baseline with low noise, which is the foundation for acquiring high-quality, publication-ready data.
Success Criteria:
- Baseline Drift: Should be minimal, ideally less than ± 0.3 RU/minute [20].
- Noise Level: The system noise should be very low (e.g., < 1 RU), producing a flat and clean signal when buffer is flowing [2].
- Buffer Injections: Injections of running buffer alone should give low responses (e.g., < 5 RU), indicating a well-behaved system with minimal injection spikes or bulk effects [20].
By systematically implementing strategic surface pre-conditioning through start-up cycles and, when necessary, overnight equilibration, researchers can effectively mitigate baseline drift at its source. This proactive approach significantly enhances the reliability of data generated in long SPR experiments, supporting accurate kinetic and affinity analysis in critical research and drug development projects.
Troubleshooting Guides & FAQs
Understanding and Diagnosing Baseline Drift
What is baseline drift and why is it a problem in SPR experiments? Baseline drift is the gradual shift in the signal response when no analyte is present, making analysis difficult and leading to erroneous results [2]. In long experiments, uncompensated drift distorts binding curves, compromises kinetic parameter accuracy, and wastes valuable experimental time [2].
How can I determine if my baseline drift is acceptable? After proper system equilibration, your baseline drift should be minimal. A well-equilibrated system typically exhibits drift of less than ± 0.3 RU/min [20]. Injecting running buffer should yield low responses (under 5 RU), indicating a stable system ready for experiment [20].
What are the most common causes of baseline drift?
- Poor Surface Equilibration: Newly docked sensor chips or recently immobilized surfaces require time to rehydrate and wash out immobilization chemicals [2].
- Buffer Issues: Changing running buffers without sufficient system priming causes mixing and waviness [2].
- Start-up Effects: Flow initiation after standstill causes temporary drift (5-30 minutes) as the system stabilizes [2].
- Regeneration Solutions: These can cause differential drift between reference and active surfaces [2].
Implementing Double Referencing for Drift Compensation
What is double referencing and how does it compensate for drift? Double referencing is a two-step procedure that compensates for drift, bulk effects, and channel differences [2]. First, a reference channel is subtracted from the active channel, compensating for bulk effect and primary drift. Then, blank injections are subtracted, compensating for differences between reference and active channels [2].
What is the optimal strategy for incorporating blank injections? For effective double referencing, include blank cycles evenly throughout your experiment. It's recommended to add one blank cycle every five to six analyte cycles and always finish with a blank [2]. Space blanks evenly within the experiment to track and compensate for drift consistently across the entire run [2].
How should I prepare my system before starting the actual experiment? Incorporate at least three start-up cycles in your method that mimic analyte cycles but inject buffer instead [2]. These cycles prime the surface and eliminate differences from initial regeneration cycles. Do not use start-up cycles as blanks in your final analysis [2].
Advanced Experimental Setup for Drift Reduction
What buffer preparation practices minimize drift?
- Prepare fresh buffers daily and 0.22 µM filter and degas before use [2].
- Store buffers in clean, sterile bottles at room temperature [2].
- Never add fresh buffer to old buffer to avoid contamination [2].
- Add detergents after filtering and degassing to prevent foam formation [2].
How long should I equilibrate my sensor surface? For surfaces with significant drift, it may be necessary to run running buffer overnight to fully equilibrate [2] [7]. Flow running buffer at your experimental flow rate until a stable baseline is obtained, which may take 5-30 minutes after flow initiation [2].
What should I do after changing running buffers or cleaning the system? Always prime the system after each buffer change and method start [2]. Allow extra equilibration time after cleaning the system. Monitor the baseline until it stabilizes before beginning analyte injections [2].
Experimental Protocols
Protocol 1: System Equilibration and Baseline Stabilization
Purpose: To minimize initial drift before analyte injections through proper system preparation.
Materials:
- Freshly prepared, filtered (0.22 µm), and degassed running buffer
- Primed SPR instrument with docked sensor chip
Method:
- Prime the system several times with fresh running buffer [2].
- Begin continuous buffer flow at your experimental flow rate.
- Monitor the baseline response for stability.
- If drift exceeds ± 0.3 RU/min, continue flowing buffer [20].
- For persistent drift, flow running buffer overnight [2] [7].
- Once stable, inject running buffer several times to determine noise level.
- The system is ready when buffer injections yield responses < 5 RU with minimal spikes [20].
Protocol 2: Double Referencing Experimental Setup
Purpose: To implement double referencing for optimal drift compensation throughout the experiment.
Materials:
- Equilibrated SPR system
- Prepared analyte samples
- Running buffer for blank injections
Method:
- Program your method to include 3+ start-up cycles (buffer + regeneration) [2].
- Design your experimental cycle sequence with blank injections every 5-6 sample cycles [2].
- Include a final blank cycle at the end of the experiment [2].
- Execute the method with randomized analyte injections where possible.
- During analysis, subtract the reference channel from the active channel.
- Subsequently subtract the averaged blank injections from the reference-subtracted data [2].
Data Presentation
Table 1: Quantitative Guidelines for Optimal Drift Reduction
| Parameter | Optimal Value/Range | Purpose & Rationale |
|---|---|---|
| Baseline Drift Rate | < ± 0.3 RU/min [20] | Indicates properly equilibrated system |
| Buffer Injection Response | < 5 RU [20] | Confirms minimal bulk effects and system stability |
| Blank Injection Frequency | 1 per 5-6 analyte cycles [2] | Provides regular drift measurement points |
| Start-up Cycles | ≥ 3 cycles [2] | Stabilizes surface before data collection |
| System Noise Level | < 1 RU [2] | Ensures high-quality data detection |
Table 2: Research Reagent Solutions for Drift Management
| Reagent/Solution | Function & Application | Key Considerations |
|---|---|---|
| Fresh Running Buffer | Maintains system stability and prevents contamination [2] | Prepare daily, 0.22 µM filter, degas before use [2] |
| Degassed Buffer | Prevents bubble formation in fluidic system [5] | Eliminates air spikes that cause baseline artifacts |
| Detergents/Additives | Reduce non-specific binding and surface interactions [2] | Add after filtering and degassing to prevent foam [2] |
| Regeneration Solutions | Remove bound analyte between cycles [20] | Use mildest effective conditions to preserve ligand activity [20] |
| Blocking Agents | Minimize non-specific binding [12] | BSA, ethanolamine, or casein occupy remaining active sites [12] |
Methodological Visualization
Double Referencing Data Flow
Drift Reduction Experimental Workflow
Incorporating Blank and Control Injections for Continuous Baseline Monitoring
FAQs on Baseline Drift and Control Injections
1. What is baseline drift and why is it problematic in long SPR experiments? Baseline drift is an unstable or gradually shifting signal when no analyte is present. It is usually a sign of a non-optimally equilibrated sensor surface or system [2] [5]. In long experiments, it complicates data analysis by making it difficult to differentiate true binding events from background signal movement, potentially leading to erroneous kinetic parameters and affinity constants [2].
2. How do blank and control injections help monitor and correct for baseline drift? Blank injections (injecting running buffer instead of analyte) are used in the data processing step of double referencing [2] [21]. First, a reference flow cell is subtracted from the active flow cell to compensate for bulk effect and most of the drift. Subsequently, subtracting the blank injections compensates for small differences between the reference and active channels, providing a cleaner baseline for analysis [2]. Spacing these blanks evenly throughout the experiment allows for continuous monitoring and correction of the baseline [2].
3. What is the difference between a start-up cycle and a blank injection? Both involve injecting buffer, but they serve different purposes. Start-up cycles are performed at the very beginning of an experiment, before any analyte is injected, to "prime" and stabilize the sensor surface, especially after a regeneration step [2]. These cycles are not used in the final analysis. Blank injections are interspersed among the analyte injections throughout the entire experiment and are actively used in the double referencing procedure during data analysis [2].
4. How many blank injections should I include in my experiment? It is recommended to add blank cycles evenly within the experiment, with an average of one blank cycle for every five to six analyte cycles, and to end the experiment with a blank [2]. Having more blanks is considered better than having too few [2].
5. My baseline is still drifting even with blank injections. What else should I check? Blank injections are a data correction method; they do not prevent drift from occurring. If significant drift persists, investigate the root cause [2] [7] [5]:
- Buffer and System Equilibration: Ensure your running buffer is fresh, filtered, and degassed. Prime the system after every buffer change and flow running buffer until the baseline is stable; this can sometimes take 5-30 minutes or even overnight [2] [7].
- Sensor Surface: A newly docked chip or a recently immobilized surface needs time to rehydrate and equilibrate, which causes initial drift [2].
- Instrument Maintenance: Check for air bubbles or leaks in the fluidic system and ensure the instrument is in a stable environment with minimal temperature fluctuations [5].
Troubleshooting Guide for Baseline Instability
| Problem | Possible Cause | Recommended Solution |
|---|---|---|
| High Baseline Noise [5] | Electrical noise; contaminated buffer or sensor surface; environmental fluctuations. | Ensure proper instrument grounding; use a clean, filtered buffer; place instrument in a stable environment away from vibrations [5]. |
| Sudden Baseline Jumps | Change in running buffer composition; air spikes; improper priming. | Always prime the system after a buffer change; ensure buffers are thoroughly degassed to prevent air spikes [2] [5]. |
| Carryover Effect [7] | Incomplete regeneration of the sensor surface between analyte injections. | Optimize regeneration conditions (solution, contact time) to completely remove bound analyte without damaging the ligand [7] [11]. |
| Bulk Shift [11] | Refractive index (RI) difference between the running buffer and the analyte sample buffer. | Match the analyte buffer to the running buffer as closely as possible. Use reference subtraction to compensate for remaining shifts [11] [21]. |
| Continuous Drift [2] [7] | Poorly equilibrated system or sensor surface; buffer instability. | Extend the system equilibration time with buffer flow. Incorporate start-up cycles. Prepare fresh running buffer daily [2] [7]. |
Experimental Protocol: Establishing a Stable Baseline
This protocol details the methodology for system setup and equilibration to minimize baseline drift, incorporating blank injections for monitoring.
Methodology for System Preparation and Continuous Monitoring
- Buffer Preparation: Prepare running buffer fresh daily. Filter through a 0.22 µM filter and degas to prevent air spikes. If needed, add detergents after degassing to avoid foam [2].
- System Priming: Prime the instrument with the new running buffer several times to ensure the fluidic system is completely filled and free of previous buffer or contaminants [2].
- Initial Equilibration: Flow running buffer over the sensor surface at the experimental flow rate. Monitor the baseline until it is stable. This may take 5–30 minutes, or longer for new chips [2]. In some cases, flowing buffer overnight is necessary [7].
- Incorporate Start-up Cycles: In your experimental method, program at least three start-up cycles before any analyte is injected. These cycles should mimic the experimental cycle (including regeneration if used) but inject only running buffer. Do not use these cycles in the final analysis [2].
- Run the Experiment with Blank Injections:
- Data Processing (Double Referencing):
- Zero the Y-axis: Align all sensorgrams to a baseline region just before an injection [21].
- Reference Subtraction: Subtract the signal from the reference flow channel from the active flow channel [2] [21].
- Blank Subtraction: Subtract the averaged response of the blank injections from the analyte injection curves. This, combined with reference subtraction, constitutes double referencing and effectively compensates for residual drift and channel differences [2] [21].
Double Referencing Data Workflow
The following diagram illustrates the sequence of data processing steps for double referencing, which uses blank and reference channel injections to correct the baseline.
System Equilibration Protocol
This workflow outlines the key steps for preparing the SPR instrument and sensor surface to minimize initial baseline drift.
Research Reagent Solutions
The following table details key materials and their specific functions in maintaining a stable baseline and implementing effective blank controls.
| Reagent/Material | Function in Baseline Monitoring & Stability |
|---|---|
| Fresh Running Buffer | The foundation of stability. Fresh preparation prevents contamination from microbial growth or chemical degradation that causes drift [2]. |
| 0.22 µM Filter | Removes particulate matter from buffers that could clog the fluidic system or bind non-specifically to the sensor surface, causing spikes and drift [2]. |
| Degasser | Removes dissolved air from the buffer to prevent the formation of air bubbles in the fluidic system, which create sudden spikes and baseline disturbances [2] [5]. |
| Reference Sensor Chip | A surface without immobilized ligand (or with an inertly coated ligand) used in a reference flow channel. It is essential for the first step of double referencing to subtract bulk refractive index shifts [2] [21]. |
| Buffer for Blank Injections | Identical to the running buffer. Used in blank injections to distinguish system-derived drift from specific binding signals during data processing [2] [21]. |
| Non-ionic Detergent (e.g., Tween 20) | An additive to running buffer or samples to reduce non-specific binding (NSB) to the sensor surface. Lower NSB results in a cleaner and more stable baseline [11] [6]. |
Troubleshooting Guides
Guide to Diagnosing and Resolving Baseline Drift
Q: What are the primary causes of baseline drift in SPR experiments, and how can I resolve them?
Baseline drift, characterized by a gradual shift in the baseline signal over time, is a common issue that can compromise data quality in long SPR experiments. The table below summarizes the main causes and solutions.
| Cause of Drift | Underlying Issue | Recommended Solution | Preventive Measures |
|---|---|---|---|
| Poor Surface Equilibration [2] | Sensor surface is not fully hydrated or adjusted to the flow buffer after docking or immobilization. | Flow running buffer for an extended period (e.g., overnight) to equilibrate the surface [2]. | Incorporate start-up cycles with buffer injections before actual sample runs [2]. |
| Inadequate System Equilibration [2] | System not fully flushed after a buffer change or cleaning procedure. | Prime the system thoroughly after each buffer change. Flow running buffer at the experiment's flow rate until the baseline is stable [2]. | Always prime the system after buffer changes and allow extra equilibration time after cleaning [2]. |
| Unstable Immobilization [6] | Ligand is not stably attached to the sensor chip, leading to gradual shedding. | Optimize the immobilization chemistry and density. Ensure thorough washing to remove contaminants post-immobilization [6]. | Use a covalent immobilization strategy like EDC/NHS chemistry for stable bonds [22]. |
| Inefficient Surface Regeneration [6] | Residual analyte remains bound, causing a cumulative shift in baseline. | Develop a robust regeneration protocol that completely removes analyte without damaging the immobilized ligand [6]. | Test different regeneration buffers and contact times to find the optimal conditions. |
| Buffer Incompatibility [6] | Buffer components interact with the sensor chip or immobilized ligand. | Check buffer compatibility. Use fresh, 0.22 µM filtered, and degassed buffers prepared daily [2] [6]. | Avoid adding fresh buffer to old stocks. Use buffers at room temperature to minimize dissolved air [2]. |
FAQ: Addressing Common Immobilization Challenges
Q: How does ligand density specifically influence baseline drift and data quality?
Ligand density is a critical factor that influences both the stability of the surface and the quality of the kinetic data. An imbalance can lead to drift and artifacts [23].
- Too High Density: Can cause steric hindrance, where analyte molecules cannot access all binding sites. This may lead to mass transport limitations, where the measured kinetics reflect the diffusion of the analyte to the surface rather than the true binding interaction. High-density surfaces can also be more prone to non-specific binding and may take longer to equilibrate, contributing to apparent drift [22] [23].
- Too Low Density: Results in a weak signal, making it difficult to distinguish genuine binding from background noise. For low molecular weight analytes, a sufficiently high density is necessary to generate a detectable signal [23]. A surface with low density may also not stabilize effectively, leading to drift.
Q: What immobilization strategies are recommended for fragile ligands like membrane proteins?
Membrane proteins are particularly challenging due to their need for a lipid environment to maintain native structure and activity [24]. A novel strategy integrates the SpyCatcher-SpyTag covalent system with membrane scaffold protein (MSP)-based nanodiscs [25].
- An MSP-SpyTag fusion protein is used to incorporate the target membrane protein into a lipid nanodisc.
- SpyCatcher protein is immobilized on a sensor chip (e.g., CM5) using standard amine coupling.
- The nanodisc, carrying the SpyTag, is flowed over the surface and is captured covalently and specifically by the SpyCatcher [25]. This method immobilizes the membrane protein in a near-native lipid environment, promoting stability and reducing baseline drift by ensuring a robust, oriented attachment [25].
Q: How can I correct for baseline drift during data analysis?
The most effective method is Double Referencing [2]. This two-step procedure compensates for drift, bulk refractive index effects, and non-specific binding.
- Reference Channel Subtraction: Subtract the signal from a reference surface (immobilized with an inactive protein like BSA) from the active surface signal. This removes the bulk effect and a significant portion of the drift [2] [26].
- Blank Injection Subtraction: Subtract the response from injections of running buffer (blanks) collected throughout the experiment. This compensates for any remaining differences between the reference and active channels. For best results, space blank injections evenly within the experiment [2].
Experimental Protocols
Protocol for Optimizing Ligand Immobilization Density
This protocol guides you through a calculated approach to immobilize an optimal amount of ligand for kinetic studies, which helps minimize mass transport and steric effects that can contribute to drift.
Purpose: To immobilize a ligand density that yields a maximum analyte response (Rmax) of ~100 RU for kinetic analysis, minimizing drift and artifacts [23].
Step 1: Calculate Theoretical Rmax. Determine the theoretical response for full surface saturation using the formula: ( R{max} = \frac{MW{analyte}}{MW{ligand}} \times R{ligand} \times Valency ) Where ( MW ) is molecular weight, ( R{ligand} ) is the immobilization level of the ligand in RU, and Valency is the number of binding sites per ligand molecule [23].
Step 2: Immobilize a Test Ligand Density. Using standard amine coupling (EDC/NHS), immobilize the ligand to a preliminary level (e.g., 5,000-10,000 RU). The system will report the final immobilized response (( R_{ligand} )).
Step 3: Inject a High Concentration of Analyte. Inject a single, high concentration of a known analyte to achieve near-saturation of the surface.
Step 4: Calculate Functional Percentage. Compare the observed Rmax from Step 3 with the theoretical Rmax from Step 1. A low observed Rmax may indicate that a portion of the immobilized ligand is inactive or inaccessible [23].
Step 5: Adjust and Finalize. Use the functional percentage to calculate the required ( R_{ligand} ) to achieve a target observed Rmax of ~100 RU. Repeat the immobilization process aiming for this new, calculated density.
Protocol for Single-Cycle Kinetics (SCK) to Minimize Surface Damage
For interactions where surface regeneration is harsh and leads to ligand inactivation and drift, the Single-Cycle Kinetics (SCK) method is a superior alternative to the traditional Multi-Cycle Kinetics (MCK) [3].
Purpose: To determine binding kinetics while minimizing surface regeneration steps, thereby preserving surface activity and reducing baseline drift associated with repeated regeneration [3].
The workflow below contrasts the steps for Multi-Cycle Kinetics (MCK) and Single-Cycle Kinetics (SCK).
The Scientist's Toolkit: Essential Research Reagents & Materials
The following table lists key materials and their functions for achieving stable immobilization and low-drift SPR experiments.
| Item | Function & Rationale |
|---|---|
| CM5 Sensor Chip [22] | A carboxymethylated dextran chip commonly used for covalent immobilization of proteins via amine coupling. Its hydrogel structure provides a high binding capacity. |
| C1 Sensor Chip [22] | A chip with a flat, non-dextran surface. Crucial for analyzing large analytes like nanoparticles, as it eliminates steric hindrance and mass transport issues within the 3D dextran matrix of the CM5. |
| EDC & NHS [22] | Cross-linking reagents (1-Ethyl-3-(3-dimethylaminopropyl)carbodiimide and N-Hydroxysuccinimide) used to activate carboxyl groups on the sensor chip surface for covalent ligand immobilization. |
| MSP-SpyTag Fusion Protein [25] | A membrane scaffold protein fused to SpyTag, used to incorporate membrane proteins into nanodiscs. This creates a stable, native-like lipid environment for immobilization. |
| SpyCatcher Protein [25] | Immobilized on the sensor chip, it covalently and specifically captures the SpyTag on the nanodisc, providing a stable and oriented attachment for membrane proteins. |
| Ethanolamine [6] | A blocking agent used to deactivate any remaining activated ester groups on the sensor surface after ligand immobilization, reducing non-specific binding. |
| Filter (0.22 µM) & Degasser [2] | Essential for preparing running buffer. Filtering removes particulates that can cause spikes, while degassing prevents air bubbles that create severe signal artifacts and baseline drift. |
| Detergent (e.g., Tween-20) [2] [6] | An additive to running buffer (added after degassing to prevent foam) that helps reduce non-specific binding to the sensor chip and fluidic system. |
Logical Guide for Surface Preparation and Drift Mitigation
The following diagram outlines a systematic decision-making process for preparing a stable sensor surface and selecting the appropriate kinetic method to mitigate baseline drift.
Diagnosing and Correcting Baseline Instability: A Step-by-Step Guide
Question: What are the common drift patterns in SPR experiments and how can I systematically identify and resolve them?
Baseline drift is a frequent challenge in Surface Plasmon Resonance (SPR) experiments, particularly in long-term studies critical for drug development. An unstable baseline can compromise the quality of kinetic and affinity data. This guide provides a systematic approach to diagnose and correct the underlying causes of different drift patterns, helping to ensure the integrity of your research data.
Drift Pattern Identification and Solutions
The following table categorizes common baseline drift symptoms, their likely causes, and specific corrective actions.
| Symptom / Drift Pattern | Likely Cause | Recommended Solution |
|---|---|---|
| Start-up Drift: Drift immediately after initiating flow or docking a new sensor chip. [2] | Sensor surface not fully equilibrated; rehydration of the chip or wash-out of immobilization chemicals. [2] | Flow running buffer for 5-30 minutes (or overnight if necessary) to stabilize the baseline before analyte injection. [2] |
| Continuous Upward or Downward Drift | System not fully equilibrated after a buffer change; contaminated or old buffer. [2] [5] | Prime the system several times after a buffer change; always use fresh, filtered, and degassed daily. [2] [5] |
| Drift after Regeneration | Regeneration solution causing instability; incomplete removal of bound analyte. [2] [5] | Optimize regeneration conditions (pH, buffer composition); ensure sufficient flow rate and time for complete surface cleaning. [5] |
| Drift with High Noise | Air bubbles in the fluidic system; temperature fluctuations; electrical noise; contaminated buffer or surface. [5] | Ensure buffers are properly degassed; check for system leaks; place instrument in a stable environment; clean or regenerate the sensor surface. [5] |
Visual Troubleshooting Guide
The flowchart below outlines a logical pathway to diagnose baseline drift issues, from symptom observation to proposed solutions. This visual guide is based on established troubleshooting protocols. [2] [5] [7]
Detailed Experimental Protocols for Mitigation
System and Buffer Equilibration Protocol
A primary cause of drift is inadequate equilibration. [2] This protocol ensures system stability.
- Procedure:
- Prepare a fresh running buffer daily and filter it through a 0.22 µM filter. [2]
- Degas the buffer thoroughly to prevent air spikes. [2]
- Prime the instrument with the new buffer at least three times to fully replace the old buffer in the fluidic system. [2]
- Set the instrument to flow running buffer at your experimental flow rate. Monitor the baseline.
- For new or freshly docked sensor chips, flow buffer for 30-60 minutes, or until stable. For persistent drift, equilibration overnight may be necessary. [2]
- Incorporate at least three "start-up cycles" or "dummy injections" (injecting buffer instead of analyte) at the beginning of your experiment to further stabilize the surface. Do not use these cycles for data analysis. [2]
Surface Regeneration Optimization Protocol
Inefficient regeneration can lead to analyte carryover and baseline drift. [5]
- Procedure:
- After an analyte injection, inject a short pulse (30 seconds) of a candidate regeneration solution. Common solutions include glycine-HCl (pH 1.5-3.0) or NaOH (10-50 mM).
- Monitor the response. An effective regeneration will rapidly return the signal to the original baseline level.
- Perform a second injection of the analyte to confirm that the binding capacity of the ligand has not been diminished. A stable response in subsequent cycles indicates successful regeneration. [5]
- If baseline rises over multiple cycles, increase the regeneration time or try a different regeneration solution.
Research Reagent Solutions
The following table details key materials and their functions for preventing and troubleshooting baseline drift.
| Reagent / Material | Function in Troubleshooting Drift |
|---|---|
| Fresh Running Buffer | Prevents drift caused by microbial growth, evaporation, or pH shifts in old buffer; degassing prevents bubble formation. [2] [5] |
| High-Purity Detergent (e.g., Tween-20) | Added to running buffer to reduce non-specific binding to the sensor surface, a potential source of drift. [6] |
| 0.22 µM Filter | Removes particulate matter from buffers that could clog the microfluidic system or introduce noise. [2] |
| Regeneration Buffers (e.g., Glycine-HCl, NaOH) | Efficiently removes bound analyte without damaging the ligand, preventing carryover and drift in subsequent cycles. [5] |
| Blocking Agents (e.g., BSA, Ethanolamine) | Blocks unused active sites on the sensor surface after ligand immobilization, minimizing non-specific binding that can cause drift. [5] |
FAQ: What causes post-regeneration baseline drift in SPR experiments?
Post-regeneration drift typically occurs when the sensor surface fails to re-equilibrate properly with the running buffer after the regeneration solution has been flushed through the system. This can happen due to several factors: the regeneration buffer may be chemically incompatible with your running buffer, causing persistent changes to the surface; the regeneration conditions may be too harsh, partially denaturing the immobilized ligand; or the conditions may be too mild, leaving residual analyte on the surface. Additionally, insufficient washing or equilibration time after regeneration prevents the system from returning to a stable baseline before the next injection [27] [2].
FAQ: How can I tell if my regeneration buffer is too harsh or too mild?
You can diagnose regeneration buffer issues by monitoring the baseline and binding response across multiple analyte injections:
- Ideal Regeneration: The baseline returns to its original level after each regeneration, and the analyte binding response (response height) remains consistent for injections at the same concentration [27].
- Too Harsh: The baseline decreases after each regeneration step, and the amount of subsequent analyte binding also progressively decreases. This indicates ligand damage or loss from the surface [27].
- Too Mild: The baseline remains higher than its original level after regeneration, as analyte is not fully removed. This can also lead to higher-than-expected binding responses in subsequent cycles due to analyte carryover [27].
The diagram below illustrates this decision-making process for diagnosing and resolving post-regeneration drift.
FAQ: What is the systematic approach to optimizing a regeneration buffer?
Optimizing a regeneration buffer requires a methodical, scouting approach to find the best balance between complete analyte removal and ligand preservation.
Experimental Protocol for Regeneration Scouting:
- Start Mild: Begin testing with the mildest potential regeneration condition from the table below [27].
- Inject Analyte: Inject your analyte over the ligand surface to achieve a binding response.
- Apply Regeneration: Inject the candidate regeneration buffer and monitor if the response returns to the original baseline.
- Assess Ligand Activity: Re-inject the same concentration of analyte. Compare the new binding response to the first one to check for consistent binding capacity.
- Increase Stringency: If analyte remains (baseline does not return to original level), progressively increase the stringency of the regeneration condition (e.g., lower pH, higher concentration, add additives) until complete removal is achieved [27].
- Validate Stability: Once a candidate is found, perform 5-10 repeated cycles of analyte binding and regeneration. The baseline and binding responses should remain stable over these cycles to confirm the ligand's activity is preserved [27].
Research Reagent Solutions
The following table lists common reagents used to prepare regeneration buffers, categorized by their primary mode of action.
| Reagent / Solution | Primary Function | Common Uses & Considerations |
|---|---|---|
| Glycine-HCl (pH 2.0-3.0) [12] | Low-pH elution | Disrupts electrostatic and hydrogen bonding interactions. Commonly used for antibodies and protein-protein complexes. |
| Phosphoric Acid [12] | Low-pH elution | A strong acid used for stubborn interactions. Requires careful optimization to avoid ligand denaturation. |
| Sodium Hydroxide (10-50 mM) [27] [12] | High-pH elution | Disrupts hydrophobic interactions and deprotonates functional groups. Ideal for nucleic acid interactions. |
| Sodium Dodecyl Sulfate (SDS 0.01-0.5%) [27] | Ionic detergent | Effectively solubilizes and removes proteins by disrupting hydrophobic and electrostatic bonds. Use at low concentrations. |
| High-Salt Solutions (e.g., 1-4 M MgCl₂, NaCl) [12] | Ionic strength disruption | Competes with and disrupts electrostatic interactions. Can be a mild alternative or used in cocktails. |
| Glycerol (5-10%) [12] | Stabilizing additive | Added to regeneration buffers to help maintain ligand stability and activity during harsh regeneration. |
Quantitative Regeneration Buffer Guide
The optimal regeneration buffer is highly specific to the molecular interaction being studied. The table below summarizes common starting conditions based on interaction types.
| Interaction Type | Recommended Regeneration Buffers | Typical Concentration Range | Key Considerations |
|---|---|---|---|
| Proteins / Antibodies [27] | Glycine-HCl, Citric Acid, Phosphoric Acid | 10 - 150 mM, pH 1.5 - 3.0 | Most common starting point. Test from high pH to low pH. |
| Nucleic Acids [27] | Sodium Hydroxide (NaOH), SDS | 10 - 100 mM NaOH0.01 - 0.5% SDS | NaOH is often very effective. Ensure ligand stability at high pH. |
| Peptides / Protein-Nucleic Acid [27] | SDS, acidic buffers | 0.01 - 0.5% SDS | SDS is highly effective but requires thorough washing to remove. |
| Lipids / Membrane Proteins [27] | Isopropanol:HCl, detergent cocktails | 1:1 ratio (IPA:HCl) | Harsh conditions often needed. Compatibility with sensor chip must be verified. |
| His-Tagged Protein Capture [12] | Imidazole, EDTA, low pH | 100 - 500 mM Imidazole | Competes with His-tag binding to NTA chip. Generally mild on the protein itself. |
Best Practices to Minimize Drift in Long SPR Experiments
Implementing robust experimental procedures is crucial for obtaining stable baselines in long-term experiments.
- Proper System Equilibration: Always prime the system after a buffer change and flow running buffer until a stable baseline is achieved. For new sensor chips or after immobilization, this may require extended time (even overnight) to fully rehydrate and equilibrate the surface [2].
- Use Start-Up Cycles: Incorporate at least three "start-up" cycles at the beginning of your experimental method. These cycles should inject running buffer instead of analyte, followed by the regeneration step. This conditions the surface and stabilizes the system before actual data collection. These cycles should not be used in data analysis [2].
- Buffer Matching and Hygiene: Always prepare fresh, filtered, and degassed buffers daily. Ensure that the running buffer and the sample/regeneration buffers are perfectly matched in composition (e.g., salt concentration, pH) to avoid bulk refractive index shifts [2] [5].
- Employ Double Referencing: Use a reference flow cell and include blank (buffer) injections throughout your experiment. Subtracting the reference channel signal corrects for bulk effects and systemic drift, while subtracting the average blank injection response accounts for differences between channels, leading to cleaner data [2].
Correcting for Bulk Refractive Index Shifts and Non-Specific Binding Artifacts
Frequently Asked Questions (FAQs)
What are the primary causes of bulk refractive index (RI) shifts in SPR experiments? Bulk refractive index shifts occur when the buffer composition of the injected analyte sample does not perfectly match that of the running buffer. Even minor differences in components like salt concentration, DMSO content, or glycerol can cause significant shifts in the sensorgram, as the SPR signal responds to any change in the mass concentration at the sensor surface, regardless of whether it is due to specific binding or just a buffer mismatch [17].
How can Non-Specific Binding (NSB) be distinguished from specific binding signals? Non-specific binding is indicated by a significant signal response when the analyte is injected over a reference flow cell or a surface without the specific ligand immobilized. To test for NSB, a preliminary experiment should be run by flowing the analyte over a bare sensor surface. A signal change under these conditions suggests NSB is occurring, which can inflate the response units and lead to erroneous kinetic data [28] [6].
Why is it crucial to correct for both bulk RI shifts and NSB in long-duration experiments? In long SPR experiments, baseline stability is paramount. Uncorrected bulk effects and NSB contribute to baseline drift, signal spikes, and overall increased noise [17] [2]. These artifacts obscure the true binding signal, compromise the accuracy of kinetic and affinity calculations, and can lead to incorrect conclusions, especially when studying weak interactions or working with low analyte concentrations [28] [5].
What is "bridging" or avidity artifact, and how does it differ from NSB? Bridging is a specific type of method-dependent avidity artifact that occurs when a multivalent analyte (e.g., a polyubiquitin chain) simultaneously binds to two or more ligand molecules that are immobilized in close proximity on the sensor surface. This is distinct from general NSB, as it involves the specific ligand but results in an overestimation of binding affinity due to the multivalent interaction. This artifact is dependent on ligand density on the sensor chip [29].
Troubleshooting Guides
Guide 1: Correcting for Bulk Refractive Index Shifts
Bulk RI shifts manifest as immediate, large steps in the sensorgram at the start and end of analyte injection. The following workflow outlines a systematic approach to diagnosing and mitigating these shifts.
Diagnosis and Protocol:
- Problem Identification: A bulk shift is confirmed if injecting a sample with a known difference in buffer composition (e.g., running buffer with added salt) produces a large, square-shaped signal response that returns to baseline at the end of the injection [17].
- Buffer Matching (Sample Preparation):
- Dialysis: Dialyze the analyte sample against the running buffer to equilibrate the buffer conditions [17].
- Size Exclusion Chromatography (SEC): Use a desalting column or SEC to exchange the analyte into the running buffer [17].
- Consistent Additives: If additives like DMSO are necessary, ensure their concentration is identical in both the sample and the running buffer. Preparing the running buffer from the final dialysis step of the analyte is a reliable method [17].
- Experimental Setup (Reference Surface):
- Always use a reference flow cell on the sensor chip. An ideal reference surface closely matches the active surface but lacks the specific ligand. This can be achieved by immobilizing a non-interacting protein or by using a surface that has undergone the activation and blocking steps without ligand attachment [2].
- Data Processing (Double Referencing):
- Step 1: Subtract the signal from the reference flow cell from the signal of the active flow cell. This removes the majority of the bulk shift signal [2].
- Step 2: Further subtract the average response from several "blank" injections (running buffer alone) from all sensorgrams. This step compensates for any small differences between the reference and active channels and for systematic drift, finalizing the correction [2].
Guide 2: Mitigating Non-Specific Binding (NSB) Artifacts
NSB typically appears as a positive signal on the reference surface or a signal on the active surface that does not fully dissociate. The guide below outlines the process to reduce NSB.
Diagnosis and Protocol:
- Problem Identification: Immobilize your ligand on the active flow cell. On a reference flow cell, create a surface without the ligand (e.g., activated and blocked only). Inject your analyte. A significant signal on the reference flow cell indicates NSB [28].
- Buffer Optimization (Liquid Phase):
- Adjust pH: Modify the pH of the running buffer to ensure it is not near the isoelectric point (pI) of your analyte, which can reduce charge-based interactions. A pH that gives the analyte a net charge opposite to the sensor surface can help repel it [28].
- Add Surfactants: Include a non-ionic detergent like Tween 20 (0.01-0.1% v/v) in the running buffer to disrupt hydrophobic interactions [28] [6].
- Increase Ionic Strength: Adding salts like NaCl (150-200 mM) can shield electrostatic interactions between a charged analyte and the surface [28].
- Surface Blocking (Solid Phase):
- Surface Chemistry Selection (Pre-experiment):
- Choose a sensor chip with a surface chemistry that minimizes NSB for your specific molecules. For example, if working with hydrophobic molecules, a chip with a hydrophilic coating may be beneficial [6].
Advanced Topics: Artifacts from Multivalent Analytes
Multivalent analytes like polyubiquitin chains can cause a "bridging" artifact, where a single analyte molecule binds multiple ligands on the sensor surface, dramatically overestimating affinity [29].
Diagnosis and Mitigation Protocol:
- Vary Ligand Density: Conduct the same binding experiment at different ligand immobilization levels (low, medium, high). A strong dependence of the apparent affinity on ligand density is a key indicator of bridging. The measured affinity (KD) will appear stronger as ligand density increases [29].
- Use Lower Ligand Density: The most straightforward mitigation is to use the lowest ligand density that still provides an acceptable signal-to-noise ratio. At lower densities, ligand molecules are spaced farther apart, making it physically harder for a single analyte to bridge between them [29].
- Validate with Solution-Based Techniques: For critical measurements, validate SPR results with an orthogonal, solution-based method like Isothermal Titration Calorimetry (ITC) or Flow-Induced Dispersion Analysis (FIDA), which are not susceptible to surface-based avidity artifacts [30] [29].
The Scientist's Toolkit: Research Reagent Solutions
Table 1: Essential reagents for correcting common SPR artifacts.
| Reagent/ Material | Function/Benefit | Example Usage & Notes |
|---|---|---|
| BSA (Bovine Serum Albumin) | Protein-based blocking agent. Occupies reactive sites on the sensor surface to prevent NSB. | Used at ~1% concentration in running buffer or as a separate injection post-immobilization [28] [6]. |
| Tween 20 | Non-ionic surfactant. Reduces NSB caused by hydrophobic interactions. | Typically used at 0.01-0.1% (v/v) in running buffer [28] [6]. |
| NaCl | Salt. Shields charge-based interactions to reduce electrostatic NSB. | Concentrations of 150-200 mM are common. Must be compatible with biomolecule stability [28]. |
| Size Exclusion Spin Columns | For buffer exchange. Rapidly transfers analyte into running buffer to minimize bulk shifts. | Ideal for small volume processing before injection [17]. |
| Dialysis Kit | For buffer exchange. Gently equilibrates analyte with running buffer over several hours. | Suitable for larger volumes or delicate proteins [17]. |
| Sensor Chip with Reference Channel | Gold-standard surface. Allows for real-time subtraction of bulk and NSB signals. | A dedicated, matched reference surface is critical for double referencing [2]. |
| Ethanolamine | Small molecule blocking agent. Deactivates NHS-ester groups after amine coupling. | A standard regeneration step in amine-coupling immobilization protocols [5] [6]. |
Experimental Parameter Tables
Table 2: Buffer additive strategies to mitigate non-specific binding.
| Type of Suspected NSB | Additive | Recommended Concentration | Mechanism of Action |
|---|---|---|---|
| Hydrophobic Interactions | Tween 20 | 0.01 - 0.1% (v/v) | Disrupts hydrophobic associations [28] [6]. |
| Electrostatic Interactions | NaCl | 150 - 500 mM | Shields charged groups, reducing attraction [28]. |
| General / Protein Adsorption | BSA | 0.1 - 1% (w/v) | Coats surface, blocking sites for NSB [28]. |
Table 3: Summary of artifact features and primary solutions.
| Artifact | Key Feature in Sensorgram | Primary Correction Strategy |
|---|---|---|
| Bulk RI Shift | Sharp, square pulse at injection start/end; returns to baseline [17]. | Buffer matching and double referencing with a reference channel [17] [2]. |
| Non-Specific Binding (NSB) | Signal on reference surface; slow or incomplete dissociation [28] [5]. | Buffer optimization, surface blocking, and reference subtraction [28] [6]. |
| Bridging (Avidity) | Apparent affinity (KD) strengthens with increased ligand density [29]. | Reduce ligand immobilization level; use solution-based validation [29]. |
Systematic Cleaning and Maintenance Protocols to Prevent Long-Term Instrumental Drift
In Surface Plasmon Resonance (SPR) research, achieving a stable baseline is fundamental to obtaining reliable kinetic data. Long-term instrumental drift, characterized by a gradual shift in the baseline signal over time, directly compromises the accuracy of affinity and kinetics measurements, particularly in prolonged experiments. This drift often originates from subtle changes in the instrument's fluidics, optical components, or sensor surface, frequently traceable to inadequate or inconsistent maintenance. A well-maintained SPR instrument is not merely an operational preference but a prerequisite for high-quality data. Systematic cleaning and maintenance protocols directly target the primary sources of drift, ensuring that the observed signals reflect true biomolecular interactions rather than instrumental artifact. This guide provides detailed, actionable protocols to help researchers minimize baseline instability and uphold the integrity of their data.
Foundational Maintenance Concepts
Rigorous maintenance can be categorized into daily, weekly, and monthly tasks. The following workflow outlines the key decision points for sustaining an instrument in optimal condition.
Detailed Maintenance Schedules and Procedures
Adherence to a structured maintenance schedule is the most effective strategy for preventing unexpected drift and performance degradation.
Table 1: Summary of Routine SPR Instrument Maintenance
| Task | Frequency | Time Needed | Key Purpose |
|---|---|---|---|
| Syringe Inspection | Daily | 2 minutes | Ensure no air bubbles or leaks in delivery system [31] |
| Unclogging | Daily | 4 minutes | Remove small air bubbles and particles from tubing/IFC [31] |
| Injection Port Cleaning | Weekly | 5 minutes | Remove salt build-up to ensure proper fluidics [31] |
| Vial Dislodger Cleaning | Weekly | 2 minutes | Prevent contamination of sample vials [31] |
| Needle Positioning | Weekly | 5 minutes | Ensure accurate and reproducible sample injections [31] |
| Desorb | Weekly | 22 minutes | Remove adsorbed proteins from IFC and autosampler [31] |
| Superdesorb | Monthly | 90 minutes | Perform thorough chemical cleaning of the entire fluidic path [31] |
| Sanitize | Monthly | 45 minutes | Eliminate micro-organisms using hypochlorite solution [31] |
Core Maintenance Procedures
- Desorb Procedure: This weekly cleaning uses a series of chemical solutions to remove proteins and other biomolecules that have adsorbed to the interior surfaces of the Integrated Fluidic Cartridge (IFC) and autosampler. It is normal for the first few runs after a Desorb to show some deviation as the system re-equilibrates. Pre-coating the tubing with a non-interfering protein like BSA can mitigate this [31].
- Superdesorb Procedure: This intensive monthly cleaning is essential for removing stubborn contaminants. Always use a dummy-chip during this process to protect sensitive sensor chips from damaging chemicals. The protocol involves priming the system with the following solutions in sequence [31]:
- 0.5% SDS (3x) – Degrades proteins and lipids.
- 50 mM Glycine-NaOH pH 9.5 (3x) – Cleans under alkaline conditions.
- Deionized Water at 40°C (5x) – Rinses away residual chemicals.
- Running Buffer (2x) – Re-equilibrates the system for experiments.
Frequently Asked Questions (FAQs) and Troubleshooting
Table 2: Troubleshooting Common SPR Issues Related to Maintenance
| Problem | Potential Cause | Solution |
|---|---|---|
| Persistent Baseline Drift | Buffer incompatibility; Contaminated tubing/IFC; Inefficient surface regeneration [6] | Check buffer composition; Run Superdesorb procedure; Optimize regeneration buffer [31] [6] |
| Low Signal Intensity | Low ligand density; Poor immobilization efficiency; Contaminated optics [6] | Optimize ligand coupling; Clean sensor chip; Check detector performance [31] [6] |
| Non-Specific Binding | Inadequately blocked surface; Inappropriate surface chemistry [6] | Use blocking agents (e.g., ethanolamine, BSA); Select sensor chip with suitable chemistry (e.g., CM5, C1) [6] |
| Poor Reproducibility | Inconsistent surface activation; Variable chip handling; Environmental fluctuations [6] | Standardize immobilization protocol; Include control samples; Control lab temperature/humidity [6] |
| Abnormal SPR Dip | Surface heterogeneity; Air bubbles on sensor chip [31] | Ensure homogeneous sensor surface; Flow buffer at high rate to dislodge bubbles [31] |
Advanced Troubleshooting: SPR Dip Analysis
The SPR dip is a direct reflection of the sensor surface's status. A normal dip is deep and sharp. A shallow dip can indicate surface heterogeneity, which might be caused by uneven immobilization or the presence of microscopic contaminants. While a slightly shallow dip may still function, it can contribute to noise and drift. A missing dip often occurs when a large change in refractive index pushes the system beyond its dynamic range, but can also signal a severely compromised surface. Flowing buffer at a high flow rate can sometimes resolve minor issues by removing tiny air bubbles [31].
The Scientist's Toolkit: Essential Research Reagent Solutions
Table 3: Key Reagents for SPR Maintenance and Experimentation
| Reagent / Equipment | Function / Purpose |
|---|---|
| 0.5% SDS Solution | A potent detergent used in Superdesorb to dissolve proteins and lipids from the fluidic system [31] |
| 50 mM Glycine-NaOH (pH 9.5) | An alkaline solution used in cleaning cycles to remove a wide range of organic contaminants [31] |
| Desorb Solution | Proprietary solution designed to strip adsorbed proteins from the IFC and autosampler with minimal damage [31] |
| Sanitize Solution (Hypochlorite) | Eliminates microbial growth within the fluidic path to prevent biofouling [31] |
| Ethanolamine | Common blocking agent used to deactivate and cap any remaining reactive groups on the sensor surface after ligand immobilization, reducing non-specific binding [6] |
| HEPA Vacuum | Critical for dry-cleaning cleanrooms and instrument surfaces; captures 99.97% of particles ≥0.3μm to prevent environmental contamination [32] |
| Non-Shedding Microfiber Cloths | Used with appropriate cleaning agents for wet-cleaning surfaces without introducing lint or new particles [32] |
Instrument Shutdown and Storage Protocols
Proper procedures for leaving the instrument unattended are crucial for preventing drift upon restart.
- Short-Term (Up to 5 days): Use the "Close" procedure. This involves injections with pure water to prevent salt crystal deposition within the microfluidics, which is a common source of blockages and baseline instability. This procedure takes approximately 11 minutes [31].
- Long-Term (Over 5 days): Use the "Shutdown" procedure. This flushes the entire fluidic path with ethanol to prevent microbial growth and then fills the system with air. This ensures the instrument is preserved in a stable, dry state until its next use. This procedure takes about 10 minutes [31].
- Automated Standby: Modern SPR instruments often feature an automated "Append" or standby mode that can be triggered at the end of an experiment. This maintains a minimal buffer flow for several days, keeping the system hydrated and ready for use without requiring a full shutdown [31].
Optimizing Flow Rate and Dissociation Times to Achieve a Stable Pre-Injection Baseline
A stable baseline is the foundation of reliable SPR data. This guide provides targeted strategies to achieve it.
Achieving a stable baseline before analyte injection is a critical prerequisite for obtaining high-quality, reproducible Surface Plasmon Resonance (SPR) data. Instability during this phase, manifesting as drift, can lead to inaccurate kinetic and affinity measurements. This guide addresses the common challenge of pre-injection baseline drift, focusing on the systematic optimization of flow conditions and system equilibration within the broader context of reducing baseline drift in long-term experiments.
Frequently Asked Questions (FAQs)
Q1: What is considered an acceptable level of baseline drift before I start my experiment? An acceptable baseline drift is typically < ± 0.3 Resonance Units (RU) per minute [20]. Drift exceeding this level suggests the system is not sufficiently equilibrated and requires further stabilization before proceeding with analyte injections [2].
Q2: Why does my baseline drift immediately after I dock a new sensor chip or change the running buffer? This is most commonly due to inadequate system equilibration [2]. A newly docked chip requires rehydration, and chemicals from the immobilization procedure need to be washed out. Similarly, a buffer change introduces a new solvent environment; the previous buffer can mix with the new one in the tubing, causing a wavy baseline until the system is uniformly flushed [2].
Q3: I'm using fresh buffer, but my baseline is still unstable. What could be wrong? While using fresh buffer is essential, proper preparation is key. Buffers should be 0.22 µM filtered and degassed before use to prevent air spikes [2]. Furthermore, storage conditions matter; buffers stored at 4°C contain more dissolved air, which can cause instability. Always degas an aliquot of buffer immediately before use [2].
Q4: How can a high flow rate help stabilize my baseline? A high flow rate is primarily used to minimize mass transport limitations during the binding phase [20]. For baseline stability, initiating a steady flow after a period of stagnation helps equilibrate sensor surfaces that are sensitive to flow changes. The resulting start-up drift typically levels out within 5–30 minutes [2].
Troubleshooting Guide: Pre-Injection Baseline Drift
Step 1: Diagnose the Source of Drift
Begin by observing when the drift occurs. The following table outlines common scenarios and their primary causes.
| Observation | Most Likely Cause | Supporting Evidence |
|---|---|---|
| Drift after docking chip/changing buffer | System not equilibrated | Surfaces need rehydration; chemicals need wash-out; buffer mixing in tubing [2]. |
| Drift after a period of no flow ("start-up drift") | Sensor surface sensitivity to flow initiation | The shift levels out over time (5-30 min) once steady flow is re-established [2]. |
| Consistent, ongoing drift throughout setup | Buffer issues (contamination, improper degassing) or contaminated fluidics | Use of old buffer, improper filtration, or air bubbles can cause continuous instability [2] [5]. |
| Drift after regeneration steps | Regeneration solution affecting the surface | Differences in drift rates between reference and active surfaces can occur post-regeneration [2]. |
Step 2: Implement Corrective Actions and Optimize Flow
Based on your diagnosis, apply the following protocols to stabilize the baseline.
Protocol 1: Comprehensive System Equilibration
- Prime the System: After any buffer change or at the start of a method, always perform a prime procedure to replace the liquid in the pumps and tubing completely [2].
- Flow for Stability: Flow running buffer at your experimental flow rate until a stable baseline (< ± 0.3 RU/min) is achieved [2] [20]. For problematic surfaces, this may require flowing buffer overnight [2] [7].
- Use Start-Up Cycles: Program at least three start-up cycles into your method. These are identical to analyte cycles but inject running buffer instead of your sample, including any regeneration steps. These cycles "prime" the surface and are discarded from the final analysis [2].
Protocol 2: Optimize Flow Rate and Dissociation for Stability
- Stabilize with Flow: For surfaces showing start-up drift, initiate a steady buffer flow and allow 5-30 minutes for the baseline to level out before the first injection [2].
- Incorporate Stabilization Time: If waiting is not feasible, program a short buffer injection followed by a five-minute dissociation period before your first analyte injection. This helps stabilize the baseline [2].
- Address Dissociation-Limited Scenarios: For interactions with very slow dissociation (e.g., kd < 10⁻⁴ s⁻¹), the required dissociation time can be impractically long. In these cases, a 'short and long' injection scheme can minimize overall experimental time while still collecting sufficient data [20].
The following workflow integrates these protocols into a systematic approach for achieving a stable pre-injection baseline.
Step 3: Validate and Reference
Once the baseline is stable, validate the system and employ referencing techniques to account for any minor residual drift.
- Perform Buffer Injections: Inject running buffer alone to observe the system's response. The response should be low (< 5 RU), and the sensorgram should be flat, confirming minimal bulk effect and system noise [20].
- Implement Double Referencing: This two-step procedure is highly effective for compensating for residual drift and bulk effects.
- First, subtract the signal from a reference flow cell from the active flow cell signal.
- Second, subtract the signal from blank (buffer) injections spaced evenly throughout the experiment [2]. This accounts for differences between the reference and active channels over time.
The Scientist's Toolkit: Essential Reagents for Baseline Stability
The following table lists key reagents and their specific roles in establishing a stable SPR baseline.
| Reagent/Solution | Function in Baseline Stabilization |
|---|---|
| Fresh Running Buffer | The foundation. Must be filtered (0.22 µm) and degassed to remove particulates and air bubbles that cause spikes and drift [2]. |
| Detergent (e.g., Surfactant P20) | Added to the running buffer after degassing to reduce non-specific binding and prevent foam formation, which can interfere with the baseline [2]. |
| Regeneration Buffers (e.g., Glycine pH 1.5-2.5, NaOH) | Used in start-up cycles to clean the surface and establish a stable, reproducible state before the first analyte injection [2] [20]. |
| Blocking Agents (e.g., Ethanolamine, BSA, Carboxymethyl Dextran) | Used to occupy any remaining active sites on the sensor chip surface after ligand immobilization, minimizing non-specific binding that can contribute to baseline drift [6] [5]. |
| High-Salt Solutions (e.g., 0.5 M NaCl) | Useful for diagnostic "injection tests" to check for proper sample separation from the flow buffer and to identify issues like carryover [7]. |
For quick reference, the key numerical targets and conditions discussed in this guide are summarized below.
| Parameter | Target Value / Condition | Purpose |
|---|---|---|
| Baseline Drift Rate | < ± 0.3 RU per minute [20] | Indicator of sufficient system equilibration. |
| Buffer Injection Response | < 5 RU [20] | Confirms low system noise and minimal bulk effects. |
| Start-up Cycles | Minimum of 3 cycles [2] | Primes the sensor surface and fluidics. |
| Blank Cycle Frequency | 1 blank per 5-6 analyte cycles [2] | Enables effective double referencing for drift compensation. |
| Start-up Drift Duration | 5 - 30 minutes of flow [2] | Typical time for baseline to level out after flow initiation. |
| Analyte Concentration Range | 0.1 - 10 times the KD [20] | Ensures biologically relevant and analyzable binding curves. |
Advanced Materials and Sensor Architectures for Enhanced Stability
Troubleshooting Guide: Addressing Baseline Drift in Long SPR Experiments
Baseline drift, characterized by a gradual upward or downward trend in the signal in the absence of analyte, is a common challenge that can compromise data quality in long Surface Plasmon Resonance (SPR) runs. The table below outlines the common symptoms, their potential causes, and solutions.
Table 1: Troubleshooting Guide for Baseline Drift in SPR
| Symptom | Potential Cause | Recommended Solution |
|---|---|---|
| Unstable or drifting baseline [5] | Improperly degassed buffer introducing bubbles [5]; System not fully equilibrated [2] | Degas buffer thoroughly before use [5]; Flow running buffer to equilibrate the system until baseline is stable (may require 5-30 minutes or overnight for new surfaces) [2]. |
| Drift after buffer change or sensor chip docking [2] | Buffer mismatch or sensor surface rehydration/equilibration [2] | Prime the system thoroughly after each buffer change; Ensure running buffer hygiene by preparing fresh, filtered buffers daily [2]. |
| Drift after regeneration step [5] | Inefficient regeneration causing carryover or surface damage [5] | Optimize regeneration conditions (pH, ionic strength, buffer composition); Ensure regeneration solution is appropriate for the specific ligand and surface. |
| Drift and high noise [5] | Contaminated buffer or system components; Environmental fluctuations [5] | Use fresh, high-quality, filtered, and degassed buffers [5]; Place the instrument in a stable environment with minimal temperature changes and vibrations [5]. |
| Consistent drift across all channels | Temperature fluctuation affecting the bulk refractive index [6] | Maintain a consistent temperature for the instrument and solutions; Allow sufficient time for the system to thermally equilibrate after start-up. |
Frequently Asked Questions (FAQs)
Q1: How can I improve the reproducibility of my SPR kinetics data across long experiments with multiple cycles? Reproducibility relies on rigorous standardization. Ensure consistent surface activation and ligand immobilization protocols. Always include at least three start-up cycles with buffer injections (and regeneration if used) to "prime" the system before analyte cycles begin; these cycles should not be used in analysis [2]. Incorporate blank (buffer) injections evenly throughout the experiment—approximately one every five to six analyte cycles—to enable robust double referencing and correct for drift and bulk effects [2]. Finally, standardize sample handling and ensure instrument calibration is up to date [6].
Q2: My signal-to-noise ratio degrades over a long run. What steps can I take to stabilize it? A declining signal-to-noise ratio often points to contamination or system instability. First, verify that your buffers are fresh and properly degassed to eliminate bubbles [2] [5]. Check the fluidic system for micro-leaks and ensure all components, including the sensor chip, are clean. To minimize electrical and environmental noise, place the instrument on a stable platform free from vibrations and ensure proper grounding [5]. Using a higher flow rate can sometimes improve mass transport and reduce noise, but this should be optimized for your specific interaction [6].
Q3: What experimental design practices can minimize drift from the outset? A robust experimental design is key to preventing drift. Implement double referencing, which involves subtracting both the signal from a reference flow cell and the signal from blank buffer injections. This corrects for bulk refractive index shifts, drift, and channel-specific differences [2]. Furthermore, adopt a Design of Experiment (DoE) approach for method development. Techniques like Response Surface Methodology (RSM) can be used to systematically optimize critical factors such as flow rate, temperature, and buffer composition, leading to a more robust and drift-resistant assay [33] [34].
Experimental Protocols for Validation and Optimization
Protocol: Systematic Equilibration to Minimize Start-Up Drift
This protocol ensures the SPR instrument and sensor surface are fully stabilized before critical data collection begins.
- Buffer Preparation: Prepare a sufficient volume of running buffer for the entire experiment. Filter the buffer through a 0.22 µM filter and degas it thoroughly. Avoid adding fresh buffer to old stock [2].
- System Priming: Prime the entire fluidic system with the fresh, degassed running buffer.
- Initial Equilibration: Start a constant flow of running buffer at the intended flow rate for the experiment. Monitor the baseline signal.
- Start-Up Cycles: Program and execute at least three "start-up cycles." These are identical to your experimental cycles but inject running buffer instead of analyte. Include a regeneration step if your method uses one [2].
- Stability Check: Observe the baseline before the first injection of each start-up cycle. The system is equilibrated when the baseline is stable with minimal drift (e.g., < 1 RU over 5-10 minutes). Proceed with the experiment once stability is confirmed.
Protocol: Optimizing Assay Conditions Using a DoE Approach
This methodology uses a structured approach to find the optimal conditions that maximize signal-to-noise and reproducibility while minimizing drift.
- Identify Critical Factors: Select key variables for optimization (e.g., Flow Rate, Immobilization pH, Buffer Ionic Strength, Concentration of Additives like Tween-20).
- Select a DoE Model: Choose an appropriate experimental design, such as a Box-Behnken Design (BBD), which efficiently explores multiple factors at different levels without testing every possible combination [34].
- Define Responses: Determine the measurable outputs you want to optimize. For assay robustness, key responses include:
- Baseline Drift (RU/min)
- Signal-to-Noise Ratio for a standard analyte injection
- Reproducibility (e.g., % Coefficient of Variation of replicate analyte binding responses)
- Execute Experiments: Run the experiments as dictated by the DoE matrix.
- Analyze Data and Build Model: Use statistical software to perform Multiple Linear Regression (MLR) and build models that describe how the factors influence your responses [34].
- Find the Optimum: Use the models to identify the factor settings that simultaneously minimize drift and maximize signal-to-noise and reproducibility.
Table 2: Key Research Reagent Solutions for SPR Assay Development
| Reagent / Material | Function in SPR Experiment |
|---|---|
| CM5 Sensor Chip | A carboxymethylated dextran matrix commonly used for covalent immobilization of ligands (e.g., proteins) via amine coupling [6]. |
| NTA Sensor Chip | For capturing His-tagged proteins via nickel chelation, allowing for oriented immobilization and surface regeneration [6]. |
| SA Sensor Chip | Coated with streptavidin for capturing biotinylated ligands, another method for oriented immobilization [6]. |
| EDC/NHS Chemistry | Activates carboxyl groups on the sensor surface (e.g., CM5 chip) to form reactive esters for covalent ligand coupling [6]. |
| Ethanolamine | Used to "block" or deactivate remaining reactive ester groups on the sensor surface after ligand immobilization, reducing non-specific binding [6]. |
| HBS-EP Buffer | A common running buffer (HEPES buffered saline with EDTA and a surfactant) that provides a consistent chemical environment and helps minimize non-specific binding. |
| Surfactant P20 | A detergent additive (e.g., Tween-20) to running buffer to reduce non-specific binding to the sensor chip surface [6]. |
Signaling Pathways and Workflow Diagrams
SPR Robustness Optimization Workflow
DoE for SPR Assay Development
FAQs: Addressing Common Challenges in SPR Experiments
FAQ 1: What are the primary causes of baseline drift in SPR experiments, and how can they be minimized? Baseline drift, where the signal is unstable in the absence of analyte, is often caused by an inadequately equilibrated sensor surface, temperature fluctuations, or mismatched buffers between the running buffer and the sample [7] [5]. To minimize drift, ensure the system is well-equilibrated by running the flow buffer for an extended period, sometimes overnight, or performing several buffer injections before the actual experiment [7]. Crucially, the buffer composition of the injected analyte must precisely match that of the running buffer to avoid bulk shifts [7]. Using a high-quality, degassed buffer and maintaining a stable instrument environment are also essential [5].
FAQ 2: How does surface chemistry design influence non-specific binding and signal stability? Surface chemistry design is critical for minimizing non-specific binding (NSB), which can destabilize the baseline and obscure specific signals. A common strategy involves using mixed self-assembled monolayers (SAMs). For instance, combining a long-chain thiol like DSP with a shorter-chain thiol like MCH can reduce steric hindrance and minimize non-specific interactions [35]. Furthermore, blocking the sensor surface with suitable agents like BSA or ethanolamine after ligand immobilization can passivate unused active sites [5]. Advanced surfaces, such as those incorporating a polycarboxylate hydrogel, have been shown to improve performance in complex matrices like serum and plasma by reducing fouling [36].
FAQ 3: What routine maintenance is essential for ensuring long-term instrument stability and data quality? Regular maintenance is vital for consistent, reliable results. A summary of key maintenance tasks is provided below [31]:
Table: Recommended SPR Instrument Maintenance Schedule
| Task | Frequency | Time Needed | Purpose |
|---|---|---|---|
| Syringe Inspection | Daily | 2 minutes | Ensure no air bubbles or leaks |
| Unclogging | Daily | 4 minutes | Remove small air bubbles and particles from fluidics |
| Injection Port Cleaning | Weekly | 5 minutes | Prevent build-up of salt deposits |
| Desorb | Weekly | 22 minutes | Remove adsorbed proteins from IFC and autosampler |
| Superdesorb | Monthly | 90 minutes | Perform a thorough cleaning with multiple solutions |
| Sanitize | Monthly | 45 minutes | Remove micro-organisms from the fluidic system |
FAQ 4: My sensor response is dropping during analyte injection. What could be the issue? A dropping response during injection can indicate sample dispersion, where the sample mixes with the flow buffer, resulting in an effectively lower analyte concentration [7]. To troubleshoot, check and utilize the instrument's specific routines to properly separate the flow buffer from the sample. You can verify the system's performance by injecting a high-salt solution (e.g., 0.5 M NaCl), which should produce a sharp rise and fall in the signal, and a flat line for a flow buffer injection [7].
FAQ 5: What are the advantages of using novel materials like MXenes or specialized hydrogels in sensor chips? Novel materials can significantly enhance sensor performance. Research shows that MXenes (e.g., Ti₃C₂Tₓ) can intensify surface charge oscillations and confine the evanescent field, leading to a dramatic increase in sensitivity (e.g., angular sensitivity raised to 254–312° RIU⁻¹) while maintaining low optical loss [37]. This contributes to a lower limit of detection, crucial for resolving minute refractive index changes. From a practical standpoint, commercially available chips with polycarboxylate hydrogels offer improved performance in complex biological matrices like serum and plasma, which directly enhances the reliability of data collected in drug development applications [36].
Troubleshooting Guide: Step-by-Step Experimental Protocols
Protocol 1: System Equilibration and Bulk Shift Correction
Objective: To establish a stable baseline at the start of an experiment, minimizing drift caused by surface inequilibrium or buffer mismatch.
Materials:
- SPR instrument primed with running buffer.
- Sensor chip (dummy or functionalized).
- Running buffer (degassed).
- Analyte sample prepared in the running buffer.
Procedure:
- Initial Prime: Prime the entire fluidic system with degassed running buffer.
- Extended Equilibration: Initiate a constant flow of buffer over the sensor surface. Monitor the baseline signal. For a new or recently cleaned surface, significant drift may occur initially. Allow the system to equilibrate until the baseline drift falls below an acceptable threshold (e.g., < 5 RU/min). This may require 30 minutes to several hours, sometimes even overnight for very stubborn surfaces [7].
- Buffer Matching Check: If a sudden, sharp shift is observed at the beginning or end of an analyte injection, this indicates a bulk shift due to buffer mismatch [7].
- Corrective Action: Re-prepare the analyte solution, ensuring it is dialyzed or diluted into the running buffer to match pH, ionic strength, and composition exactly.
- Pre-injection Pulses: Perform several short injections of running buffer (or a low-concentration analyte sample in running buffer) before the actual experiment to pre-condition the surface and fluidics.
Protocol 2: Surface Cleaning and Regeneration
Objective: To remove adsorbed materials from the sensor chip and fluidic system without damaging the surface chemistry.
Materials:
- SPR Maintenance Kit (typically includes 0.5% SDS, 50 mM Glycine pH 9.5, and other cleaning solutions) [38].
- Dummy chip or a chip dedicated to cleaning procedures.
- Deionized water.
Procedure:
- Insert Dummy Chip: Before using harsh chemicals, insert a dummy chip to protect the detector [31].
- Weekly Desorb: Run the "Desorb" protocol as per your instrument's instructions. This typically involves injecting a protein-destaining solution like SDS, followed by a series of water and buffer washes to remove adsorbed proteins from the integrated fluidic cartridge (IFC) and autosampler [31].
- Monthly Superdesorb: For a more thorough cleaning, perform a "Superdesorb" monthly. A sample protocol is [31]:
- Prime with 0.5% SDS (3 times).
- Prime with 50 mM Glycine-NaOH, pH 9.5 (3 times).
- Prime with warm Deionized water (40°C, 5 times).
- Prime with running buffer (2 times).
- Sanitize: Monthly, run the "Sanitize" protocol using a hypochlorite solution to remove microbial growth from the system [31].
Protocol 3: Evaluating Surface Homogeneity and Detector Performance
Objective: To verify the quality of the sensor surface and the proper functioning of the optical detection system.
Materials:
- Freshly cleaned sensor chip.
- Running buffer.
Procedure:
- Baseline Recording: With a clean chip installed and the system filled with buffer, record a stable baseline and observe the reflectance dip.
- Dip Analysis: The instrument's software typically displays the reflectance curve. A normal, homogeneous surface should produce a sharp, deep dip (e.g., reflectance down to ~10,000 RU) [31].
- Troubleshooting Dips:
- Shallow Dip: A shallow, broad dip can indicate surface heterogeneity, which may be caused by tiny air bubbles, a dirty surface, or uneven chemical modification. Flushing with buffer at a high flow rate can dislodge bubbles. If the problem persists, a more aggressive cleaning may be needed [31].
- Missing Dip: If the dip is absent or shifted beyond the dynamic range, it could be due to a large refractive index change or a major surface defect [31].
- Functional Test: Inject an elevated NaCl solution (0.5 M). The sensorgram should show a sharp rise and fall with a flat steady state, indicating good fluidic and detector response [7].
The Scientist's Toolkit: Research Reagent Solutions
This table details key materials and reagents essential for performing low-drift SPR experiments, from surface preparation to maintenance.
Table: Essential Reagents for SPR Sensor Chip Preparation and Maintenance
| Item | Function / Application | Specific Example / Rationale |
|---|---|---|
| SPR Maintenance Kit [38] | Weekly and monthly cleaning of microfluidic tubing and IFC to remove adsorbed protein and prevent microbial growth. | Typically contains 0.5% SDS and 50 mM Glycine pH 9.5 for desorbing biological material. Used with a maintenance chip. |
| 11-Mercaptoundecanoic acid (11-MUA) [35] | Forms a carboxyl-terminated self-assembled monolayer (SAM) on gold surfaces for covalent immobilization of ligands via amine coupling. | Provides a long, hydrophilic spacer chain that reduces steric hindrance and offers a terminal carboxylic acid for EDC/NHS chemistry. |
| Mixed SAMs (e.g., DSP + MCH) [35] | To reduce non-specific binding and steric hindrance by creating a well-ordered, diluted surface for ligand attachment. | DSP provides an NHS-ester for ligand coupling, while MCH is a shorter diluent thiol that creates space and passivates the surface. |
| Blocking Agents (BSA, Ethanolamine) [5] | Passivates unreacted active groups on the sensor surface after ligand immobilization to minimize non-specific binding. | BSA is a common protein-based blocker; ethanolamine is a small molecule used to block NHS-ester groups after coupling. |
| Polycarboxylate Hydrogel Surface [36] | A ready-to-use sensor chip chemistry that improves performance in complex matrices like serum and plasma. | The hydrogel layer reduces fouling and non-specific binding from complex samples, enhancing data reliability. |
| Regeneration Solutions [5] | Removes bound analyte from the immobilized ligand without destroying ligand activity, enabling chip re-use. | Common solutions include low pH (e.g., Glycine-HCl, pH 2.0), high pH (e.g., Glycine-NaOH, pH 9.5), or high salt. |
Comparative Performance Data: Sensor Chips and Surface Chemistries
The following table summarizes key performance metrics for different sensor chip designs and materials as identified in the literature, providing a basis for selection.
Table: Comparative Analysis of Sensor Chip Surface Chemistries and Materials
| Sensor Chip / Surface Design | Key Performance Characteristics | Reported Advantages / Applications |
|---|---|---|
| Conventional Gold with SAM (e.g., 11-MUA) [35] | Well-established chemistry. Performance depends on SAM quality and ligand density. | High ligand immobilization capacity. Flexible for various coupling chemistries. Can suffer from NSB in complex samples. |
| Mixed SAMs (e.g., DSP + MCH) [35] | Reduced steric hindrance and minimized non-specific interactions compared to pure SAMs. | Improved orientation and accessibility of immobilized ligands. Demonstrated for immunosensing (e.g., thrombin detection in nM range). |
| Copper with Si₃N₄ & MXene (Theoretical) [37] | High angular sensitivity (254–312° RIU⁻¹), Quality Factor (30–58 RIU⁻¹), Low detection limit (~2×10⁻⁵ RIU). | Low-cost alternative to gold. MXene enhances field confinement and sensitivity. Potential for highly sensitive cancer biomarker detection. |
| Polycarboxylate Hydrogel Chip [36] | Improved measurements in complex matrices (serum, plasma). 16-plex measurements on a reusable sensor. | Designed for high performance in biologically relevant fluids. Suitable for multiplexed analysis with limited sample volume. |
| MXene (Ti₃C₂Tₓ) Sheet on Metal [37] [35] | Intensifies surface plasmon confinement. High carrier density and tunable permittivity. | Can be stacked with dielectrics (e.g., Si₃N₄) to balance sensitivity and optical loss. Offers sites for biochemical functionalization. |
FAQ: Hybrid SPR-FET Systems and Baseline Drift
1. What is baseline drift in SPR experiments and why is it particularly problematic in long-term measurements?
Baseline drift refers to the unstable or gradual shifting of the signal when no analyte is present. In long experiments, this instability makes it difficult to distinguish true binding signals from background noise, compromising data accuracy for kinetic parameter calculation. In hybrid SPR-FET systems, this is compounded by potential electronic drift from the FET components, requiring dual-mode correction strategies [5].
2. How does the hybrid SPR-FET system correct for drift differently than traditional SPR instruments?
While traditional SPR relies on optical reference channels and buffer matching for drift correction, the hybrid SPR-FET system employs a dual-mechanism approach. The SPR optical channel monitors mass-based interactions, while the FET component simultaneously tracks electronic properties and charge distributions. By cross-referencing these simultaneous data streams, the system can distinguish true biomolecular binding events (which affect both signals) from instrumental or environmental drift (which may affect only one), enabling more precise correction [39].
3. What are the most critical pre-experimental considerations to minimize baseline drift in hybrid systems?
The key considerations include:
- Buffer Selection and Degassing: Carefully formulate buffers to maintain molecular stability and prevent bubble formation, which is a common cause of optical drift. Always degas buffers thoroughly before use [5] [6].
- Sensor Chip Preparation: Ensure proper cleaning and preconditioning of the hybrid sensor surface. Contaminants on either the optical or electronic sensing elements can cause significant drift [6].
- Environmental Stabilization: Place the instrument in a stable environment with minimal temperature fluctuations and vibrations, as both optical and electronic components are sensitive to these changes [5].
- System Calibration: Perform comprehensive calibration of both SPR and FET subsystems before experiments, ensuring proper synchronization between optical and electronic measurement channels [5].
4. What specific issues should I troubleshoot if my hybrid system shows inconsistent data between optical and electronic channels?
First, verify that your analyte concentration is appropriate for both detection modalities. Next, check for non-specific binding that might affect one channel more than the other. Confirm that the sensor surface is properly regenerated between runs, as residual material can cause discrepancies. Also, ensure your sample buffer is compatible with both systems—some additives that reduce optical non-specific binding may interfere with electronic measurements [6] [12].
Troubleshooting Guide: Common Hybrid SPR-FET System Issues
Table 1: Baseline and Signal Issues Troubleshooting
| Problem | Potential Causes | Solutions | Preventive Measures |
|---|---|---|---|
| Baseline Drift | Buffer not degassed; Temperature fluctuations; System leaks; Electronic instability | Degas buffer thoroughly; Use temperature stabilization chamber; Check fluidic system for leaks; Calibrate FET bias points | Allow system to thermally equilibrate; Use fresh, filtered buffers; Implement environmental monitoring [5] [6] |
| High Non-Specific Binding | Improper surface blocking; Incompatible buffer conditions; Sensor surface contamination | Optimize blocking agents (BSA, ethanolamine); Adjust buffer ionic strength/additives; Implement more stringent regeneration protocols | Use appropriate reference surfaces; Pre-test samples for aggregation; Standardize surface preparation protocols [5] [12] |
| Signal Saturation | Analyte concentration too high; Ligand density too high; Detector gain misconfigured | Dilute analyte; Reduce ligand immobilization density; Adjust detection parameters on both SPR and FET channels | Perform concentration series pilot studies; Optimize immobilization levels; Verify detector linearity ranges [5] [6] |
| Inconsistent SPR-FET Correlation | Different sensitivity profiles; Non-uniform surface functionalization; Desynchronized data acquisition | Characterize relative sensitivity of each modality; Verify uniform surface modification; Synchronize data acquisition timing | Map correlation factors using standard samples; Implement quality control for surface fabrication; Validate time alignment with reference samples [6] |
| Poor Reproducibility | Inconsistent sample handling; Variable immobilization efficiency; Sensor surface degradation | Standardize sample preparation protocols; Control immobilization conditions; Monitor surface performance with standards | Implement rigorous SOPs; Use control samples in each run; Track surface history and regeneration cycles [5] [6] |
Table 2: Regeneration and Surface Issues
| Problem | Potential Causes | Solutions | Preventive Measures |
|---|---|---|---|
| Incomplete Regeneration | Too mild regeneration conditions; Insufficient regeneration time; Strong non-covalent interactions | Optimize regeneration buffer (pH, ionic strength); Increase regeneration time/flow rate; Use stepwise regeneration with increasing stringency | Perform regeneration scouting with standard samples; Use sufficient regeneration volume; Validate with negative controls post-regeneration [5] [12] |
| Carryover Between Cycles | Residual bound analyte; Memory effects in fluidics; Non-specific adsorption to tubing | Implement more stringent regeneration protocol; Include wash steps with different buffers; Use surfactant in wash buffers | Include system wash steps between samples; Verify lack of carryover with blank injections; Use dedicated fluidic paths for problematic samples [12] [7] |
| Surface Degradation | Harsh regeneration conditions; Repeated regeneration cycles; Chemical incompatibility | Gentle regeneration conditions where possible; Monitor surface activity over time; Consider more durable surface chemistry | Limit number of regeneration cycles per chip; Use sacrificial surfaces for method development; Follow manufacturer's storage recommendations [5] [6] |
| Flow Artifacts | Bubbles in fluidic system; Unstable flow rates; Particulate contamination | Purge bubbles from system; Check pump performance and tubing integrity; Filter all samples and buffers | Implement bubble traps; Use pulse-dampening on pumps; Regular maintenance of fluidic components [5] [7] |
Experimental Protocols for Drift Minimization
Protocol 1: System Preparation and Baseline Stabilization
Materials:
- HBS-EP buffer (10 mM HEPES, 150 mM NaCl, 3 mM EDTA, 0.05% surfactant P20, pH 7.4)
- Degassing apparatus or vacuum chamber
- Temperature control system
- Hybrid SPR-FET sensor chips
- Calibration standards
Procedure:
- Buffer Preparation and Degassing:
- Prepare fresh buffer using high-purity water and analytical grade reagents.
- Filter through 0.22 μm membrane filter.
- Degas for 30-45 minutes with continuous stirring under vacuum.
- Verify pH after degassing and adjust if necessary.
System Priming and Equilibration:
- Prime the fluidic system with degassed buffer, ensuring no bubbles are introduced.
- Initiate flow at the recommended rate (typically 10-30 μL/min).
- Allow system to thermally equilibrate for at least 1-2 hours before data collection.
- Monitor both SPR and FET baseline signals until stability criteria are met (<0.5 RU/min drift for SPR, <0.1 mV/min for FET).
Dual-Modality Calibration:
- Inject calibration standards while monitoring both SPR and FET responses.
- Verify correlation between optical and electronic signals.
- Adjust synchronization parameters if necessary to ensure temporal alignment.
Surface Conditioning (if using new chip):
Protocol 2: Surface Functionalization for Hybrid SPR-FET
Materials:
- EDC (1-ethyl-3-(3-dimethylaminopropyl)carbodiimide)
- NHS (N-hydroxysuccinimide)
- Ethanolamine hydrochloride (1 M, pH 8.5)
- Ligand solution (1-10 μg/mL in appropriate buffer)
- HBS-EP buffer
Procedure:
- Surface Activation:
- Prepare fresh mixture of EDC (0.4 M) and NHS (0.1 M) in water.
- Inject activation mixture over sensor surface for 7-15 minutes.
- Monitor activation level to ensure consistent surface properties.
Ligand Immobilization:
- Dilute ligand in appropriate immobilization buffer (typically pH 4.5-5.5 for amine coupling).
- Inject ligand solution for sufficient time to achieve desired immobilization level.
- Target appropriate density (typically 5000-15000 RU for SPR correlation).
- Monitor FET response during immobilization to ensure proper surface modification.
Surface Blocking:
- Inject ethanolamine (1 M, pH 8.5) for 7-15 minutes to block unreacted groups.
- Verify that blocking step does not cause significant additional binding.
Surface Validation:
Research Reagent Solutions
Table 3: Essential Materials for Hybrid SPR-FET Experiments
| Reagent/Category | Specific Examples | Function/Purpose | Optimization Tips |
|---|---|---|---|
| Sensor Chips | CM5 (carboxymethylated dextran); NTA (nitrilotriacetic acid); SA (streptavidin) | Provides surface for ligand immobilization; CM5 offers high capacity, NTA for His-tagged proteins, SA for biotinylated ligands | Match chip type to immobilization strategy; CM5 works well with amine coupling; Consider specialized chips for challenging applications [6] [40] |
| Coupling Reagents | EDC (1-ethyl-3-(3-dimethylaminopropyl)carbodiimide); NHS (N-hydroxysuccinimide) | Activates carboxylated surfaces for covalent ligand immobilization via amine groups | Use fresh solutions; Optimize EDC:NHS ratio and activation time; Avoid over-activation to prevent non-specific binding [40] |
| Blocking Agents | Ethanolamine (1 M, pH 8.5); BSA (Bovine Serum Albumin); Casein | Blocks remaining active groups after immobilization to reduce non-specific binding | Ethanolamine standard for amine coupling; BSA or casein may be better for reducing protein non-specific binding; Optimize concentration and incubation time [6] [12] |
| Running Buffers | HBS-EP (HEPES with EDTA & surfactant); PBS with 0.05% Tween-20 | Maintains pH and ionic strength; Surfactant reduces non-specific binding; EDTA prevents metal-catalyzed oxidation | Always degas before use; Filter through 0.22 μm membrane; Avoid high additive concentrations that might interfere with FET measurements [5] [6] |
| Regeneration Solutions | Glycine-HCl (10-100 mM, pH 2.0-3.0); NaOH (10-100 mM); High salt (1-3 M NaCl) | Removes bound analyte without damaging immobilized ligand; Regenerates surface for multiple cycles | Perform scouting to identify optimal regeneration solution; Use mildest effective conditions; Monitor surface stability over multiple cycles [5] [12] |
System Workflow and Signaling Pathways
Diagram 1: Hybrid SPR-FET Drift Correction Mechanism
Diagram 2: Experimental Workflow for Drift Minimization
Frequently Asked Questions (FAQs)
Q1: What is baseline drift in SPR experiments, and why is it a problem? Baseline drift is the instability of the signal recorded in the absence of analyte. It is often a sign of a non-optimally equilibrated sensor surface and can be caused by rehydration of a new sensor chip, wash-out of immobilization chemicals, or adjustment of the bound ligand to the flow buffer [2]. Drift complicates data analysis and can lead to erroneous results, making it a critical issue to resolve for accurate measurements, especially in long-term experiments [2].
Q2: How can novel materials like MXenes help improve SPR sensor stability? MXenes are two-dimensional transition-metal carbides and nitrides that can be used to augment traditional plasmonic metals. When integrated into the sensor stack, for example as a sub-nanometre sheet, they can intensify near-field confinement without severe damping [41] [37]. Furthermore, these materials, along with dielectric spacers like silicon nitride, can act as protective coatings for more sensitive plasmonic metals like copper, shielding them from oxidation and thereby enhancing the overall stability and longevity of the sensor [41] [37].
Q3: My sensorgram shows a large, sudden signal shift upon analyte injection. Is this a "bulk effect" and how can I correct for it? Yes, a large signal change upon injection is characteristic of a bulk response. This effect occurs because the evanescent field of the surface plasmon extends hundreds of nanometers into the solution, detecting changes in the refractive index of the liquid bulk, even from molecules that do not bind to the surface [42]. Properly subtracting this contribution is essential for accurate data. Advanced correction methods that use the total internal reflection (TIR) angle response from the same sensor surface have been developed, providing a more accurate bulk correction than traditional reference channel subtraction alone [42].
Q4: Besides gold, what other plasmonic metals are being researched for stable SPR biosensors? Research has expanded to other competitive plasmonic materials. Copper is notable for generating narrower resonance dips due to lower intraband damping, which raises angular sensitivity [41] [37]. The main challenge is its tendency to oxidize, which can be mitigated by using ultrathin diffusion barriers and protective layers [41]. Aluminum is another material gaining attention for its cost-effectiveness, CMOS compatibility, and ability to exhibit a plasmonic response across a wide electromagnetic spectrum [43].
Troubleshooting Guide
Baseline Instability
| Symptom | Possible Cause | Recommended Solution |
|---|---|---|
| Continuous signal drift after docking a new sensor chip [2] | Surface rehydration or wash-out of chemicals [2] | Equilibrate the surface by flowing running buffer for an extended period (e.g., overnight) [2]. |
| Drift after a change in running buffer [2] | Improper system equilibration and buffer mixing [2] | Prime the system thoroughly after each buffer change and wait for a stable baseline before starting experiments [2]. |
| Drift after a flow standstill [2] | Sensor surface susceptibility to flow changes [2] | Allow the system to stabilize with constant flow for 5–30 minutes before analyte injection [2]. |
| General unstable baseline [5] | Presence of air bubbles or contaminated buffer [5] | Ensure buffer is properly degassed and filtered; use fresh buffer daily and avoid adding new buffer to old stock [2] [5]. |
Signal Anomalies
| Symptom | Possible Cause | Recommended Solution |
|---|---|---|
| No significant signal change upon injection [5] | Low analyte concentration or low ligand immobilization level [5] | Verify analyte concentration is appropriate and optimize the ligand immobilization density [5]. |
| Weak binding signal [5] | Low ligand activity or suboptimal binding kinetics [5] | Check ligand functionality and integrity; consider optimizing flow rate or association time [5]. |
| Signal saturation too quickly [5] | Analyte concentration too high or ligand density too high [5] | Reduce analyte concentration or injection time; optimize ligand density to a lower level [5]. |
| High non-specific binding [5] | Inadequate surface blocking [5] | Block the sensor surface with a suitable agent (e.g., BSA); optimize regeneration steps [5]. |
Experimental Protocols for Enhanced Stability
Protocol 1: Fabrication of an MXene-Copper-Silicon Nitride Sensor Stack
This protocol outlines the theoretical design and fabrication steps for a stable, high-sensitivity SPR biosensor platform, based on computational research [41] [37].
1. Design and Simulation:
- Configuration: Use the Kretschmann configuration for modeling.
- Stack Optimization: Employ a transfer-matrix method to simulate and optimize the layer-by-layer structure. The optimal configuration may consist of:
- A BK7 glass prism as the coupling element.
- A 40-45 nm copper film as the plasmonic metal layer.
- A ~7 nm silicon nitride (Si₃N₄) spacer layer to confine the evanescent field and protect the copper.
- One to two sheets of MXene (e.g., Ti₃C₂Tx, ~0.93 nm per layer) on top to enhance surface charge oscillations and provide functionalization sites [41] [37].
2. Fabrication Steps:
- Metal Deposition: Deposit the optimized copper film thickness onto the prism using standard sputtering techniques.
- Dielectric Coating: Apply the silicon nitride layer via sputtering or spin-coating to create a protective, high-index spacer.
- MXene Transfer: Transfer the synthesized MXene sheets onto the silicon nitride layer to complete the sensor stack.
Protocol 2: System Equilibration to Minimize Baseline Drift
A proper experimental setup is crucial for minimizing baseline drift in any SPR experiment [2].
1. Buffer Preparation:
- Prepare running buffer fresh daily.
- Filter through a 0.22 µM filter and degas thoroughly before use.
- Store buffers in clean, sterile bottles. Do not add fresh buffer to old stock.
2. System Priming and Equilibration:
- After docking the sensor chip, prime the system with the new running buffer multiple times.
- Maintain a steady flow of running buffer until the baseline signal is stable. This may take 5–30 minutes, or in some cases, overnight [2].
- If drift is observed after a flow standstill, allow the system to stabilize with constant flow before starting injections.
3. Incorporating Start-up and Blank Cycles:
- Add at least three start-up cycles to your experimental method. These are identical to analyte cycles but inject only running buffer. Perform any regeneration steps as normal. Do not use these cycles for data analysis [2].
- Intersperse blank injections (buffer alone) evenly throughout the experiment, approximately one blank for every five to six analyte cycles. These are used for double referencing during data analysis [2].
Research Reagent Solutions
The following table details key materials used in the development of novel, stable SPR sensors.
| Material | Function in SPR Sensor | Key Characteristic |
|---|---|---|
| Copper (Cu) [41] [37] | Plasmonic metal layer | Lower intraband damping than gold, leading to narrower resonance dips and higher theoretical sensitivity; more cost-effective. |
| Silicon Nitride (Si₃N₄) [41] [37] | Dielectric spacer and protective layer | High refractive index, low optical loss, and chemical stability. Confines evanescent field and protects copper from oxidation. |
| MXene (e.g., Ti₃C₂Tx) [41] [37] | 2D nanomaterial enhancer | Metallic conductivity, high carrier density, and tunable surface chemistry. Intensifies plasmonic field and offers functionalization sites. |
| Gold (Au) [44] | Traditional plasmonic metal | Excellent chemical stability, resistance to oxidation, and well-established surface functionalization chemistry. The benchmark material. |
| Vanadium Pentoxide (V₂O₅) [44] | Adhesion layer in PCF-SPR sensors | Nanolayer that improves adhesion between gold and silica, enhancing structural stability and field confinement. |
Performance Data of Novel Material Stacks
The integration of novel materials is primarily validated through simulation before fabrication. The table below summarizes the predicted performance of an MXene-enhanced stack compared to a traditional copper-only setup for cancer biomarker detection [41] [37].
Table: Simulated Performance of MXene-Copper SPR Sensor Stacks (at 633 nm wavelength)
| Sensor System Configuration | Angular Sensitivity (deg/RIU⁻¹) | Quality Factor (RIU⁻¹) | Limit of Detection (RIU) |
|---|---|---|---|
| Sys₁: Cu Prism + Cu Film + PBS [41] [37] | (Baseline) | - | - |
| Sys₂: Cu + Si₃N₄ Spacer [41] [37] | ~6% improvement over Sys₁ | - | - |
| Sys₃: Cu + Si₃N₄ + 2x MXene [41] [37] | 254 (for breast-T2 model) | 30-35 | ~2.0 x 10⁻⁵ |
| Sys₄: Cu + MXene [41] [37] | 312 (for breast-T2 model) | 48-58 | ~2.0 x 10⁻⁵ |
Algorithmic and Multi-Objective Optimization in SPR Sensor Design for Minimized Drift
Troubleshooting Guide: Resolving Baseline Drift in SPR Experiments
Q1: What are the primary causes of baseline drift, and how can I resolve them? Baseline drift is a common sign of a non-optimally equilibrated sensor surface or system [2] [7]. The table below summarizes the main causes and their solutions.
Table 1: Troubleshooting Guide for Baseline Drift
| Issue | Possible Cause | Recommended Solution |
|---|---|---|
| High Baseline Drift | Sensor surface not fully equilibrated [2]. | Flow running buffer overnight to equilibrate the surface [2] [7]. |
| System not stabilized after buffer change or start-up [2]. | Prime the system after each buffer change and wait for a stable baseline [2] [5]. | |
| Unstable buffer temperature or composition [5]. | Ensure buffers are fresh, properly degassed, and 0.22 µM filtered daily [2] [5]. | |
| Drift After Immobilization | Rehydration of surface or wash-out of chemicals [2]. | Incorporate several "start-up" or "dummy" buffer injection cycles before the actual experiment [2]. |
| Drift in Reference Channel | Differences between reference and active surfaces after regeneration [2]. | Use double referencing to compensate for drift differences between channels [2]. |
Q2: How can I minimize noise and fluctuations in my baseline? A stable baseline is crucial for high-resolution data. Key strategies include preparing fresh, filtered, and degassed buffers each day to prevent contamination and air spikes [2]. Ensure the instrument is in a stable environment with minimal temperature fluctuations and vibrations, and is properly grounded to reduce electrical noise [5]. Before starting experiments, equilibrate the system by flowing running buffer and injecting buffer several times to determine the noise level and stabilize the baseline [2].
FAQs on Advanced Sensor Design and Optimization
Q3: How can algorithmic optimization improve my SPR sensor design? Traditional design methods, which vary one parameter at a time, struggle with complex, multi-layer sensors. Algorithmic multi-objective optimization overcomes this by simultaneously balancing multiple, often competing, performance criteria. For instance, a Non-dominated Sorting Genetic Algorithm II (NSGA II) can optimize a sensor's sensitivity, full width at half maximum (FWHM—which affects detection accuracy), and minimum reflectivity level all at once [45]. This approach efficiently navigates the vast parameter space (e.g., metal thickness, number of 2D material layers) to find the best possible compromise for a robust, high-performance design [45].
Q4: What role do new materials play in enhancing sensor stability and sensitivity? Integrating novel materials like 2D materials (e.g., graphene, MXene) and specific semiconductors can significantly boost performance. These materials can intensify the surface plasmon field, leading to higher sensitivity. For example:
- MXene-Coated Copper: A Kretschmann configuration using a copper layer augmented with MXene and a thin silicon nitride spacer has demonstrated high angular sensitivity (up to 312°/RIU) while keeping optical loss below 8-9% [37]. The dielectric layer also acts as a protective barrier, improving the chemical stability of the copper platform [37].
- Semiconductor and 2D Material Stacks: Optimizing a structure with silver, a semiconductor layer (e.g., Barium Titanate or Silicon), and 2D materials like graphene or WS₂ can achieve high sensitivity (up to 302 deg/RIU) with a narrow FWHM for precise detection [45].
Q5: Can Machine Learning (ML) help beyond the initial design phase? Yes, ML is also being applied to enhance data processing. For phase-sensitive SPR imaging, a novel PPBM4D denoising algorithm has been developed. This algorithm leverages correlations between different polarization images to suppress instrumental noise, achieving a refractive index resolution of (1.51 \times 10^{-6}) RIU without compromising temporal resolution, which is vital for observing rapid binding dynamics [46].
Experimental Protocols for a Stable and Sensitive SPR System
Protocol 1: System Equilibration and Baseline Stabilization
This protocol is essential before starting any data collection to minimize drift [2] [7].
- Buffer Preparation: Prepare a fresh running buffer on the day of the experiment. Filter it through a 0.22 µM filter and degas it thoroughly to remove dissolved air that can cause spikes [2].
- System Priming: Prime the fluidic system several times with the new running buffer to remove any residue from previous buffers [2] [5].
- Surface Equilibration: Dock a new sensor chip and begin a continuous flow of running buffer at your experimental flow rate. Monitor the baseline.
- Start-up Cycles: Program at least three "start-up cycles" into your method. These are identical to your experimental cycles but inject only running buffer instead of analyte. If a regeneration step is used, include it. Do not use these cycles for data analysis [2].
- Baseline Confirmation: Wait until the baseline signal is stable (flat and with low noise) before commencing analyte injections [2].
Protocol 2: A Multi-Objective Optimization Workflow for Sensor Design
This protocol outlines how to algorithmically optimize a multi-layer SPR sensor design [45].
- Define Sensor Architecture: Specify the multilayer structure (e.g., BK7 prism / Ag layer / BaTiO₃ semiconductor / WS₂ monolayer / Sensing medium).
- Set Objectives and Parameters:
- Objectives: Define the key performance metrics to optimize (e.g., Maximize Sensitivity, Minimize FWHM, Minimize Reflectivity at resonance).
- Parameters: Define the design variables (e.g., Ag thickness (40-60 nm), Semiconductor thickness (5-15 nm), Number of 2D material monolayers (1-5)).
- Implement Optimization Algorithm: Use a multi-objective genetic algorithm like NSGA II. The algorithm will use a transfer-matrix method (TMM) to simulate the optical response of thousands of potential designs.
- Analyze Results and Fabricate: The algorithm outputs a "Pareto front" – a set of optimal trade-offs between your objectives. Select the design that best fits your application needs and proceed with fabrication.
The following workflow diagram illustrates the iterative optimization process.
The Scientist's Toolkit: Key Research Reagent Solutions
Table 2: Essential Materials for Advanced SPR Sensor Fabrication and Experimentation
| Material / Reagent | Function / Explanation | Application Context |
|---|---|---|
| BK7 Prism | Optical coupling element; its refractive index is crucial for phase-matching to excite surface plasmons [45]. | Standard in Kretschmann configuration SPR sensors [37] [45]. |
| Gold (Au) & Silver (Ag) | Plasmonic metals that support Surface Plasmon Polaritons (SPPs). Gold is more chemically stable, while silver can provide narrower resonances [47] [45]. | The core metal layer in most SPR sensors. Silver can be used with protective coatings [37]. |
| Copper (Cu) | A lower-cost plasmonic metal. Can offer narrower resonances than gold but is prone to oxidation [37]. | Used in novel designs with protective layers (e.g., Si₃N₄, MXene) to prevent tarnishing [37]. |
| Silicon Nitride (Si₃N₄) | A high-index, low-loss dielectric spacer. It confines the evanescent field, sharpens the resonance, and can protect underlying metal layers [37]. | Used as a thin film in enhanced sensor stacks [37]. |
| 2D Materials (MXene, Graphene, WS₂, MoS₂) | Enhance the local electromagnetic field and provide high surface area for analyte binding. Their biocompatibility is beneficial for biosensing [37] [45]. | Monolayers or few-layer sheets transferred onto the metal/dielectric surface to boost sensitivity [37] [45]. |
| Filtered & Degassed Buffer | The running buffer must be free of particles and air bubbles to prevent spikes, noise, and baseline drift [2] [5]. | Essential for all SPR experiments to ensure stable fluidics and a clean signal. |
Conclusion
Effective management of baseline drift in long SPR experiments is not a single action but a holistic strategy that integrates meticulous experimental design, proactive troubleshooting, and the adoption of advanced technologies. A stable baseline is foundational for acquiring reliable kinetic and affinity data, which is paramount in critical applications like drug discovery and diagnostic development. The future of drift-resistant SPR sensing lies in the continued development of intelligent hybrid systems that combine optical and electronic sensing, the integration of stable novel nanomaterials into sensor designs, and the application of sophisticated algorithms for real-time data correction. By mastering the principles and techniques outlined in this guide, researchers can significantly enhance the quality and credibility of their biomolecular interaction data, driving more confident decision-making in biomedical research.
References
- 1. Understanding and Preventing Baseline Drift in HPLC-ECD [https://www.amuzainc.com/blog/hplc-ecd-baseline-drift-troubleshooting/?srsltid=AfmBOooLLApK_NCnPw9upV8mXoR1kdV93ST4aD1T_3pWQuhDGM3wq31T]
- 2. Baseline drift [https://www.sprpages.nl/troubleshooting/baseline-drift]
- 3. Two common methods for kinetic analysis with SPR [https://nicoyalife.com/blog/analyzing-binding-kinetics-mck-sck/]
- 4. Why Your HPLC Baseline Drifts—And How to Stop It [https://www.sepscience.com/why-your-hplc-baseline-drifts-and-how-to-stop-it-11018]
- 5. Surface Plasmon Resonance (SPR) Troubleshooting Guide [https://knowledge.kactusbio.com/trouble-shooting-guide-for-surface-plasmon-resonance-spr]
- 6. Troubleshooting and Optimization Tips for SPR Experiments [https://www.creative-proteomics.com/resource/troubleshooting-optimization-tips-for-spr-experiments.htm]
- 7. Troubleshooting [https://www.sprpages.nl/troubleshooting]
- 8. How low did you go? [https://www.sprpages.nl/all-blog-posts?view=article&id=113&catid=21]
- 9. Surface Plasmon Resonance-Based Biodetection Systems [https://www.mdpi.com/2079-6374/15/1/35]
- 10. Using Surface Plasmon Resonance to Quantitatively ... [https://pmc.ncbi.nlm.nih.gov/articles/PMC5964981/]
- 11. Top 10 tips for high quality SPR data | SPR Guide [https://nicoyalife.com/blog/spr-tips/top-10-tips-for-high-quality-spr-data/]
- 12. Surface Plasmon Resonance Troubleshooting - SPR ... [https://bitesizebio.com/31665/spr-instrument-troubleshooting-surface-plasmon-resonance-assay-technology/]
- 13. Artefacts [https://www.sprpages.nl/best-results/artefacts]
- 14. Temperature-dependent sensitivity of surface plasmon ... [https://www.sciencedirect.com/science/article/abs/pii/S0925400508004450]
- 15. SPR and SPR Imaging: Recent Trends in Developing ... [https://pmc.ncbi.nlm.nih.gov/articles/PMC4934296/]
- 16. The temperature responsive mechanism of fiber surface ... [https://www.sciencedirect.com/science/article/abs/pii/S092442472030087X]
- 17. Bulk and Spikes [https://www.sprpages.nl/troubleshooting/bulk-and-spikes]
- 18. pre-concentration [https://www.sprpages.nl/immobilization/pre-concentration]
- 19. Use of Surface Plasmon Resonance (SPR) to Determine ... [https://pmc.ncbi.nlm.nih.gov/articles/PMC8489108/]
- 20. The Experiment [https://www.sprpages.nl/experiments/the-experiment]
- 21. Data processing [https://www.sprpages.nl/experiments/data-processing]
- 22. Surface plasmon resonance as a high throughput method ... [https://pmc.ncbi.nlm.nih.gov/articles/PMC4656072/]
- 23. Strategy [https://www.sprpages.nl/immobilization/strategy]
- 24. Surface plasmon resonance spectroscopy for ... [https://www.sciencedirect.com/science/article/pii/S0005273613001466]
- 25. New Immobilization Strategy Enables Reliable Surface ... [https://statnano.com/news/75206/New-Immobilization-Strategy-Enables-Reliable-Surface-Plasmon-Resonance-Analysis-of-Membrane-Proteins]
- 26. Reference coupling [https://www.sprpages.nl/immobilization/ligand-coupling/reference]
- 27. Master the Art of Regeneration in SPR Experiments [https://nicoyalife.com/blog/regeneration-buffer-spr-experiment/]
- 28. 4 Ways to Reduce Non-Specific Binding in SPR Experiments [https://nicoyalife.com/blog/4-ways-reduce-non-specific-binding-spr/]
- 29. Diagnosing and mitigating method-based avidity artifacts ... [https://pmc.ncbi.nlm.nih.gov/articles/PMC9680732/]
- 30. How to overcome the limitations of Surface-Based Kinetic ... [https://www.fidabio.com/blogs/how-to-overcome-the-limitations-of-surface-based-kinetic-assessments]
- 31. Clean machine [https://www.sprpages.nl/best-results/clean-machine]
- 32. Cleanroom Cleaning: Best Practices to Sustain Contamination [https://biocrtech.com/cleanroom-cleaning-best-practices-to-sustain-contamination/]
- 33. A Design of Experiment Approach to Optimize Spray-Dried ... [https://pmc.ncbi.nlm.nih.gov/articles/PMC8541621/]
- 34. Optimization of Spray Drying Process Parameters for the ... [https://pmc.ncbi.nlm.nih.gov/articles/PMC9960250/]
- 35. Strategies for Surface Design in Surface Plasmon ... [https://pmc.ncbi.nlm.nih.gov/articles/PMC10136606/]
- 36. SPR Instruments [https://www.sprpages.nl/spr-instruments]
- 37. A novel Mxene-SPR-based sensor for sensing different ... [https://www.frontiersin.org/journals/medicine/articles/10.3389/fmed.2025.1608424/full]
- 38. Octet® SPR Maintenance Kit - Prolong Instrument Longevity [https://shop.sartorius.com/us/p/octet-spr-maintenance-kit/surface-plasmon-resonance-maintenance-reagent-kit]
- 39. 什么是表面等离子体光子学? [https://www.ansys.com/zh-cn/simulation-topics/what-is-plasmonics]
- 40. 基于分子互作技术的表位归类实验平台比较及优化策略 [https://cn.bio-protocol.org/mv2/e1011031]
- 41. A novel Mxene-SPR-based sensor for sensing different types ... [https://pmc.ncbi.nlm.nih.gov/articles/PMC12364876/]
- 42. Accurate Correction of the “Bulk Response” in Surface ... [https://pmc.ncbi.nlm.nih.gov/articles/PMC9040059/]
- 43. Aluminum as a competitive plasmonic material for the ... [https://www.sciencedirect.com/science/article/pii/S2666950124001573]
- 44. Optimized Single-Core PCF-Based SPR Biosensor for ... [https://arxiv.org/html/2510.17283v1]
- 45. A Multi-Objective Optimization of 2D Materials Modified ... [https://www.mdpi.com/2076-3417/11/10/4353]
- 46. Denoising Algorithm for High-Resolution and Large-Range ... [https://pmc.ncbi.nlm.nih.gov/articles/PMC12349586/]
- 47. Design optimization of high-sensitivity PCF-SPR biosensor ... [https://journals.plos.org/plosone/article?id=10.1371/journal.pone.0330944]