Probing the Interface: Soft X-Ray Spectroscopy for Unveiling Ultrafast Electron Transport
This article provides a comprehensive exploration of soft X-ray spectroscopy as a powerful tool for investigating interfacial electron transport, a fundamental process in energy conversion, catalysis, and nanoscale electronics.
Probing the Interface: Soft X-Ray Spectroscopy for Unveiling Ultrafast Electron Transport
Abstract
This article provides a comprehensive exploration of soft X-ray spectroscopy as a powerful tool for investigating interfacial electron transport, a fundamental process in energy conversion, catalysis, and nanoscale electronics. It covers the foundational principles of core-level excitations and their unique sensitivity to local chemical and electronic environments. The piece delves into advanced methodologies like the core-hole-clock approach and resonant Auger spectroscopy for measuring ultrafast dynamics, alongside applications ranging from nanoparticle-based devices to energy storage materials. It further addresses critical challenges in background subtraction and in-situ characterization, while validating the technique through comparative studies with flat monolayers and other spectroscopic methods. The content is tailored for researchers and scientists seeking to understand and apply these techniques to complex material interfaces.
Core Principles: How Soft X-Ray Spectroscopy Reveals Electronic Structure at Interfaces
Core-level spectroscopy encompasses a group of techniques that provide element-specific information on the electronic structure around an atomic absorption site. These methods are powerful tools for studying the chemical state, local geometric structure, nature of chemical bonding, and dynamics in electron transfer processes centered on a specific atomic site [1]. The fundamental interaction underlying all these techniques is the creation of a core-hole—the ejection of a core electron—initiated by the absorption of an X-ray photon with energy tuned to the electron's binding energy [1]. This core-hole formation and its subsequent decay processes form the physical basis for various spectroscopic methods that offer unique insights into material properties at the elemental level.
The element specificity of these techniques arises from the localized nature of core levels, which enables detailed investigation of electronic states for specific atoms within a system without contribution from other elements [2]. When applied to interfacial electron transport studies, particularly in the soft X-ray regime, these methods can probe ultrafast electron dynamics at molecule-metal interfaces with femtosecond resolution, providing crucial information for developing nanoparticle-based electronic devices and optimizing molecular design for enhanced charge transfer efficiency [3].
Theoretical Foundations and Techniques
Core-Hole Processes and Spectroscopic Techniques
Core-level spectroscopies can be separated into two classes corresponding to the creation and decay of core-holes. The creation of core holes forms the basis for X-ray Photoelectron Spectroscopy (XPS) and X-ray Absorption Spectroscopy (XAS), while core hole decay forms the basis for Auger Electron Spectroscopy (AES) and X-ray Emission Spectroscopy (XES) [1].
The following diagram illustrates the fundamental processes involved in core-level spectroscopy:
Diagram 1: Core-level spectroscopy processes and techniques.
In X-ray Photoelectron Spectroscopy (XPS), photons with sufficient energy are absorbed by a system, causing core electrons to be ejected. The kinetic energy of these emitted photoelectrons is measured to determine their binding energy according to the equation: electron binding energy = photon energy - kinetic energy of the emitted electron - workfunction [1]. Since binding energies of core electrons are characteristic for elements in specific chemical environments, XPS enables determination of atomic compositions and chemical states [1].
X-ray Absorption Spectroscopy (XAS) probes unoccupied electronic states by exciting a core electron into an unoccupied state. The spectral intensity reflects the number of unoccupied states in the initial state, while the spectral shape provides information about the density of states for the final state [1]. In the soft X-ray regime, transitions are governed by dipole selection rules, leading to polarization-dependent angular anisotropy that can determine molecular orientation [1].
When the core electron is excited into a bound state rather than being ejected, resonant processes occur where the creation and decay steps couple, effectively forming a one-step event. These resonant processes can involve both radiant and non-radiant decays, with the excited electron either participating in the decay process or remaining passive as a spectator, leading to different final states [1].
Core-Hole Clock Approach for Ultrafast Dynamics
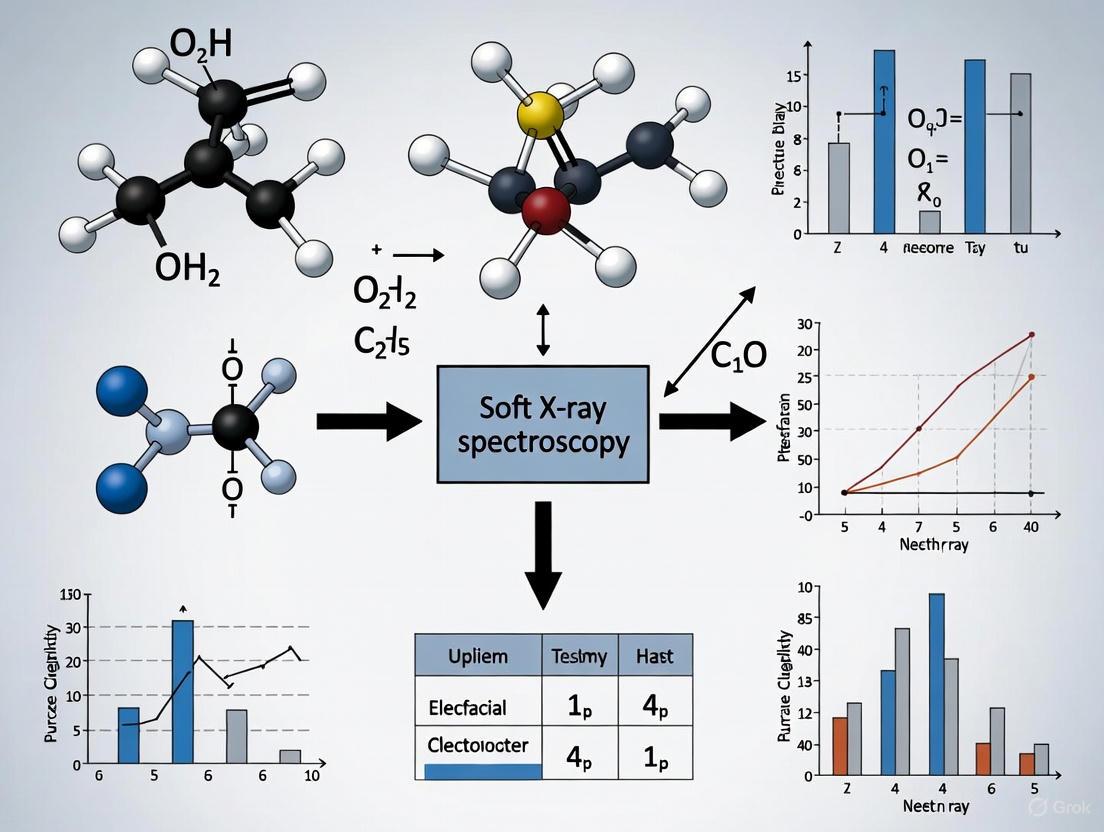
The core-hole-clock (CHC) approach using soft X-rays elucidates ultrafast electron transport dynamics at molecule-metal interfaces through kinetic analysis via resonant Auger electron spectroscopy (RAES) [3]. This method determines transport time based on the lifetime of core-hole states on the order of a single femtosecond in light elements [3]. The RAES-CHC approach offers distinctive advantages for measuring ultrafast electron transport in the time domain ranging from hundreds of femtoseconds to subfemtoseconds, providing elemental selectivity and noncontact measurement capability for precise observation of electron transport from specific excited molecular sites to metal surfaces [3].
Table 1: Core-Level Spectroscopy Techniques and Their Applications
| Technique | Physical Process | Information Obtained | Key Applications in Interfacial Studies |
|---|---|---|---|
| XPS | Core-level photoemission | Elemental composition, chemical state, oxidation state | Surface chemical analysis, adsorption site identification [1] [4] |
| XAS/NEXAFS | Core-to-valence/continuum transitions | Unoccupied density of states, molecular orientation | Molecular orientation on surfaces, electronic structure [3] [1] |
| AES | Non-radiant core-hole decay | Element-specific surface composition | Quantitative surface analysis, decomposition of XAS features [1] |
| XES | Radiant core-hole decay | Occupied density of states | Chemical bonding analysis, symmetry-selective studies [1] [2] |
| RAES-CHC | Resonant Auger processes | Ultrafast electron transport dynamics | Electron transfer times at molecule-metal interfaces [3] |
Experimental Protocols for Interfacial Electron Transport Studies
Sample Preparation and Film Fabrication
Protocol 1: Preparation of Aromatic Molecule-Coated Gold Nanoparticle Films for Electron Transport Studies
This protocol outlines the procedure for creating condensed nanoparticle films for investigating electron transport through aromatic molecules on gold nanoparticle surfaces, adapted from methodologies in [3].
Materials:
Procedure:
- Synthesize AuNPs via pulsed laser ablation in liquid (Figure 2(a) in [3])
- Mix AuNP colloidal solution with thiol solution to prepare AuNPs coated with aromatic self-assembled monolayers (SAMs)
- Remove residual solute molecules through appropriate purification techniques
- Drop the purified solution onto gold substrates, forming condensed NP films
- For comparison, prepare flat monolayer films using conventional immersion method on Au substrates
Quality Control:
- Characterize molecular adsorption on NP and flat surfaces using XPS to analyze elemental composition and chemical states
- Use Near-Edge X-ray Absorption Fine Structure (NEXAFS) spectroscopy to investigate electronic structure and molecular orientation [3]
- Verify monolayer formation and orientation through polarization-dependent NEXAFS measurements
Soft X-Ray Spectroscopy Measurements
Protocol 2: Resonant Auger Electron Spectroscopy with Core-Hole Clock Approach
This protocol describes the procedure for determining ultrafast electron transport times through aromatic molecules on nanoparticle surfaces using the RAES-CHC approach [3].
Experimental Setup:
- Utilize synchrotron radiation facilities with appropriate beamlines (e.g., HiSOR BL-13 bending magnet beamline)
- Perform measurements in ultra-high vacuum conditions (~10⁻⁸ Pa)
- Use hemispherical electron analyzer (e.g., Omicron EA125) for electron spectroscopy
- Set analyzer slit widths to 4 mm for RAES measurements at 0° emission angle
Calibration Procedure:
- Calibrate photon energy using NEXAFS peaks from reference samples:
- Flat MHDA SAMs for C K-edge (π(CO) peak at 288.4 eV)
- Flat MHDA SAMs for O K-edge (π(CO) peak at 532.3 eV)
- Gaseous CO (π* peaks at 287.41 and 533.57 eV) as additional reference [3]
- Calibrate electron binding energy to 84.0 eV for Au 4f₇/₂ peak [3]
- Calibrate photon energy using NEXAFS peaks from reference samples:
Measurement Procedure:
- Collect RAES spectra at resonant excitation energies
- Subtract inelastic scattering components to isolate resonant features
- Analyze spectral components to determine electron transport times
- Compare results between NP films and flat monolayer films
Data Analysis:
- Determine electron transport times based on core-hole lifetime
- Analyze chain length dependence of electron transport
- Compare trends between NP films and flat films to identify interface-specific effects
The following workflow illustrates the experimental process for interfacial electron transport studies:
Diagram 2: Interfacial electron transport study workflow.
Time-of-Flight Mass Spectrometry for Nuclear Dynamics
Protocol 3: Site-Selective Bond Cleavage Studies via Time-of-Flight Mass Spectrometry
This protocol outlines the procedure for investigating nuclear dynamics of molecules in NP and flat films using time-of-flight mass spectrometry (TOF-MS) to measure desorbed ions after site-specific core excitation by soft X-rays [3].
Experimental Setup:
- Utilize beamline with hybrid operation mode (high-current bunch and trains of low-current bunches in storage ring)
- Mechanically extract high-current SR component using pulse selector for pulsed SR
- Install TOF spectrometer connected to beamline free port
- Maintain ~10⁻⁶ Pa atmospheric pressure in TOF chamber
- Position sample at 20° oblique incidence to soft X-ray beam
Measurement Procedure:
- Irradiate sample with pulsed soft X-ray beam
- Detect desorbed cations using microchannel plate with TOF drift tube positioned perpendicular to sample surface
- Record ion yield spectra after site-specific core excitation
- Identify site-selective bond scission following excitation of specific functional groups
Data Interpretation:
- Analyze ion yield spectra of condensed NP films to identify site-selective desorption
- Compare with flat film results to understand NP environment effects
- Relate nuclear dynamics to electron transport measurements
Research Reagent Solutions and Materials
Table 2: Essential Materials for Core-Level Spectroscopy of Molecular Interfaces
| Material/Reagent | Function/Application | Specific Examples |
|---|---|---|
| Aromatic thiols | Formation of self-assembled monolayers on metal surfaces | Methyl 4-mercaptobenzoate (MP), methyl 4'-mercapto(1,1'-biphenyl)-4-carboxylate (MBP) [3] |
| Reference compounds | Energy calibration of spectrometers | Methyl 16-mercaptohexadecanoate (MHDA) for C K-edge (π(CO) at 288.4 eV) and O K-edge (π(CO) at 532.3 eV) [3] |
| Gold nanoparticles | Nanostructured substrates for electron transport studies | 7 nm AuNPs synthesized by pulsed laser ablation in liquid [3] |
| Gold substrates | Supports for flat SAMs and NP film deposition | Polycrystalline or single crystal Au surfaces |
| Alkanethiols | Reference SAMs for thickness measurements and comparison | 1-hexadecanethiol (HD) [3] |
Key Experimental Data and Findings
Electron Transport Times in Aromatic Molecular Systems
Table 3: Electron Transport Parameters for Aromatic Molecules on Gold Surfaces
| Molecular System | Film Type | Electron Transport Time | Key Findings |
|---|---|---|---|
| Methyl 4-mercaptobenzoate (MP) | Condensed NP film | Determined via RAES-CHC (exact values in [3]) | Chain length dependence observed similar to flat films |
| Methyl 4-mercaptobenzoate (MP) | Flat monolayer film | Reference values for comparison | Supports through-bond electron transport mechanism |
| Methyl 4'-mercapto(1,1'-biphenyl)-4-carboxylate (MBP) | Condensed NP film | Determined via RAES-CHC (exact values in [3]) | Longer transport time compared to MP due to increased chain length |
| Methyl 4'-mercapto(1,1'-biphenyl)-4-carboxylate (MBP) | Flat monolayer film | Reference values for comparison | Trend consistent with NP films, supporting extrapolation from flat to NP interfaces |
Technical Considerations for Core-Level Spectroscopy
Core Hole Effects: The relaxation of a system with a core hole affects observed core level excitation spectra. Theoretical approaches for simulating these spectra include using an atom with a reduced core level occupation in a supercell approximation within density functional theory (DFT), or more rigorous methods like the Bethe-Salpeter equation or time-dependent DFT that account for many-body effects [2].
Energy Broadening: Experimental spectra are subject to broadening from three sources: (1) core hole lifetime (modeled by Lorentzian, ~0.2 eV for accessible edges), (2) excited state lifetime (zero at edge onset, increasing with energy), and (3) instrumental broadening (modeled by Gaussian, ~0.6-0.7 eV for standard TEM) [2].
Quantitative Analysis: For reliable XPS analysis, appropriate instrument calibration, charge correction procedures, and understanding of peak fitting limitations are essential. Practical guides recommend using standard samples, verifying instrument performance, and applying consistent terminology in reporting [4].
Advanced Applications and Methodological Developments
The combination of core-level spectroscopy with other characterization techniques provides powerful approaches for correlating structural, electronic, and functional properties. Correlative transmission electron and soft X-ray microscopy enables researchers to bridge length scales from atomic to mesoscale, providing complementary information from structural, electronic, magnetic, and chemical perspectives [5]. These correlative approaches are particularly valuable for studying complex systems such as nanocatalysts, functional materials, and 2D materials where interfacial phenomena dominate performance [5].
For challenging systems like dilute metalloproteins, soft X-ray absorption spectroscopy with partial-fluorescence yield detection (PFY-XAS) using X-ray free-electron laser (XFEL) sources enables damage-free studies at room temperature under functional conditions [6]. This approach overcomes limitations of conventional soft X-ray spectroscopy for biological samples, including radiation damage, strong background signals from light elements, and dehydration in vacuum environments [6]. The method has been successfully applied to study high-valent Mn complexes in solution and the oxygen-evolving complex in Photosystem II, demonstrating the potential for probing dilute metal centers in functional metalloproteins [6].
X-ray spectroscopies are indispensable tools for probing the electronic and structural properties of materials at the atomic level, providing unique insights crucial for advancing research in energy conversion, catalysis, and materials science. These techniques share a common physical basis in their interaction with core-level electrons but offer distinct and complementary information. X-ray Absorption Spectroscopy (XAS) reveals the unoccupied electronic states and local coordination environment, while X-ray Photoelectron Spectroscopy (XPS) delivers quantitative elemental composition and chemical state information with surface sensitivity. X-ray Emission Spectroscopy (XES) provides complementary details about occupied electronic states, and Resonant Inelastic X-ray Scattering (RIXS) offers a highly detailed view of elementary excitations and momentum-resolved electronic structure. Framed within the context of soft X-ray spectroscopy for interfacial electron transport studies, this article details the application notes and experimental protocols for these powerful techniques, enabling researchers to decipher dynamic charge configurations at surfaces and interfaces—a fundamental aspect of developing next-generation energy technologies [7] [8].
The following table summarizes the core principles, key applications, and typical energy resolutions of these four major spectroscopic techniques.
Table 1: Comparison of Key X-ray Spectroscopic Techniques
| Technique | Core Principle | Key Applications | Typical Energy Resolution | Surface Sensitivity |
|---|---|---|---|---|
| XAS | Measures absorption coefficient as incident X-ray energy is scanned, promoting core electrons to unoccupied states. | Determining oxidation state, local coordination structure, and unoccupied density of states [8]. | ~1 eV (Conventional); <0.1 eV (HERFD-XAS) [8]. | Bulk-sensitive (μm scale), but surface-sensitive in TEY mode. |
| XPS | Measures the kinetic energy of electrons ejected from a material by X-ray irradiation to determine core-level binding energies. | Quantitative elemental analysis, determining chemical states via "chemical shifts," and surface composition analysis [7] [9]. | ~0.1 - 1 eV [7]. | Highly surface-sensitive (1-10 nm). |
| XES | Measures the spectrum of photons emitted as excited electrons decay to fill core holes, probing occupied valence states. | Probing occupied valence band density of states, ligand identification, and spin state analysis [9] [8]. | ~0.1 - 0.5 eV [8]. | Bulk-sensitive. |
| RIXS | Measures the energy loss of resonantly inelastically scattered X-rays, mapping electronic excitations. | Probing elementary excitations (e.g., magnons, phonons), charge transfer processes, and high-resolution absorption features [8]. | <0.1 eV [8]. | Bulk-sensitive. |
Detailed Techniques and Protocols
X-ray Absorption Spectroscopy (XAS)
Protocol for In Situ/Operando XAS Measurement in Electrocatalysis
- Sample Preparation: For in situ studies, prepare a working electrode by depositing a uniform ink of the catalyst powder (e.g., 1-2 mg) mixed with Nafion binder and isopropyl alcohol onto a carbon paper or glassy carbon substrate. The loading should be optimized to achieve a suitable edge jump.
- Cell Assembly: Assemble an electrochemical flow cell with X-ray transparent windows (e.g., Kapton film). Integrate a standard three-electrode system: the prepared working electrode, a reversible hydrogen electrode (RHE) as a reference, and a platinum wire/mesh as a counter electrode.
- Data Collection:
- Transmission Mode: For bulk catalysts, measure the incident (I0) and transmitted (I1) X-ray intensity directly through the sample. The absorption is given by μ(E)=ln(I0/I1). This is suitable for concentrated samples.
- Fluorescence Mode: For dilute systems (e.g., single-atom catalysts), use a fluorescence detector to collect the emitted X-rays (If). The signal is proportional to the absorption coefficient. Align the detector at 90° to the incident beam to minimize elastic scattering.
- Synchronization: For operando measurements, synchronize the XAS data acquisition with the application of electrochemical potential using a potentiostat. Hold at each potential step for a sufficient time to collect a spectrum with an adequate signal-to-noise ratio.
- Data Processing:
- Energy Calibration: Calibrate the energy scale using a metal foil reference measured simultaneously or prior to the experiment.
- Background Subtraction: Subtract a pre-edge background function and normalize the post-edge region to unity.
- EXAFS Extraction: Isolate the EXAFS oscillations, χ(k), by subtracting a smooth atomic background (spline function). Convert the energy to photoelectron wavenumber, k.
- Fitting: Fit the Fourier-transformed EXAFS data to theoretical models to extract structural parameters (coordination numbers, bond distances, and disorder factors).
Application Note: XAS is particularly powerful for tracking dynamic structural evolution under working conditions. For instance, it can reveal the reduction of a metal oxide catalyst under operating potential by a shift in the absorption edge to lower energies and changes in the EXAFS Fourier transform peak intensities and positions [8].
X-ray Photoelectron Spectroscopy (XPS)
Protocol for Time-Resolved XPS at Synchrotron Facilities
- Experimental Setup: This protocol utilizes a laser-pump/X-ray-probe scheme at a synchrotron beamline. The sample is irradiated with a femtosecond or picosecond laser pulse ("pump") to initiate dynamics, followed by a time-delayed X-ray pulse ("probe") to measure the core-level photoelectrons.
- Synchronization: Precisely synchronize the timing between the ultrafast laser system and the X-ray pulses from the synchrotron storage ring or free-electron laser. Use a mechanical delay stage in the optical laser path to control the time delay between the pump and probe pulses.
- Sample Environment: Maintain the sample in an ultra-high vacuum (UHV) chamber (base pressure < 1×10⁻⁹ mbar) to prevent surface contamination and allow the emitted photoelectrons to travel to the detector without scattering.
- Data Acquisition:
- Align the pump laser beam and X-ray probe beam to overlap on the sample surface.
- Set the desired time delay and acquire photoelectrons using a hemispherical electron energy analyzer.
- Accumulate counts over many pump-probe cycles (millions of pulses) to achieve an acceptable signal-to-noise ratio for the transient spectral changes.
- Data Analysis:
- Analyze the core-level spectra (e.g., Ti 2p for TiO₂) at each time delay.
- Quantify transient chemical shifts and binding energy changes, which reflect alterations in local charge density and surface potential [7].
- Model the kinetics of observed shifts to extract rates for processes such as charge injection, carrier recombination, and surface photovoltage dynamics.
Application Note: Time-resolved XPS has been successfully applied to study light-induced electron injection from N3 dye molecules into a ZnO semiconductor nanoparticle film. By probing the core levels of both the dye molecule (e.g., Ru 3d, N 1s) and the semiconductor (Zn 3d, O 1s), the charge transfer dynamics can be monitored from both sides of the interface simultaneously, providing a complete picture of the interfacial charge separation process [7].
X-ray Emission Spectroscopy (XES) and RIXS
Protocol for High-Energy-Resolution Fluorescence-Detected XAS (HERFD-XAS) and XES
- Beamline Requirements: Perform the experiment at a synchrotron beamline equipped with a high-resolution monochromator for the incident beam and a crystal analyzer spectrometer for the emitted X-rays.
- HERFD-XAS Measurement:
- Instead of measuring total absorption, set the emission spectrometer to a specific, narrow emission line (e.g., the Kα1 line for transition metals).
- Scan the incident X-ray energy across the absorption edge while recording the intensity of this selected emission line.
- The resulting spectrum is the HERFD-XAS spectrum, which offers a superior energy resolution compared to conventional XAS by effectively suppressing core-hole lifetime broadening [8].
- Non-Resonant XES Measurement:
- Set the incident X-ray energy to a fixed value sufficiently far above the absorption edge of the element of interest to ensure non-resonant excitation.
- Scan the crystal analyzer spectrometer to record the full X-ray emission spectrum, which provides information about the occupied valence states.
- RIXS Measurement:
- Tune the incident X-ray energy to a specific resonance within the absorption edge.
- For each incident energy, record the full emission spectrum with the crystal analyzer. This creates a two-dimensional map of intensity versus incident energy and emitted energy.
- The RIXS plane reveals low-energy excitations such as d-d excitations, charge transfer, and phonons.
Application Note: These high-resolution techniques are transformative for studying complex electrocatalysts. For example, HERFD-XAS can resolve pre-edge features in 3d transition metal oxides that are obscured in conventional XAS, allowing for precise identification of oxidation states and coordination geometry. RIXS can directly probe the ligand-field strength and the charge transfer energy scale at catalytic active sites, which are key parameters determining catalytic activity [8].
Visualizing Experimental Workflows
The following diagrams illustrate the core experimental setups and logical relationships for these advanced spectroscopic techniques.
Pump-Probe TR-XPS Setup
In Situ XAS for Electrochemistry
RIXS Spectroscopy Principle
The Scientist's Toolkit: Essential Research Reagents and Materials
The table below lists key reagents, materials, and instrumentation essential for conducting advanced X-ray spectroscopic studies, particularly in the context of interfacial science.
Table 2: Key Research Reagent Solutions and Materials
| Item Name | Function/Application | Technical Notes |
|---|---|---|
| Nafion Binder | Ionomer used to prepare catalyst inks for electrode fabrication in in situ electrochemistry cells. | Provides ionic conductivity and binds catalyst particles to the electrode substrate (e.g., carbon paper). |
| Hemispherical Electron Analyzer | The core detector for XPS, used to measure the kinetic energy of photoelectrons with high resolution. | Essential for both lab-based and synchrotron-based XPS. For time-resolved studies, it must be compatible with pulsed X-ray sources [7]. |
| Crystal Analyzer Spectrometer | A high-resolution spectrometer using crystal optics to resolve X-ray emission lines for XES and RIXS. | Enables HERFD-XAS and RIXS measurements by selecting specific emission energies with meV resolution [8]. |
| Ultrafast Laser System | The "pump" source in time-resolved experiments (e.g., TR-XPS) to initiate photo-induced dynamics. | Typically titanium-sapphire lasers producing ~100 fs pulses, synchronized to the X-ray probe [7]. |
| Potentiostat (3-Electrode) | Applies and controls electrochemical potential during in situ/operando XAS and XPS experiments. | Critical for simulating real operating conditions in electrocatalysis and energy storage research [9] [8]. |
| Reference Foils (e.g., Au, Cu) | Used for precise energy calibration of XAS and XPS spectra. | Gold foil is commonly used for calibrating the incident beam energy in XAS measurements [8]. |
| UHV Chamber System | Provides the necessary environment for XPS measurements. | Prevents surface contamination and allows photoelectrons to travel to the detector without scattering [7]. |
The interfacial region, a complex and dynamic environment between two distinct phases, governs critical processes in fields ranging from energy storage to drug development. Understanding its properties—specifically, bonding, oxidation state, and atomic coordination—is essential for advancing material and life sciences. Soft X-ray spectroscopy has emerged as a powerful suite of techniques for probing these interfacial characteristics with high sensitivity and element specificity. Covering the energy range of 100-3,000 eV, soft X-rays are ideally suited for investigating the K-edges of low atomic number elements (e.g., carbon, nitrogen, oxygen) and the L-edges of first-row transition metals, which are fundamental to most chemical and biological systems [10] [11]. This Application Note details the protocols for leveraging soft X-ray absorption and emission spectroscopies to elucidate interfacial electronic structure and local atomic environments, framed within the context of electron transport studies. The techniques discussed are particularly valuable for pharmaceutical research, enabling the analysis of drug-biomolecule interactions, metal speciation in proteins, and the surface chemistry of advanced materials without the need for extensive sample preparation [12].
Theoretical Background: Core Principles of Soft X-Ray Spectroscopy
Soft X-ray Spectroscopy (SXS) encompasses several analytical techniques that probe the electronic structure and local atomic environment of a chosen element. The fundamental process involves the excitation of a core-level electron by an incident X-ray photon. When the photon energy equals or exceeds the electron's binding energy, the electron is ejected to an unoccupied state or into the continuum, creating a core hole. The subsequent relaxation of this core hole, either via the emission of a fluorescent X-ray or the ejection of an Auger electron, provides a rich spectrum that encodes chemical information [12].
The two primary techniques covered in this note are:
- X-ray Absorption Spectroscopy (XAS): Measures the absorption coefficient of a material as a function of incident X-ray energy. The fine structure near the absorption edge reveals the density of unoccupied electronic states and the local coordination environment [13] [12].
- X-ray Emission Spectroscopy (XES): Analyzes the energy distribution of photons emitted during the filling of core holes. The emitted radiation provides complementary information about the occupied electronic states and, when combined with XAS in Resonant Inelastic X-Ray Scattering (RIXS) experiments, can map detailed electronic excitations [12].
A key advantage of these methods is their element selectivity. By tuning the incident X-ray energy to a characteristic absorption edge of a specific element, researchers can probe the chemical state and local environment of that particular atom within a complex matrix, such as a solid dosage form or a protein-metal complex, without significant interference from other elements [12].
Key Soft X-Ray Spectroscopic Techniques
X-Ray Absorption Near-Edge Structure (XANES)
Also known as Near-Edge X-ray Absorption Fine Structure (NEXAFS), XANES covers the energy region from slightly below the absorption edge to about 50 eV above it. This region is highly sensitive to the formal oxidation state, coordination chemistry, and electronic structure of the absorbing atom. The position of the edge shifts to higher energies with increasing oxidation state, while the pre-edge and edge features provide information about bond angles, site symmetry, and orbital mixing [13] [12]. For 3d transition metals, the pre-edge region is particularly sensitive to coordination geometry and can reveal the presence of distorted sites or metal-ligand covalent bonding.
Extended X-Ray Absorption Fine Structure (EXAFS)
EXAFS extends from approximately 50 eV to 1000 eV above the absorption edge. The oscillations in this region result from the interference between the outgoing photoelectron wave and the waves backscattered from neighboring atoms. Analysis of EXAFS data yields quantitative, short-range structural information, including:
- Interatomic distances (bond lengths)
- Coordination numbers
- Identity of neighboring atoms
- Structural disorder (Debye-Waller factor) [13]
Unlike X-ray diffraction, EXAFS does not require long-range crystalline order, making it ideal for studying amorphous materials, liquids, and surface species [12].
Soft X-Ray Photoelectron Spectroscopy (XPS)
While not strictly an absorption technique, soft X-ray Photoelectron Spectroscopy (XPS) is a cornerstone of interfacial analysis. It involves measuring the kinetic energy of electrons ejected from core levels by incident soft X-rays. This provides quantitative information on elemental composition and chemical state at the extreme surface (top 1-10 nm) [10] [11]. The enhanced brightness and tunability of synchrotron-based soft XPS allow for superior energy resolution and the possibility of depth profiling via angle-resolved measurements.
Table 1: Comparison of Key Soft X-Ray Techniques for Interfacial Analysis
| Technique | Primary Information | Probed Interface Properties | Information Depth | Key Applications in Interfacial Science |
|---|---|---|---|---|
| XANES/NEXAFS | Oxidation state, unoccupied densities of states, coordination symmetry | Bonding, valence, elemental speciation | ~100 nm - 1 μm (TFY); ~5-10 nm (TEY) | Tracking redox states in battery electrodes, surface functional group identification |
| EXAFS | Interatomic distances, coordination numbers, atomic disorder | Local coordination, bond lengths, structural disorder | ~100 nm - 1 μm (TFY); ~5-10 nm (TEY) | Determining adsorption geometry on catalysts, local structure in amorphous films |
| Soft XPS | Elemental composition, chemical state from core-level binding energies | Surface composition, chemical bonding, adsorbate identity | 1 - 10 nm | Analyzing surface contamination, molecular orientation in thin films, electrode passivation layers |
Experimental Protocols
Sample Preparation Guidelines
Proper sample preparation is critical for obtaining high-quality, reproducible data.
- Solid Samples: For transmission XAS, homogeneous powder pellets are prepared by mixing a finely ground sample with a transparent matrix (e.g., boron nitride) to achieve an optimal total absorption thickness (μd ≈ 1.0, where μ is the absorption coefficient and d is the thickness). For bulk-sensitive fluorescence measurements, pure powders can be used, but must be thin enough to avoid self-absorption effects [12].
- Liquid Samples: Aqueous or organic solutions can be analyzed in dedicated liquid cells with X-ray transparent windows (e.g., silicon nitride). The concentration of the analyte element must be sufficiently high for detection but may require optimization to minimize radiation damage [11].
- Surface-Sensitive Studies: For TEY or PEY detection, samples must be clean, flat, and electrically connected to the holder to prevent charging. Ultra-High Vacuum (UHV) conditions are typically required for these electron-yield modes and for XPS [10].
Data Collection Modes and Selection Criteria
The absorption coefficient (μ(E)) can be measured using several detection methods, each with advantages and limitations.
Table 2: Data Collection Modes in Soft X-Ray Absorption Spectroscopy
| Mode | Measurement Principle | Optimal Use Cases | Advantages | Limitations |
|---|---|---|---|---|
| Transmission | Direct measurement of incident (I₀) and transmitted (Iₜ) beam intensities using ionization chambers. | Homogeneous, concentrated samples (>10% absorber); powder pellets, free-standing films. | Direct measurement of μ(E), high-quality data, short acquisition times. | Requires uniform, optimally thick samples; not suitable for dilute or highly heterogeneous samples. |
| Total Fluorescence Yield (TFY) | Detection of fluorescence X-rays emitted during core-hole relaxation. | Dilute systems, thin films, surface layers on a bulk substrate. | High sensitivity for low-concentration elements; bulk-sensitive (probing depth ~100 nm - 1 μm). | Prone to self-absorption effects, which can distort spectral line shapes, especially in concentrated or thick samples. |
| Total Electron Yield (TEY) | Measurement of the sample current or emitted electrons resulting from the absorption process. | Surface and near-surface analysis (top ~5-10 nm), thin films, UHV-compatible samples. | Highly surface-sensitive; no self-absorption distortion. | Requires UHV; sensitive to surface contamination; probing depth depends on electron escape length. |
The following workflow diagram outlines the key decision points for planning a soft X-ray spectroscopy experiment, from sample characterization to technique selection.
Protocol: In Situ/Operando Analysis of Electrode-Electrolyte Interfaces
Understanding interfacial electron transport in operating devices, such as batteries or electrochemical cells, requires in situ or operando methodologies.
- Cell Design: Utilize a specialized electrochemistry cell with soft X-ray transparent windows (e.g., silicon nitride). Ensure electrical contacts for potentiostatic control and a leak-proof design compatible with the beamline vacuum requirements [11].
- Sample Configuration: Prepare the working electrode as a thin film on a current collector. The electrolyte should be a thin layer to minimize X-ray absorption.
- Data Acquisition: While controlling the electrochemical potential, collect a series of XAS spectra (preferably in TFY mode due to the liquid environment) at the relevant element's absorption edge (e.g., O K-edge, transition metal L-edges).
- Data Correlation: Synchronize the collected spectra with the applied potential and measured current. This allows for direct correlation of changes in oxidation state and local structure with the electrochemical response [13] [12].
The Scientist's Toolkit: Essential Research Reagents and Materials
Table 3: Key Research Reagent Solutions for Soft X-Ray Spectroscopy
| Item / Reagent | Function / Role in Experiment | Application Example / Note |
|---|---|---|
| Boron Nitride (BN) Powder | Chemically inert, X-ray transparent diluent for preparing homogeneous pellets for transmission measurements. | Essential for diluting concentrated powder samples to achieve optimal absorption thickness (μd ≈ 1.0). |
| Silicon Nitride (Si₃N₄) Windows | X-ray transparent membrane for containing liquid or gaseous samples while under vacuum. | Used in in situ liquid cells and environmental cells to separate the sample environment from the UHV of the beamline [11]. |
| Standard Reference Compounds | Well-characterized materials (e.g., metal foils, oxides, salts) for energy calibration and spectral comparison. | A gold foil (Au L₃-edge at 11919 eV) or a nickel foil is often used for internal energy calibration. |
| Conductive Adhesive Tapes | (e.g., Carbon Tape) To mount powder samples and provide electrical grounding to prevent charging. | Critical for TEY measurements and XPS where sample charging would distort the spectrum. |
| Ultra-High Purity Gases | (e.g., He, N₂) For purging beamlines and end-stations, or for use in controlled atmosphere experiments. | Helium is often used for its low X-ray absorption. Some end-stations allow for studies at pressures up to 20 torr [11]. |
| Sputter Coater & Gold/Palladium Targets | For depositing a thin, conductive layer on insulating samples to mitigate charging effects. | Use is discouraged for surface-sensitive studies (TEY, XPS) as it coats the material of interest. |
Data Analysis and Interpretation
Qualitative and Quantitative Analysis of XANES
- Oxidation State Determination: Identify the energy shift of the absorption edge. A shift to higher energy indicates an increase in the oxidation state of the absorber atom. This is calibrated using standard compounds with known oxidation states [13].
- Pre-Edge Feature Analysis: The intensity and energy of pre-edge features provide insights into coordination and symmetry. For example, in TiO₂, the pre-edge feature is sensitive to the coordination of Ti atoms (octahedral vs. tetrahedral), which is a crucial parameter in photocatalytic applications [13].
- Linear Combination Fitting (LCF): Fit an unknown spectrum as a linear combination of spectra from standard reference compounds. This is used for quantifying the proportion of different chemical species in a mixed-phase sample.
EXAFS Data Processing and Fitting
- Data Reduction: This involves background subtraction (pre-edge and post-edge), normalization, and conversion from absorption space to k-space (the wavevector of the photoelectron).
- Fourier Transform: Transform the k-space spectrum (χ(k)) to R-space to produce a pseudo-radial distribution function. Peaks in this plot correspond to coordination shells around the absorber atom.
- Curve Fitting: Fit the EXAFS equation to the data in R-space or k-space to extract structural parameters: coordination number (N), interatomic distance (R), and disorder factor (σ²). This requires an initial model based on a known crystal structure or theoretical calculations [13].
Application in Pharmaceutical Sciences: A Case Study
Soft X-ray spectroscopy offers unique capabilities for pharmaceutical research, particularly in analyzing the local atomic structure of metal-based Active Pharmaceutical Ingredients (APIs) and their interactions with biomolecules.
Case: Investigating the Electronic Structure of a Platinum-Based Anticancer Drug.
- Objective: To determine the oxidation state and local coordination of platinum in a bulk drug substance and its protein adduct.
- Methodology:
- Pt L₃-edge XANES is collected for the pure API (e.g., cisplatin) and for the complex formed between cisplatin and serum albumin.
- The XANES spectra of the samples are compared to those of reference standards: Pt(II) compounds (e.g., K₂PtCl₄) and Pt(IV) compounds (e.g., K₂PtCl₆).
- The white line intensity and edge position are analyzed. A pronounced white line is characteristic of Pt(II) complexes, while a shift to higher energy would indicate oxidation to Pt(IV) [12].
- Expected Outcome: The technique can confirm the reduction of Pt(IV) prodrugs to active Pt(II) species in situ and elucidate the coordination geometry of Pt when bound to proteins (e.g., whether it coordinates to sulfur in methionine or nitrogen in histidine residues), providing mechanistic insight into the drug's activity and deactivation pathways [12].
Soft X-ray spectroscopy provides a powerful, element-specific toolkit for dissecting the complex chemistry of interfacial regions. Its sensitivity to oxidation states, bonding, and local coordination makes it indispensable for advancing research in electron transport mechanisms, material design, and pharmaceutical development. The protocols outlined in this note—from sample preparation and technique selection to data interpretation—offer a roadmap for researchers to leverage these sophisticated analytical methods. As access to synchrotron facilities grows and in situ capabilities expand, the application of soft X-ray spectroscopy in understanding and engineering interfaces is poised to become a standard in the scientific arsenal.
The Unique Role of Light Elements (C, N, O) in Electron Transport Pathways
Carbon, nitrogen, and oxygen (CNO) are the most abundant elements in the universe after hydrogen and helium [14]. Their unique electronic configurations and bonding capabilities make them fundamental components in electron transport pathways (ETPs) across diverse scientific disciplines, from astrophysics and molecular electronics to biochemistry. In astrophysics, CNO isotopes serve as catalysts in stellar fusion processes, enabling the electron transfer reactions that power stars [15]. In molecular nanotechnology, aromatic molecules rich in CNO atoms form the backbone of electron transport channels in self-assembled monolayers on metal nanoparticles [3]. In biological systems, CNO elements constitute the essential redox-active cofactors and protein frameworks that facilitate electron transfer in respiratory and photosynthetic chains [16] [17]. This application note examines the unique roles of these light elements across different scales and systems, providing researchers with quantitative data, standardized protocols, and visualization tools for investigating CNO-mediated electron transport, with particular emphasis on soft X-ray spectroscopy techniques.
Fundamental Roles of CNO Elements in Diverse Electron Transport Systems
Astrophysical Context: CNO Cycles in Stellar Nucleosynthesis
In astrophysical environments, CNO elements function as catalytic centers in one of the two primary fusion processes by which stars convert hydrogen to helium. The CNO cycle represents a sophisticated electron transport and nuclear transformation pathway where carbon, nitrogen, and oxygen isotopes undergo a series of proton captures and beta decays [15].
Table 1: Key Reactions in the Primary CNO-I (Cold) Cycle
| Step | Reaction | Products | Energy Released | Characteristic Time |
|---|---|---|---|---|
| 1 | ( ^{12}\text{C} + ^{1}\text{H} ) | ( ^{13}\text{N} + \gamma ) | +1.95 MeV | Proton capture |
| 2 | ( ^{13}\text{N} ) | ( ^{13}\text{C} + e^+ + \nu_e ) | +1.20 MeV (Q-value) | 9.965 min half-life |
| 3 | ( ^{13}\text{C} + ^{1}\text{H} ) | ( ^{14}\text{N} + \gamma ) | +7.54 MeV | Proton capture |
| 4 | ( ^{14}\text{N} + ^{1}\text{H} ) | ( ^{15}\text{O} + \gamma ) | +7.35 MeV | Proton capture (rate-limiting) |
| 5 | ( ^{15}\text{O} ) | ( ^{15}\text{N} + e^+ + \nu_e ) | +1.73 MeV (Q-value) | 122.24 s half-life |
| 6 | ( ^{15}\text{N} + ^{1}\text{H} ) | ( ^{12}\text{C} + ^{4}\text{He} ) | +4.96 MeV | Alpha decay |
The complete CNO-I cycle releases approximately 26.73 MeV of energy (including positron annihilation energies) and regenerates the original ( ^{12}\text{C} ) catalyst, creating a sustainable electron-nuclear transport pathway [15]. The cycle's operation is highly temperature-dependent, dominating over the proton-proton chain in stars more massive than approximately 1.3 solar masses [15]. The limiting reaction is the proton capture on ( ^{14}\text{N} ), which has been experimentally measured down to stellar energies, enabling refined models of stellar evolution and galactic chemical enrichment [14] [15].
Molecular Electronics: CNO-Based Aromatic Transport Systems
In nanoscale electronics, aromatic organic molecules containing CNO elements serve as molecular wires for electron transport between metal surfaces. Recent studies using soft X-ray spectroscopy have quantified ultrafast electron transport through aromatic molecular backbones on gold nanoparticles (AuNPs) and flat substrates [3].
The electron transport time through methyl 4-mercapto benzoate (MP) and methyl 4'-mercapto (1,1'-biphenyl)-4-carboxylate (MBP) on AuNPs has been determined using resonant Auger electron spectroscopy with the core-hole-clock (RAES-CHC) approach [3]. This method exploits the femtosecond-scale lifetime of core-hole states created by soft X-ray excitation to measure electron transfer times from specific molecular sites to metal surfaces.
Table 2: Electron Transport Times Through Aromatic Molecules on Gold Surfaces
| Molecule | Molecular Backbone | Transport Time (Femtoseconds) | Transport Mechanism |
|---|---|---|---|
| Methyl 4-mercapto benzoate (MP) | Single phenyl ring | Shorter transport time | Through-bond |
| Methyl 4'-mercapto (1,1'-biphenyl)-4-carboxylate (MBP) | Biphenyl system | Longer transport time | Through-bond |
The study demonstrated that electron transport times increase with molecular chain length, following an exponential relationship consistent with through-bond transport mechanisms [3]. This quantitative understanding of CNO-mediated electron transport enables rational design of molecular electronic components.
Biological Systems: CNO in Respiratory and Photosynthetic Chains
In biological energy conversion, CNO elements form the essential redox centers and protein matrices that facilitate electron transfer in mitochondrial respiration and photosynthesis. The tryptophan tryptophylquinone (TTQ) cofactor in enzymes such as aromatic amine dehydrogenase (AADH) and methylamine dehydrogenase (MADH) contains nitrogen and oxygen atoms arranged in a quinone configuration that mediates electron transfer during catalytic cycles [18].
Photosynthetic Complex I (PS-CI), a key component of cyclic electron flow in cyanobacteria and plants, employs iron-sulfur clusters (containing sulfur with CNO-based protein coordination) to transfer electrons from ferredoxin to plastoquinone, coupling this transport to proton pumping across thylakoid membranes [17]. Recent research has determined the reduction potentials of the FeS clusters in PS-CI, identifying three distinct [4Fe-4S] clusters labeled N0, N1, and N2 with characteristic g-values of 2.05, 1.93, 1.88 (N0); 2.04, 1.93, 1.88 (N1); and 1.89, 1.94, 2.05 (N2) [17]. This "rollercoaster" of alternating reduction potentials enables efficient electron transfer against free energy barriers, showcasing the sophisticated electron transport pathways enabled by CNO-based protein architectures.
Experimental Approaches for Studying CNO Electron Transport
Soft X-ray Spectroscopy of Molecular Electron Transport
Soft X-ray spectroscopy provides powerful, element-specific tools for investigating electron transport through CNO-based molecular systems. The following protocol outlines the procedure for studying ultrafast electron transport in aromatic molecular monolayers on gold surfaces [3].
Protocol 1: Measuring Electron Transport Times Using RAES-CHC
Principle: The core-hole-clock method exploits the femtosecond lifetime of core-excited states created by soft X-ray absorption. Competition between electron transport to the metal substrate and Auger decay of the core-hole enables measurement of interfacial electron transfer times.
Materials and Reagents:
- Aromatic thiols: Methyl 4-mercapto benzoate (MP) or methyl 4'-mercapto (1,1'-biphenyl)-4-carboxylate (MBP)
- Gold substrates: Flat Au(111) single crystals or Au nanoparticles (7 nm average size)
- Reference compounds: Methyl 16-mercaptohexadecanoate (MHDA) for energy calibration
- Solvents: Ethanol (HPLC grade) for solution preparation
Equipment:
- Soft X-ray beamline with high energy resolution (E/ΔE > 3000)
- Hemispherical electron analyzer (e.g., Omicron EA125)
- Ultra-high vacuum chamber (base pressure ~10⁻⁸ Pa)
- X-ray photoelectron spectroscopy (XPS) system
- Near-edge X-ray absorption fine structure (NEXAFS) spectroscopy capability
- Time-of-flight mass spectrometer (TOF-MS) for ion yield measurements
Procedure:
Sample Preparation:
- For flat films: Immerse Au substrates in 1 mM ethanolic thiol solution for 24 hours to form self-assembled monolayers (SAMs). Rinse thoroughly with ethanol and dry under nitrogen stream.
- For NP films: Synthesize AuNPs (7 nm) by pulsed laser ablation in liquid. Mix colloidal AuNP solution with thiol solution. Remove residual solutes by centrifugation and drop-cast on Au substrates.
Characterization:
- Perform XPS analysis to verify monolayer formation and determine layer thickness.
- Conduct NEXAFS measurements at C and O K-edges to determine molecular orientation using linear polarization dependence.
- Calibrate photon energy using reference peaks: π*(C=O) of MHDA at 288.4 eV (C K-edge) and 532.3 eV (O K-edge).
RAES-CHC Measurements:
- Tune incident X-ray energy to resonance: C 1s→π*(C=O) transition (~288.4 eV).
- Collect resonant Auger electron spectra at 0° emission angle with 4 mm analyzer slit.
- Measure participant and spectator decay channels with high energy resolution.
Data Analysis:
- Extract electron transport time (τₑₜ) using the formula: τₑₜ = τₕK / (Iₚ/Iₛ) where τₕ is core-hole lifetime, K is dimensionless constant, Iₚ is participant intensity, and Iₛ is spectator intensity.
- Account for inelastic scattering components through background subtraction.
- Compare transport times for different molecular lengths to determine distance dependence.
Applications: This protocol enables quantitative measurement of ultrafast electron transport through molecular bridges, essential for designing molecular electronic devices, organic photovoltaics, and electrochemical sensors [3].
Spectroscopic Characterization of Biological Electron Transfer
Protocol 2: Determining Reduction Potentials of FeS Clusters in Photosynthetic Complex I
Principle: Electron paramagnetic resonance (EPR) spectroscopy combined with potentiometric titration determines the reduction potentials of iron-sulfur clusters in photosynthetic complex I, which facilitates electron transfer from ferredoxin to plastoquinone.
Materials:
- Purified PS-CI from Thermosynechococcus elongatus or Synechocystis sp. PCC6803
- Anaerobic chamber for oxygen-free measurements
- Redox mediators: Quinhydrone, phenazine ethosulfate, benzyl viologen
- Reducing agents: Sodium dithionite
- Oxidizing agents: Potassium ferricyanide
Procedure:
- Purify PS-CI using affinity chromatography with His-tag on NdhF1 or Ndh-J subunits.
- Transfer samples to anaerobic chamber and prepare in EPR tubes.
- Perform potentiometric titration with sequential additions of reductant/oxidant.
- Record continuous-wave EPR spectra at multiple potentials (e.g., from -500 mV to 0 mV).
- Use pulsed EPR with relaxation filtering to distinguish overlapping FeS cluster signals.
- Apply double electron-electron resonance (DEER) for spatial assignment of clusters.
- Fit Nernst equation to signal intensity vs. potential data to determine reduction potentials.
Expected Outcomes: Identification of three [4Fe-4S] clusters with reduction potentials spanning -250 mV to -450 mV, creating the electron transfer gradient necessary for coupling to proton pumping [17].
Research Reagent Solutions for Electron Transport Studies
Table 3: Essential Research Reagents for CNO Electron Transport Investigations
| Reagent/Category | Specific Examples | Function/Application | Key Characteristics |
|---|---|---|---|
| Aromatic Thiols | Methyl 4-mercapto benzoate (MP), Methyl 4'-mercapto (1,1'-biphenyl)-4-carboxylate (MBP) | Molecular bridges for electron transport studies | Thiol group for Au binding, aromatic backbone for electron delocalization, ester group for X-ray absorption |
| Gold Nanomaterials | Au nanoparticles (7 nm), Flat Au(111) substrates | Electron acceptors/donors in transport studies | High conductivity, well-defined surface chemistry, tunable morphology |
| Spectroscopy Standards | Methyl 16-mercaptohexadecanoate (MHDA), 1-hexadecanethiol (HD) | Energy calibration references for soft X-ray studies | Well-characterized absorption features, stable monolayers |
| Redox Mediators | Quinhydrone, Phenazine ethosulfate, Benzyl viologen | Facilitate equilibration in potentiometric titrations | Low redox potentials, non-interacting with protein samples |
| Enzyme Systems | Photosynthetic Complex I, Aromatic amine dehydrogenase | Biological electron transport studies | TTQ cofactors (AADH), FeS clusters (PS-CI) for specialized CNO redox chemistry |
Pathway Visualizations
CNO Cycle in Stellar Nucleosynthesis
CNO-I Catalytic Cycle in Stars
Soft X-ray Spectroscopy Workflow
Core-Hole-Clock Experimental Principle
Carbon, nitrogen, and oxygen elements play indispensable roles in electron transport pathways across astronomical, molecular, and biological systems. Their unique electronic properties enable diverse functions from stellar nucleosynthesis catalysis to molecular-scale charge transport and biological energy conversion. Soft X-ray spectroscopy techniques, particularly the RAES-CHC method, provide powerful tools for quantifying ultrafast electron transport through CNO-based molecular systems with element-specificity and femtosecond temporal resolution. The protocols and reference data presented herein offer researchers standardized methodologies for investigating these fundamental processes, supporting advancements in fields ranging from astrophysics to molecular electronics and renewable energy technologies.
Advanced Methods and Real-World Applications in Energy and Nanotechnology
Ultrafast electron transfer (ET) processes at interfaces are fundamental to the function of molecular electronics, organic photovoltaics, and catalytic systems. These dynamics occur on femtosecond timescales, presenting a significant challenge for real-time observation. The Core-Hole-Clock (CHC) method, implemented through Resonant Auger Electron Spectroscopy (RAES), provides an atom-specific, femtosecond-scale stopwatch for tracking charge migration through molecular assemblies. This technique exploits the finite lifetime of core-excited states as an intrinsic reference timer, enabling the measurement of electron transfer times from a precisely defined injection site through molecular frameworks to a conductive substrate [19]. Within the broader context of soft X-ray spectroscopy research, CHC-RAES offers unparalleled temporal resolution for interrogating interfacial charge transport in prototype molecular electronic devices.
Theoretical Foundation of the Core-Hole Clock
Fundamental Principles
The Core-Hole-Clock methodology is grounded in the physics of core-level excitation and subsequent decay processes. When an atom is irradiated with narrow-bandwidth soft X-rays tuned to a specific core-level binding energy, a core electron is resonantly excited to an unoccupied bound state (e.g., a molecular orbital or a tailgroup orbital), creating a core-excited state with a lifetime (τ_core) typically on the order of a few femtoseconds [19]. This core-excited state is metastable and decays via two primary competing pathways:
- Resonant Auger Decay: The core-hole is filled by a higher-shell electron, with the excess energy causing the emission of another electron (the Auger electron). This results in a final state with one hole in a valence level (participator decay) or two holes in the valence levels (spectator decay) [19].
- Electron Transfer (ET): The excited electron transfers away from the core-excitation site—for example, to a conductive substrate through a molecular backbone—before the core-hole decays. This process leaves the system in a state identical to that created by a direct, non-resonant Auger process [19].
The core-hole lifetime, τcore, thus serves as a built-in, element-specific timer. By measuring the relative probabilities of these two decay channels, the electron transfer time (τET) can be quantified using the relation: τET = τcore (1 - PET) / PET where P_ET is the probability of the electron transfer pathway, derived from the RAES spectrum [19].
Methodological Workflow
The following diagram illustrates the logical sequence of the Core-Hole-Clock method, from initial excitation to the determination of electron transfer times.
Experimental Protocols for CHC-RAES
Core-Hole-Clock Measurement Protocol
This protocol details the steps for measuring electron transfer dynamics in self-assembled monolayers (SAMs) using the CHC-RAES method.
Objective: To determine the characteristic electron transfer time (τ_ET) from a specific tailgroup through a molecular backbone to a gold substrate.
Materials and Reagents:
- Substrate: Atomically flat Au(111) single crystal.
- Molecular Systems: Target molecules designed with:
- Headgroup: Thiol (-SH) for covalent Au-S bonding.
- Backbone: Aliphatic (alkanes), conjugated (oligophenyls - OPh, oligo(phenylene-ethynylenes) - OPE).
- Tailgroup: Nitrile (-C≡N) or nitro (-NO₂) moiety for site-specific resonant excitation [19].
- Solvents: High-purity ethanol, toluene for SAM preparation.
- Gases: Ultra-high purity argon/nitrogen for glove box atmosphere.
Procedure:
Sample Preparation (SAM Formation):
- Prepare a 0.1-1.0 mM solution of the target molecule in degassed ethanol or toluene within an inert atmosphere glove box.
- Immerse the freshly cleaned Au(111) substrate into the solution.
- Allow SAM formation to proceed for 12-48 hours at room temperature.
- Remove the substrate, rinse thoroughly with pure solvent to remove physisorbed molecules, and dry under a stream of inert gas.
Synchrotron Measurement Setup:
- Transfer the SAM sample to an ultra-high vacuum (UHV) chamber (base pressure < 1×10⁻¹⁰ mbar) compatible with the synchrotron beamline.
- Beamline Requirements: A soft X-ray beamline with a high-resolution monochromator. For nitrile excitation, use the nitrogen K-edge (≈400 eV photon energy) [19].
- Spectrometer: A high-transmission electron energy analyzer positioned at a specific angle (e.g., magic angle, 54.7°) relative to the polarization vector of the incident X-rays to minimize angular distribution effects.
Spectral Data Acquisition:
- Non-Resonant Auger Spectrum: Set the photon energy slightly above the core-level absorption edge of the tailgroup (e.g., +10 eV above the N K-edge resonance) and acquire an electron spectrum. This provides the reference lineshape for the pure ET pathway [19].
- Resonant Auger Spectrum (RAES): Tune the monochromator to the maximum of the targeted core-excitation resonance (e.g., the π* resonance of the nitrile group) and acquire the electron spectrum with identical analyzer settings.
- Total Acquisition Time: Allow sufficient time for each spectrum to achieve high signal-to-noise, typically 10-30 minutes per spectrum depending on source brightness and cross-section.
Data Analysis for τ_ET Determination:
- Normalize the non-resonant and resonant spectra to a common background or incident photon flux.
- Decompose the resonant Auger spectrum into two components: the resonant (PSP+P) contribution and the ET contribution (PET), which matches the non-resonant Auger lineshape.
- Calculate the probability P_ET from the relative intensities of the decomposed spectral components.
- Use the known core-hole lifetime (τcore, e.g., ≈6 fs for a C 1s hole [19]) in the formula τET = τcore (1 - PET) / P_ET to compute the electron transfer time.
Troubleshooting:
- Low Signal: Ensure SAM quality and coverage. Increase acquisition time if beamline stability permits.
- Poor Spectral Resolution: Verify monochromator settings and check for sample charging; use a lower incident flux or electron flood gun for charge compensation if necessary.
- Sample Degradation: Monitor key spectral features over time to check for radiation damage. Use a defocused beam or raster the sample if degradation is observed.
Essential Research Reagent Solutions
Table 1: Key Research Reagents for CHC-RAES Studies of Molecular Wires.
| Reagent / Material | Function / Role in Experiment | Key Characteristics & Considerations |
|---|---|---|
| Gold Single Crystal (Au(111)) | Conductive substrate for forming well-ordered Self-Assembled Monolayers (SAMs). | Provides a defined, atomically flat surface and enables strong thiolate chemisorption [19]. |
| Thiol-functionalized Molecular Wires | Core sample for studying electron transport; consists of headgroup, backbone, and tailgroup. | Headgroup (thiol) anchors molecule. Backbone (e.g., OPE, OPh) defines ET path. Tailgroup (e.g., nitrile) provides excitation site [19]. |
| High-Purity Solvents (e.g., Ethanol) | Medium for Self-Assembled Monolayer (SAM) preparation via solution deposition. | Must be degassed and anhydrous to prevent oxidation of thiols and substrate during SAM formation. |
| Narrow-Bandwidth Soft X-rays | Tunable photon source for element-specific, resonant core-level excitation. | Synchrotron radiation with high monochromaticity (e.g., at N K-edge ≈400 eV) is required for selective tailgroup excitation [19]. |
| Electron Energy Analyzer | Detection of emitted Auger electrons with high energy resolution. | Typically a hemispherical analyzer. Measures kinetic energy distribution of electrons to generate RAES spectra [19]. |
Key Applications and Quantitative Data
The CHC-RAES method has been successfully applied to measure femtosecond-scale electron transfer in various molecular systems, providing key parameters such as transfer times and attenuation factors that characterize charge transport efficiency.
Electron Transfer Dynamics in Molecular Wires
Quantitative data extracted from CHC-RAES studies on different molecular backbones reveal clear trends related to molecular structure and conjugation.
Table 2: Measured Electron Transfer Times and Attenuation Factors for Different Molecular Backbones.
| Molecular Backbone | Tailgroup | Approx. ET Time (τ_ET) | Attenuation Factor (β, Å⁻¹) | Interpretation |
|---|---|---|---|---|
| Oligo(phenylene-ethynylene) (OPE) | Nitrile (-C≡N) | < 6 fs (faster than C 1s τ_core) [19] | ≈ 0.3 [19] | Extremely fast ET due to highly conjugated, delocalized π-system. |
| Oligophenyl (OPh) | Nitrile (-C≡N) | ≈ 6 fs (on the order of C 1s τ_core) [19] | 0.41 – 0.7 [19] | Fast ET, but slower than OPE due to reduced conjugation between phenyl rings. |
| Alkane | Nitrile (-C≡N) | Not explicitly given, but significantly slower than conjugated systems. | 0.6 – 1.0 [19] | Inefficient ET via superexchange tunneling through a saturated, insulating backbone. |
The experimental workflow for these measurements involves precise sample design, resonant excitation, and spectral analysis, as summarized below.
Probing Inverse Electron Transfer
Beyond conventional electron transfer to the substrate, the CHC method can also probe more complex charge redistribution phenomena. By replacing the nitrile tailgroup with a strongly electronegative nitro (-NO₂) group, researchers observed spectral features indicative of an inverse electron transfer [19]. In this scenario, following resonant excitation of the nitro group, electron density is transferred from the molecular backbone back towards the excited tailgroup. This observation highlights the method's sensitivity to the directionality of charge flow and the role of localized electronegative sites in manipulating ultrafast electron dynamics.
Advanced Synchrotron Techniques and Future Outlook
The CHC-RAES method is intrinsically linked to advanced light sources. While initial studies relied on synchrotron radiation with its high spectral resolution, the emergence of X-ray Free-Electron Lasers (XFELs) and High-Harmonic Generation (HHG) sources opens new frontiers [20] [21]. XFELs produce intense, femtosecond-to-attosecond X-ray pulses, enabling not just the measurement of dynamics but also the initiation of dynamics and the study of their evolution using pump-probe schemes. This could allow, for instance, for optically "pumping" a molecular switch and "probing" the ensuing charge transfer dynamics with a delayed X-ray pulse via the CHC method [20] [21]. Furthermore, the development of fully correlative microscopy approaches that combine soft X-ray spectroscopy with techniques like transmission electron microscopy (TEM) promises to bridge the gap between ultrafast temporal dynamics and atomic-scale spatial resolution [5]. This powerful combination will provide a more complete picture of structure-function relationships in complex functional materials.
In-situ and operando soft X-ray spectroscopy represent a paradigm shift in materials characterization, enabling direct investigation of chemical and electrochemical processes at solid/liquid and solid/gas interfaces under realistic working conditions. These techniques provide unprecedented access to dynamic electronic structure changes, formation of intermediate species, and charge transfer phenomena that occur during energy conversion and storage processes. Unlike conventional ex-situ methods that analyze materials in static, post-reaction states, in-situ approaches monitor systems under simulated reaction conditions, while operando techniques specifically probe materials during simultaneous activity measurement, creating a direct correlation between structural/electronic properties and functional performance [22] [23]. The unique advantage of soft X-ray spectroscopy lies in its sensitivity to light elements and its ability to probe key electronic properties critical for understanding energy conversion mechanisms in solar energy materials, catalytic systems, and energy storage devices [22] [24].
The fundamental principle driving this methodology is the recognition that material interfaces are dynamic entities whose electronic structures and chemical compositions evolve dramatically under operational conditions of temperature, pressure, electrical potential, or illumination. For instance, in solar energy materials, soft X-ray spectroscopies can directly probe charge separation upon sunlight illumination and subsequent electron transfer to interfacial reactions—processes that would be impossible to capture using conventional ex-situ techniques [22]. This real-time monitoring capability has proven particularly valuable for investigating catalytic mechanisms, electrode degradation pathways, and interfacial charge transfer dynamics in functional energy materials.
Fundamental Techniques and Principles
Core Soft X-Ray Spectroscopy Techniques
Soft X-ray spectroscopy encompasses several complementary techniques that provide detailed information about electronic structure, chemical composition, and local geometry. The primary methods include:
Soft X-ray Absorption Spectroscopy (XAS): Measures element-specific transitions from core levels to unoccupied states, providing information about oxidation states, coordination geometry, and unoccupied density of states. For example, XAS can probe the oxidation state of cobalt in cobalt oxide clusters used as oxygen-evolving catalysts [24].
Soft X-ray Emission Spectroscopy (XES): Detects transitions from occupied states to core holes, mapping the occupied density of states and providing complementary information to XAS. The resonant C Kα X-ray emission of carbon allotropes demonstrates how XES can distinguish between different bonding configurations [22] [24].
Resonant Inelastic Soft X-ray Scattering (RIXS): A photon-in/photon-out technique that provides detailed information about electronic excitations, charge transfer, and spin states. RIXS has been used to investigate dd excitations in copper oxides and the spin states of nickel in bioinorganic complexes [22] [24].
Table 1: Core Soft X-Ray Spectroscopy Techniques and Their Applications
| Technique | Acronym | Information Obtained | Representative Application |
|---|---|---|---|
| Soft X-ray Absorption Spectroscopy | XAS | Oxidation states, unoccupied states, coordination geometry | Probing Cu corrosion in aqueous NaHCO₃ solution [24] |
| Soft X-ray Emission Spectroscopy | XES | Occupied density of states, chemical bonding | Studying carbon allotropes and organic compounds [22] |
| Resonant Inelastic X-ray Scattering | RIXS | Electronic excitations, charge transfer, spin states | Investigating Ni spin states in bioinorganic complexes [24] |
Technical Advantages of Soft X-Ray Regime
The soft X-ray energy range (approximately 100-2000 eV) provides exceptional sensitivity to light elements (C, N, O) that are fundamental constituents of energy and catalytic materials, while also covering the L-edges of 3d transition metals and M-edges of rare earth elements that are crucial for functional materials [22]. This elemental coverage, combined with the penetration depth of soft X-rays, makes these techniques ideally suited for investigating buried interfaces and solid/electrolyte boundaries in operating devices. The development of high-brightness synchrotron radiation sources has been instrumental in advancing these capabilities, enabling measurements with high energy resolution and good signal-to-noise ratios even for dilute systems or thin film samples [24].
Experimental Setup and Protocol Design
In-Situ/Operando Cell Design
The design of specialized experimental cells represents a critical component for successful in-situ/operando soft X-ray spectroscopy. These cells must maintain realistic reaction conditions while allowing transmission of incident X-rays and emitted photons or electrons. Two primary configurations have been developed:
Electrochemical Liquid Cells: For investigating solid/liquid interfaces, electrochemical cells incorporate X-ray transparent membranes (typically silicon nitride or graphene) that separate the liquid electrolyte from the vacuum environment of the spectrometer while allowing transmission of soft X-rays. The sample configuration typically involves depositing the catalyst material directly onto the membrane surface or using a working electrode in close proximity to the membrane. Reference and counter electrodes complete the three-electrode system, enabling potential control during measurements [22] [24].
Gas-Phase Reaction Cells: For studying solid/gas interfaces under catalytic conditions, cells incorporate gas inlets/outlets for reactant/product control and heating capabilities for temperature-dependent studies. These cells often employ differential pumping to maintain high gas pressure at the sample while preserving ultra-high vacuum in the analyzer chamber [22].
Figure 1: Experimental Setup for In-Situ/Operando Soft X-Ray Spectroscopy
Step-by-Step Experimental Protocol
Protocol for In-Situ Soft XAS of an Electrocatalyst
Cell Assembly:
- Clean the silicon nitride membrane windows (100 nm thickness) with appropriate solvents.
- Deposit catalyst material onto the membrane using drop-casting, spin-coating, or physical vapor deposition methods.
- Assemble the electrochemical cell with the catalyst-working electrode, platinum counter electrode, and reference electrode (e.g., Ag/AgCl).
- Fill the cell with electrolyte (e.g., 0.1 M KOH for OER studies) ensuring no bubble formation.
Beline Alignment:
- Align the cell in the soft X-ray beamline to optimize the incident flux at the sample position.
- Calibrate the beam energy using a reference sample (e.g., metal foil for transition metal L-edge measurements).
- Set the appropriate incident angle (typically 20-45°) relative to the sample surface.
Electrochemical Control:
- Connect the potentiostat and establish stable electrochemical control.
- Measure the open circuit potential to verify proper cell operation.
- Begin applying the desired potential sequence while monitoring the current response.
Data Acquisition:
- Collect XAS spectra in total electron yield (TEY) or fluorescence yield (FY) mode.
- For operando measurements, simultaneously record electrochemical data (current, potential) synchronized with spectral acquisition.
- Acquire reference spectra at standard conditions for energy calibration.
Data Processing:
- Normalize spectra to the incident photon flux.
- Align energy scales using reference features.
- Subtract background signals using pre-edge regions.
- For quantitative analysis, perform linear combination fitting or principal component analysis to identify spectral components.
Protocol for RIXS Measurements of Electronic Structure
Sample Preparation: Prepare thin film samples (typically 50-200 nm thickness) on appropriate substrates to minimize self-absorption effects.
Energy Calibration: Pre-calibrate the incident energy using a known absorption edge and calibrate the emission spectrometer using elastically scattered radiation.
Resonant Excitation: Set the incident energy to specific resonances identified from XAS measurements and scan the emitted photon energy.
Data Collection: Acquire RIXS maps by scanning both incident and emitted energies to capture the full electronic excitation spectrum.
Spectral Analysis: Extract specific excitation features (dd excitations, charge transfer excitations) from the RIXS maps and compare with theoretical calculations.
Research Reagent Solutions and Essential Materials
Table 2: Essential Research Reagents and Materials for In-Situ/Operando Soft X-Ray Studies
| Material/Component | Function | Specific Examples | Critical Parameters |
|---|---|---|---|
| X-ray Transparent Membranes | Interface between vacuum and reaction environment | Silicon nitride (Si₃N₄), graphene | Thickness (50-200 nm), mechanical stability, chemical inertness |
| Reference Electrodes | Potential control in electrochemical cells | Ag/AgCl, reversible hydrogen electrode (RHE) | Stable potential, compatibility with electrolyte |
| Electrolytes | Ionic conduction in electrochemical cells | Aqueous (KOH, H₂SO₄), non-aqueous (organic carbonates) | Purity, oxygen/moisture content, ionic strength |
| Catalyst Materials | Active materials under investigation | Cobalt oxide clusters, oxide-derived copper, nickel complexes | Well-defined composition, controlled morphology |
| Calibration Standards | Energy calibration of spectrometer | Metal foils (Ni, Co, Cu), graphite | Well-characterized absorption features |
Correlation with Complementary Techniques
The combination of soft X-ray spectroscopy with other characterization methods provides a more comprehensive understanding of material properties and behavior. Correlative approaches bridge information across different length scales and from different physical perspectives:
Soft X-ray Microscopy with Electron Microscopy: Transmission electron microscopy (TEM) provides atomic-scale structural information, while soft X-ray microscopy (SXM) offers complementary chemical, electronic, and magnetic contrast from the nanoscale to the mesoscale. Correlative TEM and soft X-ray microscopy investigations on the same samples enable direct correlation of atomic structure with electronic and magnetic properties [5]. For example, this approach has been used to study magnetic nanoparticles, nanocatalysts, and 2D materials, providing insights that would be inaccessible using either technique alone.
Multi-Modal X-ray Studies: Combining XAS, XES, and RIXS provides a complete picture of both occupied and unoccupied electronic states and their interactions. These techniques can be further combined with X-ray diffraction to correlate electronic structure changes with structural transformations [23].
Figure 2: Correlative Microscopy and Spectroscopy Approach
Applications in Energy and Catalytic Materials
Solar Energy Materials
Soft X-ray spectroscopy has provided fundamental insights into the electronic structure of materials for solar energy conversion. For example, studies of semiconductor electrodes for photoelectrochemical water splitting have revealed the nature of charge separation under illumination and the electronic structure changes at the electrode/electrolyte interface [22] [24]. Fujishima and Honda's pioneering work on electrochemical photolysis of water at semiconductor electrodes laid the foundation for this field, and modern in-situ soft X-ray studies build upon this legacy by providing direct spectroscopic observation of the key processes [24].
Studies of nanostructured solar cell materials, including silicon nanocrystals and quantum-confined systems, have revealed how electronic properties change as a function of particle size. For instance, changes in the electronic properties of Si nanocrystals were directly correlated with quantum confinement effects using soft X-ray spectroscopy [22] [24]. These insights guide the rational design of more efficient solar energy conversion materials.
Electrocatalytic Systems
In electrocatalysis, operando soft X-ray spectroscopy has elucidated the active states of catalysts under working conditions. A notable example is the investigation of copper-based catalysts for CO₂ reduction, where in-situ soft X-ray spectroscopy revealed the formation of undercoordinated Cu sites that promote CO binding and enhance electrochemical activity [23]. However, these findings also highlight the importance of reactor design, as studies in different reactor configurations (e.g., batch liquid cells vs. vapor-fed devices) can yield different conclusions about the nature of the active sites [23].
Similar approaches have been applied to oxygen evolution reaction (OER) catalysts, such as cobalt oxide clusters in mesoporous silica, where soft X-ray spectroscopy identified the formation of higher oxidation states under anodic conditions [24]. These findings provide critical insights into the reaction mechanisms and guide the development of more efficient electrocatalysts for renewable energy conversion.
Energy Storage Materials
Soft X-ray spectroscopy has been increasingly applied to study energy storage materials, particularly through characterization of light elements (e.g., C, O) in battery electrodes and interfaces [22]. The high sensitivity of these techniques to the chemical state of carbon and oxygen enables investigation of solid-electrolyte interphase (SEI) formation, electrode degradation mechanisms, and redox processes in emerging battery chemistries.
For instance, in-situ soft X-ray absorption spectroscopy has been used to study the electrochemical corrosion of copper in aqueous NaHCO₃ solution, revealing the formation of specific corrosion products under potential control [24]. Similar approaches have been applied to study metal hydrides for energy storage applications, providing insights into their electronic structure changes during hydrogen absorption/desorption [24].
Challenges and Best Practices
Reactor Design Considerations
A significant challenge in in-situ/operando soft X-ray spectroscopy is the design of experimental cells that simultaneously provide optimal conditions for both the characterization technique and the realistic operation of the material system. Several key considerations must be addressed:
Mass Transport Limitations: Many in-situ reactors are designed for batch operation with planar electrodes, which can lead to poor mass transport of reactant species and the development of concentration gradients at the catalyst surface [23]. This can significantly alter the microenvironment compared to practical operating conditions, potentially leading to misinterpretation of spectroscopic data. For example, differences in reactor hydrodynamics have been shown to control Tafel slopes for CO₂ reduction by altering the microenvironment at the catalyst surface [23].
Signal-to-Noise Optimization: The path length of the X-ray beam through liquid electrolytes or gas atmospheres must be carefully optimized to balance sufficient interaction with the sample against attenuation of the incident and emitted beams. For grazing incidence measurements, co-optimizing X-ray transmission through the liquid electrolyte and the beam's interaction area at the catalyst surface is crucial for obtaining usable signal-to-noise ratios [23].
Proximity Considerations: For techniques that detect reaction intermediates or products, the proximity of the detection method to the active site critically impacts response time and sensitivity. In differential electrochemical mass spectrometry (DEMS), for example, depositing the catalyst directly onto the pervaporation membrane significantly reduces the path length between the catalyst surface and the mass spectrometry probe, enabling detection of short-lived intermediates [23].
Data Interpretation and Validation
The interpretation of in-situ/operando soft X-ray spectra requires careful consideration to avoid common pitfalls:
Control Experiments: Proper control experiments are essential for validating spectroscopic observations. These include measurements without the catalyst present, without reactants, and under non-reactive conditions to establish baseline signals and identify contributions from the cell components or environment [23].
Complementary Techniques: Given the inherent limitations of any single characterization technique, correlative approaches that combine multiple spectroscopic methods provide more robust insights. For example, combining XAS with XES and RIXS can distinguish between different proposed reaction mechanisms [22] [5].
Theoretical Modeling: Close integration with theoretical calculations, including density functional theory (DFT) and multiplet calculations, is essential for accurate interpretation of spectral features. Computational models can simulate spectra for proposed intermediate structures and help assign observed spectral changes to specific electronic or structural transformations [23].
Table 3: Common Challenges and Mitigation Strategies in In-Situ/Operando Soft X-Ray Studies
| Challenge | Impact on Data Quality | Mitigation Strategies |
|---|---|---|
| Radiation Damage | Sample degradation during measurement | Reduce flux, defocus beam, use rapid scanning methods |
| Spectral Complexity | Difficulty in assigning features | Use theoretical modeling, reference compounds, complementary techniques |
| Interface Sensitivity | Limited signal from buried interfaces | Use total electron yield for surface sensitivity, optimize detection geometry |
| Electrolyte Absorption | Attenuation of incident and emitted beams | Use thin electrolyte layers, optimize cell geometry |
| Time Resolution | Limited kinetics information | Use rapid-scan techniques, energy-dispersive geometries |
Future Perspectives
The field of in-situ/operando soft X-ray spectroscopy continues to evolve rapidly, with several emerging trends likely to shape future research:
Advanced Cell Designs: Next-generation experimental cells are incorporating more sophisticated features for controlling reaction conditions, including precise temperature control, high-pressure capabilities, and integrated product analysis. The development of cells that more closely mimic practical device configurations, such as zero-gap reactors for electrocatalysis, will enhance the relevance of mechanistic insights [23].
Time-Resolved Studies: The development of brighter X-ray sources and faster detectors will enable time-resolved studies on progressively shorter timescales, capturing transient intermediates and rapid dynamic processes in energy materials.
Correlative Microscopy: The combination of soft X-ray spectroscopy with high-resolution microscopy techniques will enable mapping of electronic structure with nanoscale spatial resolution, providing insights into heterogeneity and structure-function relationships in complex materials [5].
Data Science Integration: The growing complexity of multi-modal, time-resolved datasets is driving the integration of machine learning and other data science approaches for spectral analysis, feature identification, and physical modeling [23].
As these technical advances mature, in-situ/operando soft X-ray spectroscopy will continue to provide unprecedented insights into the dynamic electronic structure of interfaces under working conditions, guiding the development of next-generation energy and catalytic materials with enhanced performance and stability.
Understanding electron transfer across the metal–organic interface is fundamental for advancing nanoscale devices in catalysis, solar energy conversion, and molecular electronics [25]. This case study, framed within a broader thesis on soft X-ray spectroscopy, details the application of advanced spectroscopic techniques to probe ultrafast electron transport through aromatic molecular layers adsorbed onto gold nanoparticles (AuNPs). The insights gained from these interfacial studies are crucial for the rational design of nanoparticle-based devices with tailored electronic properties [26].
We present a consolidated experimental protocol for synthesizing condensed AuNP films, characterizing their electronic structure and molecular orientation, and quantitatively measuring electron transport times using the resonant Auger electron spectroscopy core-hole-clock (RAES-CHC) method. This integrated approach provides a powerful toolkit for investigating fundamental processes at hybrid inorganic-organic interfaces.
Experimental Protocols
Synthesis of Condensed AuNP Films
Principle: Form large-area, ordered monolayer films of aromatic-molecule-coated AuNPs at an air/water interface for subsequent electron transport studies. This method decouples interfacial ligand exchange from self-assembly, enabling the formation of films with excellent spatial homogeneity [27].
Procedure:
- Aqueous AuNP Colloid Preparation: Synthesize citrate-stabilized AuNPs (e.g., ~10-13 nm diameter) via the Turkevich method [27]. The NPs are electrostatically stabilized by negative citrate ions.
- Three-Phase System Setup:
- In a suitable container, create an interface between an aqueous phase and an oil phase (e.g., hexane or heptane). The oil phase contains the target aromatic amine ligand (e.g., 4-nitrothiophenol or similar derivatives).
- Carefully inject the aqueous AuNP colloid beneath the oil phase.
- The system now contains a water/oil interface and an air/water interface.
- Ligand Exchange and Translocation:
- Add a inducer (e.g., ethanol) to the aqueous phase to partially destabilize the AuNPs. This drives them to the water/oil interface.
- At the water/oil interface, the citrate ligands on the AuNPs are partially exchanged with the aromatic amine ligands from the oil phase. This creates AuNPs with a Janus structure and temporarily traps them at the interface.
- The functionalized AuNPs spontaneously migrate from the water/oil interface to the air/water interface, driven by the minimization of the system's Helmholtz free energy.
- Monolayer Formation:
- At the air/water interface, the AuNPs self-assemble into a centimeter-scale monolayer film with long-range hexagonal close-packed (HCP) order over several minutes.
- The interparticle center-to-center distance can be tuned by using aromatic ligands of different molecular lengths [27].
- Film Transfer: Deposit the floating monolayer film onto solid substrates (e.g., silicon wafers or specialized X-ray sample holders) using a "drain-to-deposit" or Langmuir-Blodgett technique for subsequent characterization [27].
Interface Characterization via Soft X-ray Spectroscopy
Principle: Utilize element-specific soft X-ray techniques to confirm the formation of oriented monolayers and analyze the electronic structure of the metal-organic interface [26] [28].
Protocol 1: X-ray Photoelectron Spectroscopy (XPS)
- Objective: Determine the elemental composition and chemical states of atoms at the AuNP-molecule interface. Conduct depth-dependent measurements by varying photon energy to probe different depths [25].
- Procedure:
- Transfer the condensed AuNP film to a conductive sample holder.
- In an ultra-high vacuum (UHV) chamber, irradiate the sample with a tunable soft X-ray beam (e.g., 400-800 eV).
- Measure the kinetic energy of emitted photoelectrons from core levels (e.g., Au 4f, S 2p, C 1s, N 1s).
- Calibration: For isolated NPs in vacuum, calibrate the kinetic energy scale using the known ionization energies of a dilute gas (e.g., Argon) [25].
- Record spectra at different photon energies to vary the inelastic mean free path (IMFP) of photoelectrons, providing depth-dependent chemical information from the outer atomic layers of the NPs [25].
- Data Analysis: Analyze the Au 4f spectrum for components corresponding to bulk-like Au atoms and surface Au atoms bonded to the molecular ligands. A shift to lower binding energy for surface Au atoms indicates altered electronic environment due to metal-molecule interaction [25].
Protocol 2: Near-Edge X-ray Absorption Fine Structure (NEXAFS) Spectroscopy
- Objective: Confirm molecular orientation and identify unoccupied molecular orbitals involved in electron transport [26] [28].
- Procedure:
- Mount the sample in a UHV chamber.
- Scan the incident soft X-ray energy across the absorption edge of the element of interest (e.g., Carbon K-edge at ~285 eV).
- Measurement Modes:
- Polarization Dependence: Use linearly polarized X-rays. Acquire spectra at different angles between the electric field vector (E) and the surface normal.
- Data Analysis: Examine the fine structure near the absorption edge. The intensity of specific resonances (e.g., π*) varies with the angle of incidence as I ∝ cos²(θ). This angular dependence is used to determine the average orientation of molecules on the surface [28]. For aromatic molecules, this reveals the tilt angle of the phenyl rings relative to the NP surface [26].
Quantifying Electron Transport via RAES-CHC
Principle: Measure the ultrafast electron transport time from a specific molecular group (e.g., carbonyl) through the aromatic system to the metal surface using the core-hole lifetime as an internal clock [26].
Procedure:
- Core Excitation: Tune the soft X-ray energy to resonantly excite a core electron from a specific atom in the molecular layer (e.g., oxygen in a carbonyl group) to an unoccupied molecular orbital.
- Decay Channel Monitoring: Monitor the two competing decay channels of the excited core-ionized state:
- Participator Decay: The excited electron fills the core hole, emitting a resonant Auger electron. This decay reflects the localized state.
- Spectator Decay: A different valence electron fills the core hole, and the initially excited electron remains in its orbital as a "spectator." The kinetic energy of the emitted Auger electron is shifted, indicating electron delocalization.
- Spectrum Acquisition: Acquire resonant Auger electron spectra across the core excitation resonance.
- Background Subtraction: Critically subtract spectral components arising from inelastic scattering and secondary processes to isolate the resonant signals [26].
- Data Analysis: The ratio of the delocalized (spectator) decay intensity to the localized (participator) decay intensity is measured. This ratio is directly related to the electron transport rate. The electron transport time (τtransfer) is calculated by comparing this ratio to the core-hole lifetime (τCH), which is well-known and acts as the reference clock: τtransfer = τCH * (Ideloc / Iloc) [26].
Data Presentation and Analysis
Key Quantitative Findings
Table 1 summarizes the primary quantitative data on electron transport times and interface properties obtained from the soft X-ray spectroscopy studies detailed in the protocols.
Table 1: Summary of Key Experimental Data from Electron Transport Studies
| Measurement | System | Key Finding | Technique | Reference |
|---|---|---|---|---|
| Electron Transport Time | Aromatic molecules on AuNPs | Ultrafast transport through phenyl rings; chain length dependence observed. | RAES-CHC | [26] |
| Au 4f Binding Energy Shift | NTP-coated AuNPs (10 nm) | Surface Au atoms shifted by ~0.8 eV to lower BE vs. bulk. | Depth-dependent XPS | [25] |
| Work Function Modification | NTP-coated AuNPs | Interface dipole facilitates electron transfer towards molecules. | XPS (Vacuum Level Ref.) | [25] |
| Molecular Orientation | Aromatic molecules on AuNPs | Oriented monolayers confirmed on both NP and flat films. | Polarization-Dependent NEXAFS | [26] |
| Interparticle Distance | AuNP Monolayer Film | Center-to-center distance tunable by ligand length (e.g., ~35-50 nm). | SEM, SAXS | [27] |
The Scientist's Toolkit: Essential Research Reagents and Materials
Table 2 lists the critical materials and their functions for conducting these experiments.
Table 2: Essential Research Reagents and Materials
| Item | Function/Description | Key Characteristic |
|---|---|---|
| Citrate-stabilized AuNPs | Core plasmonic nanoparticle platform. | Spherical, 10-13 nm diameter, aqueous colloidal dispersion. |
| Aromatic Thiol/Amine Ligands | Forms self-assembled monolayer; mediates electron transport. | Terminal functional group (e.g., nitro, ester); variable chain length. |
| Synchrotron Beamline | High-brilliance, tunable soft X-ray source. | Capable of XPS, NEXAFS, RAES; energy range 250-1000 eV. |
| Hexane/Heptane | Oil phase in three-phase self-assembly. | Immiscible with water; serves as ligand reservoir. |
| UHV Analysis Chamber | Environment for soft X-ray spectroscopy. | Pressure < 10⁻⁸ Torr; equipped with electron energy analyzer. |
| Silicon/SiN Substrate | Support for NP film transfer. | Chemically inert; low X-ray absorption. |
Visualization of Workflows and Mechanisms
Experimental Workflow for Interface Analysis
The following diagram illustrates the integrated experimental workflow from sample preparation to data analysis:
Electron Transport Mechanism at the Hybrid Interface
This diagram conceptualizes the electron transport process and key interfacial properties measured by the techniques in this study:
This application note provides a detailed protocol for investigating electron transport across the aromatic molecule-gold nanoparticle interface using soft X-ray spectroscopy. The combination of condensed NP film synthesis, multi-modal spectroscopic characterization (XPS, NEXAFS), and the quantitative RAES-CHC method offers a comprehensive approach to elucidate the structure-dynamics relationships at these complex hybrid interfaces. The findings confirm that electron transport follows a through-bond mechanism and can be rationally influenced by molecular design, providing a solid experimental foundation for engineering advanced NP-based electronic and catalytic devices.
Soft X-ray spectroscopy (sXAS) has emerged as a powerful analytical technique for investigating electronic and chemical states in energy storage materials. This capability is paramount for understanding and optimizing complex interfacial processes in lithium-ion batteries (LIBs) and related electrochemical storage devices. The functionality of these devices is governed by the electronic structure of their constituent materials and the chemical evolution at the electrode-electrolyte interfaces during operation. sXAS, with its inherent element-specificity and sensitivity to light elements, provides a unique window into these critical processes, probing the unoccupied electronic states of a material [29] [30]. This application note details the use of sXAS for studying electrodes, electrolytes, and the solid-electrolyte interphase (SEI), providing structured data, experimental protocols, and visualization tools for researchers in the field.
Fundamental Principles and the Research Toolkit
Core Principles of Soft X-Ray Spectroscopy
Soft X-ray spectroscopy encompasses several techniques that probe electronic structure by exploiting the interaction of soft X-ray photons (typically 100-2000 eV) with matter. sXAS measures transitions of core electrons to unoccupied states, providing a direct probe of the lowest unoccupied molecular orbital (LUMO) and higher unoccupied states [29]. Its exceptional utility in battery research stems from two key characteristics:
- Element Specificity: The absorption edges of light elements crucial for energy storage—such as carbon (∼284 eV), nitrogen (∼410 eV), oxygen (∼530 eV), and fluorine (∼690 eV)—fall within the soft X-ray range [30]. This allows for targeted investigation of these elements in complex, multi-component systems.
- Chemical Sensitivity: The fine structure of an sXAS spectrum is highly sensitive to the local chemical environment, oxidation state, and chemical bonding of the absorbing atom [29] [30]. This enables researchers to distinguish between different chemical species, such as various carbonate compounds or inorganic salts like LiF within the SEI.
Essential Research Reagent Solutions
The following table summarizes key materials and their functions commonly studied using sXAS in energy storage research.
Table 1: Key Research Reagents and Materials in Soft X-Ray Spectroscopy Studies
| Material Category | Specific Examples | Primary Function in Study | Relevant sXAS Edges |
|---|---|---|---|
| Anode Materials | Silicon (Si), Graphite, Tin (Sn) | High-capacity electrode material; study of lithiation mechanisms & SEI formation. | O K-edge, F K-edge, Si K-edge, C K-edge [31] [29] |
| Cathode Materials | Transition Metal Oxides (e.g., LiCoO₂) | Positive electrode material; investigation of redox chemistry & electronic structure. | Transition Metal L-edges (e.g., Co L-edge), O K-edge [29] |
| Electrolytes | Carbonates (EC, DMC, FEC) | Li⁺ conduction medium; study of decomposition pathways & solvation structures. | O K-edge, F K-edge, C K-edge [31] [30] |
| Additives | Fluoroethylene Carbonate (FEC) | SEI modifier; promotes formation of a stable, LiF-rich interphase [31]. | F K-edge, O K-edge [31] |
| Binders | Functionalized Polymers (e.g., with carbonyl groups) | Mechanical integrity; sXAS can verify electron conductivity upon lithiation via LUMO state analysis [29]. | C K-edge, O K-edge [29] |
Probing Electrode Materials and Interfaces
Investigation of the Solid-Electrolyte Interphase (SEI)
The SEI is a critical, nanoscale passivation layer that forms on anode surfaces, and its composition and stability are paramount for battery cycle life. sXAS offers a powerful method to probe the formation and chemical makeup of the SEI, both ex situ and, more importantly, operando.
- Operando Studies of SEI Formation: A key application is tracking SEI evolution in real-time. As demonstrated in studies on silicon anodes, operando sXAS in total electron yield (TEY) mode can detect the potential-dependent formation of specific SEI components, such as LiF and organic species like -(C=O)O- groups [31]. This reveals the sequential formation of inorganic and organic components, leading to a layered SEI structure [31].
- Role of Electrolyte Additives: sXAS effectively elucidates the mechanism of electrolyte additives. For instance, the addition of fluoroethylene carbonate (FEC) shifts the onset potential of SEI formation to higher values (e.g., 1.0 V vs. Li/Li⁺ compared to 0.6 V without FEC) and promotes the formation of LiF, which contributes to a more robust and protective SEI [31].
Table 2: Key SEI Components Identifiable via Soft X-Ray Spectroscopy
| SEI Component | Chemical Origin | Characteristic sXAS Feature |
|---|---|---|
| Lithium Fluoride (LiF) | Decomposition of LiPF₅ or FEC additive | Distinct peak shape & position at F K-edge [31] |
| Organic Carbonates | Reduction of cyclic/linear carbonates (e.g., EC, DMC) | Spectral features related to -C(=O)O- groups at O K-edge & C K-edge [31] |
| Polymeric Species | Cross-linked or polymerized ethylene oxide | Specific fine structure in C K-edge & O K-edge spectra [31] |
| Lithium Oxide (Li₂O) | Reduction of trace water or surface oxides | Characteristic peak at O K-edge [30] |
Analysis of Transition Metal-Based Cathodes
For cathode materials, sXAS at the transition metal L-edges is exceptionally sensitive to the metal's oxidation state, spin state, and local coordination environment due to dipole-allowed 2p→3d electronic transitions [29]. This allows researchers to quantitatively track the redox evolution of elements like Mn, Co, and Ni during battery charging and discharging, providing insights into charge compensation mechanisms and degradation pathways.
Diagram 1: Operando sXAS workflow for probing SEI formation mechanisms on an electrode surface, illustrating the process from applying bias to identifying chemical species and formation sequences.
Experimental Protocols and Data Presentation
Protocol for Operando sXAS of SEI Formation on Si Anodes
This protocol is adapted from a study investigating SEI formation on amorphous silicon (a-Si) anodes with and without the FEC additive [31].
1. Cell Preparation:
- Working Electrode: Deposit a thin film of amorphous silicon onto a current collector (e.g., copper).
- Counter/Reference Electrode: Use a lithium metal foil.
- Electrolyte: Use 1 M LiPF₆ in a mixture of ethylene carbonate (EC) and dimethyl carbonate (DMC), referred to as LP30. For the additive-containing electrolyte, add 5-10% wt. fluoroethylene carbonate (FEC) to LP30.
- Operando Cell: Assemble a custom electrochemical cell compatible with soft X-ray measurements, featuring a thin, X-ray transparent window (e.g., silicon nitride) to seal the cell while allowing the beam to enter.
2. Electrochemical Cycling and Data Acquisition:
- Place the operando cell in the sXAS spectrometer.
- Connect the cell to a potentiostat.
- Electrochemical Program: Cycle the cell between 2.0 V and 0.1 V (vs. Li/Li⁺) at a slow, constant current (e.g., C/30 for the first cycle).
- Spectroscopic Measurement: At predefined potential intervals during cycling (e.g., every 0.1 V), acquire soft X-ray absorption spectra.
- Edges to Measure: O K-edge (520-550 eV), F K-edge (680-700 eV), and Si K-edge (1830-1900 eV, requiring tender X-rays).
- Detection Mode: Use Total Electron Yield (TEY) for its high surface sensitivity (nm-scale depth), which is ideal for studying the thin SEI layer [31].
3. Data Analysis:
- Normalize the acquired spectra to the incident photon flux.
- Compare the spectra to reference compounds (e.g., LiF, Li₂CO₃, polycarbonates) for chemical identification.
- Plot the intensity of characteristic spectral features (e.g., the LiF peak at the F K-edge) as a function of applied potential to pinpoint the formation potential of specific SEI components.
Table 3: Key Quantitative Findings from Operando sXAS Study of Si Anodes [31]
| Experimental Condition | SEI Formation Onset Potential | Key Identified SEI Components | Electrochemical Performance |
|---|---|---|---|
| Without FEC (LP30) | ~0.6 V vs. Li/Li⁺ | LiF (forms first), Organic -(C=O)O- species (forms later) | Rapid capacity fade after ~50 cycles |
| With FEC Additive | ~1.0 V vs. Li/Li⁺ | LiF-rich SEI | Stable capacity retention over 100+ cycles |
Advanced Instrumentation: High-Resolution X-Ray Ptychography
For mapping chemical states with nanoscale resolution, scanning transmission X-ray microscopy (STXM) coupled with ptychography is a cutting-edge modality.
- Principle: Ptychography is a coherent diffractive imaging technique that uses computational methods to reconstruct a high-resolution image of a sample from a series of diffraction patterns generated by scanning a localized probe [32].
- Performance: This method can achieve ultrahigh spatial resolution down to 8 nm full-period, far surpassing the limitations of conventional X-ray optics [32].
- Application: It enables accurate quantification of chemical composition at the nanoscale, even for phases smaller than the probe size, which is crucial for studying heterogeneous materials like composite electrodes or non-uniform SEI layers [32].
Diagram 2: Workflow of X-ray ptychography for nanoscale chemical mapping, from the synchrotron source to computational reconstruction of high-resolution images.
Soft X-ray spectroscopy has established itself as an indispensable tool in the energy storage researcher's arsenal. Its unique ability to provide element-specific and chemically sensitive insights into the electronic structure of electrodes, the decomposition pathways of electrolytes, and the evolving chemistry of the SEI is unparalleled. The move towards operando characterization, coupled with advances in high-resolution microscopy like ptychography, allows for the direct observation of interfacial processes under working conditions. These capabilities are critical for guiding the rational design of more efficient, durable, and higher-energy-density battery systems, directly supporting foundational research into interfacial electron transport.
Overcoming Challenges: From Data Interpretation to In-Situ Experiment Design
Identifying and Subtracting Background Signals in Complex Nanomaterial Films
In the field of soft X-ray spectroscopy, achieving accurate quantitative analysis of nanomaterial films is fundamentally dependent on the precise identification and subtraction of background signals. This process is particularly critical for interfacial electron transport studies, where the electronic structure at interfaces governs charge transfer efficiency in devices ranging from lithium-ion batteries to catalytic systems. Soft X-ray absorption spectroscopy (sXAS) provides exceptional sensitivity to the electronic and chemical states of light elements and 3d transition metals, making it indispensable for probing the occupied and unoccupied states in complex nanomaterials [29]. However, the inherent complexity of nanomaterial films—with their heterogeneous phases, interfacial regions, and mixed chemical environments—introduces significant background contributions that can obscure meaningful spectroscopic information if not properly addressed.
The challenge is further compounded by the fact that conventional X-ray microscopy techniques suffer from point spread function (PSF) limitations that artificially mix chemical composition at phase interfaces, especially when chemical phases approach the width of the microscope PSF [32]. For researchers investigating interfacial electron transport, this spectral mixing can lead to substantial distortion in quantifying electronic states at the critical interfaces where electron transfer occurs. Recent advances in ultrahigh-resolution scanning transmission X-ray microscopy (STXM) and ptychographic imaging have demonstrated 8-nm full-period spatial resolution, providing unprecedented capability to resolve chemical phases at near-wavelength limits [32]. This technical note integrates these methodological advances with robust background subtraction protocols specifically tailored for complex nanomaterial films, providing researchers with a comprehensive framework for obtaining quantitatively accurate spectroscopic data.
Theoretical Background
Soft X-Ray Spectroscopy Fundamentals
Soft X-ray spectroscopy techniques probe electronic structures by measuring core-level electron transitions. In sXAS, the excitation of core electrons to unoccupied states provides direct information about the lowest unoccupied molecular orbital (LUMO) states, which is particularly valuable for understanding electron transport pathways [29]. The element-specificity of core-level edges enables targeted investigation of specific elements within complex nanomaterials, while the dipole-allowed transitions (e.g., 2p-3d for transition metals) offer sensitivity to oxidation states, ligand field effects, and orbital properties [29].
For nanomaterial films, the absorption coefficient μ(E) represents the combined signal from all phases and interfaces within the material. The measured signal I(E) can be expressed as:
I(E) = I₀(E)exp[-μ(E)t] + S_BG(E)
where S_BG(E) represents the background signal contributions that must be identified and subtracted for accurate analysis [12]. These background signals arise from multiple sources including scattering phenomena, sample thickness variations, and non-specific absorption.
Table 1: Common Background Sources in Nanomaterial X-Ray Spectroscopy
| Background Source | Spectral Manifestation | Primary Impact Region |
|---|---|---|
| Inelastic Scattering | Gradually increasing baseline | Pre-edge and post-edge |
| Sample Heterogeneity | Irregular absorption features | Entire spectrum |
| Self-Absorption Effects | Distorted edge jump | Near-edge region |
| Radiation Damage | Evolving spectral features | Multiple regions |
| Interface Mixing | Blended spectral signatures | Phase interfaces |
The multimodal nature of complex nanomaterials introduces unique background challenges. For biphasic systems with chemical phases smaller than the width of the microscope PSF, the measured chemical phase distribution appears uniform or mixed, requiring specialized approaches for accurate deconvolution [32]. This is particularly problematic for interfacial electron transport studies, where the electronic states at phase boundaries fundamentally regulate charge transfer processes.
Experimental Protocols
Sample Preparation and Optimization
Proper sample preparation is crucial for minimizing background artifacts in nanomaterial films:
Film Thickness Optimization: Prepare uniform films with optimal thickness based on the element of interest. For transition metal L-edges in the soft X-ray range, ideal thickness ranges from 100-200 nm to balance signal strength and self-absorption effects [12].
Substrate Selection: Use ultra-thin silicon nitride or graphene support membranes (thickness < 50 nm) to minimize substrate-derived background signals while maintaining mechanical stability [32].
Spatial Homogeneity Assessment: Characterize film homogeneity using scanning electron microscopy prior to X-ray analysis. Regions with thickness variations >15% should be avoided for spectroscopic measurements.
Reference Samples: Prepare single-phase reference materials matching suspected phases in the nanomaterial film. These references are essential for subsequent background modeling and subtraction.
Data Collection Strategies
Table 2: Data Collection Parameters for Background Minimization
| Parameter | Recommended Setting | Rationale |
|---|---|---|
| Energy Resolution | <0.1 eV at O K-edge | Sufficient to resolve fine spectral features |
| Spatial Resolution | <10 nm (ptychography) | Resolves individual phases in heterogeneous films [32] |
| Detection Mode | Fluorescence yield (dilute systems) | Maximizes signal for trace components |
| Scan Steps | 0.2 eV steps through edges | Adequate sampling of spectral features |
| Dwell Time | 5-50 ms/pixel (ptychography) | Balances signal-to-noise with radiation damage [32] |
Implement multi-energy imaging through the relevant absorption edges, collecting data both below and above the edge energy (typically 10-20 eV before the edge to 30-50 eV above the edge) [29]. This provides the necessary data for linear combination fitting and spectral deconvolution. For radiation-sensitive materials, utilize cryogenic sample environments (≤100 K) to mitigate beam-induced damage during extended data collection [32].
Background Subtraction Methodologies
Pre-Edge Background Modeling:
- Collect pre-edge data spanning 50-100 eV below the absorption edge
- Fit with a linear or quadratic function extrapolated across the entire energy range
- Subtract the fitted background from the entire spectrum
Post-Edge Normalization:
- Normalize spectra to the absorption edge jump (Δμ)
- Align spectra from different samples or regions to a common energy reference
Multicomponent Spectral Fitting:
- Utilize reference spectra from single-phase components
- Perform linear combination fitting (LCF) with non-negative constraints
- Employ principal component analysis (PCA) to identify statistically significant components
The normalized absorption coefficient μ(E) after background subtraction can be expressed as:
μnorm(E) = [μraw(E) - μpre(E)] / [μpost(E) - μ_pre(E)]
where μpre(E) represents the pre-edge background and μpost(E) represents the post-edge absorption [29].
Research Toolkit
Table 3: Essential Research Reagents and Instrumentation
| Item | Function/Specification | Application Note |
|---|---|---|
| Silicon Nitride Membranes | 10-50 nm thickness, 0.5-1 mm window size | Provides minimal background support for film deposition |
| Metallic Reference Foils | >99.9% purity, 1-5 μm thickness | Energy calibration and spectrometer alignment |
| Synchrotron Beamtime | High-brightness undulator source | Essential for high signal-to-noise nanospectroscopy |
| Cryogenic Sample Holder | Operates at 100 K with minimal vibration | Reduces radiation damage during prolonged measurements |
| High-Quantum Efficiency Detectors | Silicon drift detectors for fluorescence detection | Maximizes signal collection efficiency for dilute systems [12] |
Visualization and Data Analysis
Experimental Workflow
The following diagram illustrates the comprehensive workflow for background identification and subtraction in nanomaterial films:
Spectral Processing Pipeline
The spectral processing pipeline for accurate background subtraction involves multiple validation steps:
Applications in Interfacial Electron Transport
The accurate background subtraction protocols outlined above enable precise determination of electronic states at critical interfaces in nanomaterial films. For battery materials, sXAS with proper background treatment has revealed the special LUMO states in binder polymers with carbonyl groups, explaining their exceptional performance in high-capacity electrodes through efficient electron doping mechanisms [29]. In transition metal oxide systems, background-corrected L-edge sXAS provides quantitative information about 3d electron configuration evolution during electrochemical cycling, directly probing the redox states that govern electron transport at electrode-electrolyte interfaces [29].
For complex heterostructures, ptychographic imaging with 8-nm resolution combined with robust background subtraction enables accurate extraction of spectra from chemical phases with sizes near the X-ray spot size, where conventional microscopy fails due to PSF limitations [32]. This capability is transformative for interfacial electron transport studies, as it permits direct correlation of local electronic structure with interfacial morphology in operational devices.
The identification and subtraction of background signals in complex nanomaterial films represents a critical step in obtaining quantitatively accurate soft X-ray spectroscopic data for interfacial electron transport studies. By implementing the sample preparation protocols, data collection strategies, and analytical methods described in this technical note, researchers can significantly improve the reliability of their spectroscopic determinations. The integration of advanced ptychographic imaging with robust background correction algorithms enables unprecedented capability to resolve electronic states at nanoscale interfaces, providing fundamental insights into the electron transport mechanisms that govern performance in energy storage, catalytic, and electronic devices. As soft X-ray spectroscopy continues to evolve toward higher spatial resolution and faster data acquisition, the background subtraction methodologies outlined here will remain essential for transforming raw spectral data into meaningful physical understanding of interfacial phenomena in complex nanomaterials.
Addressing Radiation Damage and Sample Degradation During Measurement
Radiation damage is a fundamental and pervasive challenge in soft X-ray spectroscopy, particularly for sensitive studies of interfacial electron transport. When investigating delicate interfaces and soft materials, the very X-rays used for analysis can induce significant chemical, structural, and electronic changes, compromising data integrity. The high absorption cross-sections of carbon, nitrogen, and oxygen in the soft X-ray regime make biological samples, polymers, and many functional materials especially susceptible [33] [34]. This application note synthesizes current research to provide actionable protocols for quantifying, mitigating, and correcting for radiation damage, ensuring the reliability of spectroscopic data in electron transport studies.
Quantifying Radiation Damage: Critical Doses and Observable Effects
Understanding the thresholds of radiation damage is the first step in designing robust experiments. The critical dose, defined as the radiation dose required to reduce a characteristic spectroscopic feature's intensity by 63% (1-1/e), provides a key metric for comparing material susceptibility [33].
Table 1: Critical Doses for Selected Materials at ~300 eV Photon Energy (Data sourced from [33])
| Material | Critical Dose (MGy) | Primary Spectroscopic Signature of Damage |
|---|---|---|
| Poly(methyl methacrylate) (PMMA) | 80 | Decrease of C 1s → πCO peak at 288.45 eV; growth of C 1s(–C=C–) → π peak at 285.1 eV [33]. |
| Fibrinogen (Fg) Protein | 280 | Loss of carbonyl (C=O) functionality; formation of double bonds (C=C, C=N) [33]. |
| Polystyrene (PS) | 1230 | Decrease of C 1s → π*C=C peak at 285.1 eV [33]. |
| HEK293T Fixed Cells | > 2x10⁶ | Severe breakdown of the covalent bonding network observed via FTIR microscopy; mass loss [34]. |
Beyond organic materials, exfoliated 2D van der Waals materials also demonstrate significant degradation under prolonged synchrotron exposure. For instance, in NiPS₃, radiation damage manifests as the suppression and eventual vanishing of NiS₆ multiplet excitations in RIXS spectra, coupled with ligand expulsion and sample amorphorization [35].
The mechanism of damage proceeds through a common pathway. The initial absorption of an X-ray photon creates a core-hole, leading to the emission of photoelectrons and Auger electrons. These electrons cascade through the sample, generating secondary electrons and free radicals that break chemical bonds, ultimately leading to mass loss, structural disintegration, and altered electronic properties [33] [36].
Diagram 1: X-ray radiation damage mechanism and mitigation. The cascade from initial photon absorption to observable sample degradation is shown, with points of mitigation strategy intervention.
Experimental Protocols for Damage Assessment and Mitigation
Protocol: Quantifying Damage in Soft Materials Using NEXAFS Spectroscopy
This protocol outlines the procedure for determining the critical dose of a polymer or biological thin film using scanning transmission X-ray microscopy (STXM).
1. Materials and Reagents
- Sample Substrate: Silicon nitride membrane (e.g., 100 nm thickness) or native oxide silicon wafer.
- Sample Material: Thin, homogeneous film of the material under study (e.g., spin-cast PMMA, fibrinogen).
- Reference Material: A known, stable material for beam alignment and intensity normalization.
2. Equipment and Setup
- Microscope: Scanning Transmission X-ray Microscope (STXM) or X-ray Photoemission Electron Microscope (X-PEEM) at a synchrotron beamline.
- Detector: Photon-counting detector with high dynamic range.
- Environment: Vacuum or helium atmosphere to minimize parasitic absorption and environmental damage [33].
- Calibration: Energy calibration should be performed using a standard (e.g., CO₂ gas for C 1s edge).
3. Procedure
1. Locate and Map: Identify a pristine, representative region of the sample and acquire a high-signal-to-noise "map-stack" (a series of images at different energies across a core-level edge).
2. Define ROI: Define a specific Region of Interest (ROI) within the image for repeated spectral acquisition.
3. Acquire Initial Spectrum: Collect a NEXAFS spectrum from the ROI (I₀(E)).
4. Apply Dose and Monitor: Continuously expose the ROI to a fixed, known photon flux while periodically acquiring a new NEXAFS spectrum (I(E, D)). The dose D is calculated as (Photons/area) × (Absorption Cross-section).
5. Repeat: Continue until the spectral features of interest (e.g., the C=C peak for PS) show significant decay.
4. Data Analysis
1. Normalize Spectra: Normalize all acquired spectra I(E, D) to the incident flux and a post-edge reference value.
2. Track Feature Intensity: Plot the normalized intensity of a key spectroscopic feature (e.g., the π* peak) as a function of the cumulative dose.
3. Fit Kinetic Model: Fit the decay curve to a first-order kinetics model: I(D) = I₀ exp(-D/D_critical). The critical dose D_critical is the dose at which the intensity I(D) falls to I₀/e [33].
Protocol: Multi-Technique Validation of Radiation Damage in Fixed Cells
This protocol leverages Atomic Force Microscopy (AFM) and Fourier Transform Infrared Microscopy (FTIRM) to independently assess radiation damage induced by STXM [34].
1. Materials and Reagents
- Cell Line: Human Embryonic Kidney (HEK293T) cells or other relevant cell line.
- Fixative: 3.7% Paraformaldehyde (PFA) in Phosphate Buffer Solution (PBS).
- Substrate: 100 nm thick silicon nitride window.
2. Equipment and Setup
- Irradiation Source: STXM or other soft X-ray microscope.
- AFM: Atomic Force Microscope for nanoscale topographical analysis.
- FTIRM: Synchrotron Radiation FTIR Microscope for label-free biochemical mapping.
3. Procedure 1. Sample Preparation: Grow and fix cells on the silicon nitride window. Air-dry overnight [34]. 2. Baseline Characterization (Step 0): * Use AFM to map cellular topography and measure cell height/thickness. * Use SR-FTIRM to map biochemical distribution (e.g., lipids, proteins) via their IR fingerprints. 3. Vacuum Drying (Step 1): Place the sample under high vacuum (< 5×10⁻⁵ mbar) for 1.5 hours and repeat AFM/FTIRM characterization. 4. Incremental Irradiation: * Step 2: Expose the cell to a low X-ray dose (e.g., 2×10⁶ Gy). Re-characterize with AFM and FTIRM. * Step 3: Apply a medium dose (e.g., 2×10⁷ Gy cumulative). Re-characterize. * Step 4: Apply a high dose (e.g., 6×10⁸ Gy cumulative). Perform final AFM and FTIRM analysis [34].
4. Data Analysis * AFM Data: Quantify changes in cell volume, thickness, and surface roughness. * FTIRM Data: Analyze changes in intensities and shapes of key IR absorption bands (e.g., Amide I, C-H stretch) to track protein denaturation, lipid loss, and general breakdown of covalent bonds.
Protocol: Investigating Discontinuous Irradiation for Damage Mitigation
This protocol tests whether introducing "dark" periods between X-ray exposures can mitigate damage in small-molecule catalysts or organometallic complexes [36].
1. Materials and Reagents
- Sample: Crystalline powder of the radiation-sensitive material (e.g., [M(COD)Cl]₂ complexes).
- Capillary: Borosilicate glass capillary for powder X-ray diffraction (PXRD).
2. Equipment and Setup
- Diffractometer: Synchrotron PXRD beamline or laboratory X-ray Photoelectron Spectrometer (XPS).
- Dosimetry: Equipment to accurately measure and control photon flux.
3. Procedure 1. Continuous Exposure Control: Continuously expose a fresh sample region while collecting sequential data frames (e.g., PXRD patterns or XPS scans). Monitor the decay of a structural or chemical metric. 2. Discontinuous Exposure Test: On a new, pristine region of the sample, expose it to the same total flux and dose rate, but introduce regular "dark" periods (e.g., 60-second beam-off intervals after every 10 seconds of exposure). 3. Vary Dark Periods: Systematically vary the duration of the dark periods (e.g., 30 s, 60 s, 300 s) to probe the timescales of "dark progression" (damage that progresses after the beam is off).
4. Data Analysis * For PXRD, track changes in unit cell parameters, Bragg peak intensities, or B-factors. * For XPS, track changes in chemical oxidation states, peak intensities, or FWHM. * Compare the rate of degradation in the continuous vs. discontinuous irradiation experiments to determine the efficacy of the strategy [36].
Diagram 2: Experimental workflow for damage assessment. The flowchart outlines the key steps for preparing samples, applying different irradiation strategies, and analyzing the resulting damage.
The Scientist's Toolkit: Key Reagents and Materials
Table 2: Essential Research Reagents and Materials for Radiation Damage Studies
| Item | Function/Application | Key Considerations |
|---|---|---|
| Silicon Nitride Membranes | Sample substrate for STXM and X-PEEM. | Low X-ray absorption, electron optically transparent, compatible with vacuum [34]. |
| Polymer Thin Films (PMMA, PS) | Model radiation-sensitive samples for dose calibration. | Well-characterized critical doses; can be spun-cast into homogeneous films [33]. |
| Paraformaldehyde (PFA) | Chemical fixative for biological cells. | Preserves cellular morphology prior to vacuum and X-ray exposure [34]. |
| Aluminum Oxide (Al₂O₃) | Capping layer for exfoliated 2D materials. | Thin (~3 nm) layers can protect air-sensitive samples from ambient degradation during transfer and measurement [35]. |
| Helium Atmosphere | Environment for STXM measurements. | Reduces radiation damage rates compared to air or vacuum for certain organic materials [33]. |
| Cryo-Cooling Equipment | Sample cooling stage (LN₂). | Minimizes mass loss and radical diffusion; essential for many radiation-sensitive samples [36]. |
Proactive management of radiation damage is not optional but essential for generating reliable data in soft X-ray spectroscopy of interfaces. The protocols outlined here provide a framework for researchers to transition from ad-hoc damage avoidance to a quantitative and strategic approach. By first characterizing the critical doses for their specific systems and then implementing validated mitigation strategies—such as dose-controlled acquisition, multi-technique validation, and exploration of discontinuous irradiation—scientists can significantly enhance the fidelity of their findings in interfacial electron transport research.
Strategies for Probing Buried Interfaces and Liquid Environments
Buried interfaces—the regions where solid-liquid, solid-solid, or liquid-gas phases meet—are critical determinants of performance in technologies ranging from electrochemical cells and batteries to heterogeneous catalysts. Understanding their chemical composition and electronic structure is essential for advancing research on interfacial electron transport. Soft X-ray spectroscopy provides a powerful suite of tools for probing these hidden regions, offering unique insights into elemental composition, chemical states, and local atomic environments under realistic conditions. This document outlines key strategies and detailed protocols for investigating buried interfaces, with a specific focus on methodologies relevant to soft X-ray spectroscopy research.
Key Analytical Techniques
Standing-Wave Ambient-Pressure Photoelectron Spectroscopy (SWAPPS)
Principle: SWAPPS combines the depth-profiling capabilities of standing-wave photoelectron spectroscopy with the realistic environment control of ambient-pressure photoelectron spectroscopy. The technique generates an X-ray standing wave by interfering an incident X-ray beam with its reflection from a mirror substrate. By scanning this standing wave through the interface, researchers can achieve sub-nanometer depth resolution for all chemical elements present at heterogeneous interfaces [37].
Applications: This method is particularly valuable for studying the electrical double layer in batteries and fuel cells, as well as various solid/gas, liquid/gas, and solid/liquid interfaces critical to energy research, electrochemistry, and environmental science [37].
Table 1: Key Characteristics of SWAPPS
| Parameter | Specification | Significance |
|---|---|---|
| Depth Resolution | <1 nm | Enables precise localization of chemical species across interfaces [37]. |
| Pressure Range | Up to ~110 Torr | Allows study of interfaces under realistic environmental conditions [37] [38]. |
| Information Obtained | Elemental & chemical-state profiles, absolute concentrations [37]. | Provides quantitative analysis of interfacial composition. |
| Key Innovation | Combination of standing-wave field and exponential decay of photoelectron signal [37]. | Yields unprecedented depth resolution at buried interfaces. |
"Tender" X-Ray Ambient Pressure XPS (AP-XPS)
Principle: This approach utilizes X-rays in the "tender" energy range (2-7 keV) to generate high kinetic energy photoelectrons (up to 7 keV) that can escape through thicker material layers, including thin liquid films. A "dip & pull" method is employed to create a stable nanometer-thick aqueous electrolyte film on an electrode surface, enabling direct access to the solid-liquid interface [38].
Applications: Ideal for operando electrochemistry studies, such as investigating Pt electrode oxidation during the oxygen evolution reaction (OER), where it can identify the formation of Pt²⁺ and Pt⁴⁺ interfacial species [38].
Table 2: Performance of "Tender" X-Ray AP-XPS
| Parameter | Specification | Significance |
|---|---|---|
| Photon Energy | 2 - 7 keV | Optimal trade-off between photoelectron escape depth and photo-ionization cross-section [38]. |
| Liquid Film Thickness | Nanometers (e.g., 10-30 nm) | Enables probing of the crucial electrical double layer region [38]. |
| Pressure Capability | Up to 110 Torr | Facilitates studies at near-ambient conditions [38]. |
| Key Advantage | Direct probing of solid-liquid interface during electrochemical processes [38]. | Provides molecular-level insight into reaction mechanisms. |
Correlative Electron and Soft X-Ray Microscopy
Principle: This strategy involves correlating data from transmission electron microscopy (TEM) and soft X-ray microscopy (SXM) on the same sample. TEM provides atomic-scale structural information, while SXM yields complementary chemical, electronic, and magnetic information from the nano- to microscale [5].
Applications: Highly valuable for studying complex functional materials such as nanocatalysts, magnetic nanoparticles, and 2D materials, where structure-property relationships are key to performance [5].
Decelerated Scanning Electron Microscopy (SEM)
Principle: This non-destructive technique controls the penetration depth of an electron beam by decelerating it in the vicinity of the specimen. By tuning the beam energy, secondary electrons (SE) and backscattered electrons (BSE) are generated near a specific buried junction, allowing mapping of local electrical properties like junction resistance at a controlled depth [39].
Applications: Quality assurance in nanoelectronic device fabrication, enabling the identification of defects such as pinholes or impurities in buried junction interfaces without destructive cross-sectioning [39].
Experimental Protocols
Protocol for SWAPPS Measurements of a Solid-Liquid Interface
Objective: To determine the concentration and chemical-state profiles of electrolyte ions at a solid/liquid interface with sub-nanometer accuracy.
Materials:
- Single-crystal substrate (e.g., hematite, α-Fe₂O₃)
- Aqueous electrolyte solutions (e.g., NaOH, CsOH)
- SWAPPS endstation at a synchrotron beamline
- Syringe for liquid film formation
Procedure:
- Sample Preparation:
- Clean the single-crystal substrate using standard surface preparation protocols (e.g., sputtering-annealing cycles).
- Prepare the electrolyte solution at the desired molarity (e.g., 0.1 M NaOH + 0.01 M CsOH).
Liquid Film Formation:
- Introduce the electrolyte onto the solid surface within the SWAPPS analysis chamber.
- Form a stable, thin liquid film (nanometer thickness) using a precise dispensing system.
Standing Wave Generation:
- Align the substrate to act as a mirror for the incident soft X-ray beam.
- Adjust the incident angle to create a strong standing wave field above the substrate surface.
Data Acquisition:
- Scan the standing wave through the interface by rotating the sample through a series of angles.
- At each angle, collect photoelectron spectra for all relevant core levels (e.g., O 1s, C 1s, Na 1s, Cs 3d, Fe 2p).
- Record the photoelectron intensity as a function of the standing wave position.
Data Analysis:
- Reconstruct depth profiles for each element by fitting the photoelectron intensity vs. angle data.
- Use the binding-energy shifts to identify chemical states and their depth distribution.
Protocol for "Tender" X-Ray AP-XPS of an Electrochemical Interface
Objective: To perform operando analysis of a Pt working electrode during oxygen evolution reaction (OER).
Materials:
- "Tender" X-ray AP-XPS endstation with a Scienta HiPP-2 or equivalent high-energy electron analyzer.
- Three-electrode electrochemical cell (Pt working electrode, Pt counter electrode, reference electrode).
- 6 M KF electrolyte solution.
- Potentiostat.
Procedure:
- Electrode Preparation:
- Polish the Pt working electrode to a mirror finish.
- Clean the electrode via electrochemical cycling in dilute acid.
Thin Liquid Film Cell Assembly:
- Mount the electrochemical cell inside the AP-XPS chamber.
- Use the "dip & pull" method to create a thin electrolyte film on the Pt surface: submerge the electrode, then slowly retract it to leave a stable film of nanometer-scale thickness.
Electrochemical Control:
- Connect the cell to a potentiostat.
- Apply the desired potential (e.g., 1.6 V vs. RHE to drive OER).
In Situ XPS Measurement:
- Set the synchrotron beamline to a tender X-ray energy (e.g., 4 keV).
- Collect Pt 3d core-level spectra under operando conditions (applied potential).
- Also collect spectra of O 1s and other relevant elements.
Data Interpretation:
- Deconvolute the Pt 3d spectrum into components corresponding to Pt⁰ (metallic), Pt²⁺, and Pt⁴⁺.
- Track the relative concentrations of these species as a function of applied potential to understand the interfacial oxidation process.
Data Analysis and Machine Learning
The analysis of complex X-ray spectroscopy data, particularly X-ray Absorption Spectroscopy (XAS), is increasingly leveraging machine learning (ML) for efficiency and insight [40] [41].
Spectral Descriptors: ML models can be trained to establish quantitative relationships between intuitive spectral features (descriptors) and local atomic/electronic structure. Key descriptors for XANES analysis include [40]:
- Edge position (correlates with oxidation state)
- White line intensity and position
- Positions and intensities of minima and maxima (e.g., first pit)
- Curvature of spectral features
Machine Learning Framework: Platforms like XASDAML integrate the complete XAS analytical workflow [41]:
- Dataset Generation: Simulate XAS spectra from a range of structural models.
- Descriptor Evaluation: Extract key spectral and structural descriptors from the data.
- Model Training: Train ML algorithms (e.g., neural networks, random forests) to predict structural parameters from spectral descriptors.
- Prediction & Validation: Apply the trained model to predict coordination numbers, bond distances, and other structural parameters from experimental spectra.
This approach overcomes the challenge of systematic differences between theoretical and experimental spectra and provides a fast, automated tool for structural refinement [40].
The Scientist's Toolkit
Table 3: Essential Research Reagent Solutions and Materials
| Item | Function/Application | Example/Specification |
|---|---|---|
| Single-Crystal Substrates | Provides a well-defined, atomically flat surface for model studies of buried interfaces. | Hematite (α-Fe₂O₃), Platinum (Pt). |
| Aqueous Electrolyte Solutions | Creates the liquid environment for studying solid-liquid interfaces relevant to electrochemistry and energy research. | NaOH, CsOH, KF at various molarities (e.g., 0.1 M, 6 M) [37] [38]. |
| Scienta HiPP-2 Electron Analyzer | Detects high kinetic energy photoelectrons (up to 7 keV) in ambient pressure conditions, which is crucial for probing buried interfaces [38]. | High-transmission, high-energy electron spectrometer. |
| Potentiostat | Controls the electrochemical potential of the working electrode in operando experiments, enabling the study of interfaces under applied bias [38]. | Standard three-electrode setup. |
| XASDAML Software Framework | An open-source machine learning platform that streamlines the entire X-ray absorption spectroscopy data analysis workflow, from dataset generation to structural prediction [41]. | Python-based, Jupyter Notebook interface. |
Workflow Visualization
Diagram 1: Integrated workflow for probing buried interfaces, combining experimental techniques with machine learning analysis.
Optimizing Signal-to-Noise in Time-Resolved and Ultrafast Studies
Time-resolved soft X-ray spectroscopy has emerged as a powerful tool for investigating ultrafast processes at interfaces, providing unparalleled element specificity and chemical sensitivity. For researchers studying interfacial electron transport, the quality of the data and the validity of the conclusions are critically dependent on the Signal-to-Noise Ratio (SNR). Achieving sufficient SNR in these experiments presents unique challenges due to the low cross-sections of soft X-ray interactions, inherent source fluctuations, and sample damage thresholds. This Application Note synthesizes current methodologies and protocols for optimizing SNR in time-resolved and ultrafast soft X-ray studies, with a specific focus on applications in electron transport research. We provide a structured guide covering fundamental principles, experimental constraints, and practical optimization strategies to enable high-fidelity measurements of ultrafast interfacial dynamics.
Fundamental Principles and Experimental Constraints
Core Concepts in Signal-to-Noise Optimization
The signal intensity in time-resolved X-ray experiments is governed by the interplay between source parameters, sample characteristics, and detection efficiency. For nonlinear processes like soft X-ray second harmonic generation (SXSHG), the signal exhibits a quadratic dependence on the incident beam intensity I₀(ω), as expressed by I_SHG(2ω) = |χ_eff^(2)(2ω)|² (I₀(ω))² [42]. This nonlinear relationship means that modest increases in source intensity can yield substantial gains in signal, but also introduces sensitivity to source fluctuations. The fraction of photoexcited molecules (excitation density) is the most crucial parameter in pump-probe spectroscopies, directly proportional to the applied pump fluence [43].
Technical and Experimental Constraints
Several fundamental constraints limit SNR optimization in time-resolved soft X-ray studies:
- Excitation Density Limits: In robust samples like gases, excitation densities may reach ~25%, but in sensitive organic thin films and heterojunctions relevant to electron transport studies, damage thresholds typically constrain this to 1-5% [43]. Exceeding these thresholds introduces nonlinear artifacts and permanent sample damage.
- Source Fluctuations: The stochastic pulse energy variations in X-ray Free Electron Lasers (XFELs) – often varying from <100 to >500 μJ pulse-to-pulse – introduce significant noise that must be statistically addressed [42].
- Background Signals: Competing processes like transient absorption (TA) can reduce counts across spectral regions of interest, while source-generated harmonics create background that must be subtracted [42].
- Geometric Factors: In X-ray absorption spectroscopy (XAS), measurements in fluorescence mode are subject to self-absorption effects that distort spectra nonlinearly, particularly for concentrated samples or specific energy ranges [12].
Table 1: Key Constraints and Typical Values in Soft X-ray Spectroscopy
| Constraint Parameter | Typical Range/Value | Impact on SNR |
|---|---|---|
| Excitation Density (Organic Films) | 1-5% | Limits maximum achievable signal from photoexcited states |
| XFEL Pulse Energy Fluctuation | <100 to >500 μJ [42] | Introduces shot-to-shot noise requiring statistical correction |
| Measurement Repetition Rate | Varies by source (Hz-MHz) | Determines data averaging capability and integration time |
| Self-Absorption Effect Severity | Sample-dependent | Causes nonlinear distortion of fluorescence spectra |
Optimization Strategies and Methodologies
Source and Beamline Optimization
The strategic selection and optimization of source parameters is foundational to SNR improvement:
- High-Repetition-Rate Sources: Prioritize sources with higher repetition rates, which enable faster measurement and more robust averaging of single-shot fluctuations [43]. The development of MHz-rate XFELs represents a significant advancement in this regard.
- Intensity Management: For SXSHG experiments, leverage the intrinsic shot-to-shot fluctuations of the XFEL pulse energy to generate intensity dependence for identifying nonlinear signals through covariance mapping techniques [42].
- Pulse Energy Calibration: Implement non-invasive shot-by-shot pulse energy monitoring using devices like gas monitor detectors (GMDs) to establish a reliable intensity proxy for subsequent normalization [42].
Detection and Background Subtraction Schemes
Advanced detection strategies are essential for extracting weak signals from background:
- Covariance Mapping: Apply 2D covariance analysis of detector pixels to identify how intensities at different photon energies vary with respect to each other after subtracting intrinsic source correlations [42]. This technique effectively distinguishes SHG signals from competing transient absorption processes.
- Dual-Measurement Protocol: Acquire datasets both with and without the sample (e.g.,
jet-inandjet-outfor liquid microjets) to enable precise background subtraction of source-generated harmonics [42]. - Fluorescence Detection Geometry: Configure XAS measurements in 90° geometry with incident X-ray beam and detector at 45° relative to the sample surface normal to minimize background radiation and elastic scattering [12].
Sample Design and Experimental Geometry
Strategic sample design can dramatically enhance signal detection:
- Flat Liquid Sheet Microjets: Employ continuously-refreshing flat liquid sheet microjets with submicron thickness for transmission geometry measurements. This provides optically flat interfaces open to vacuum environment, constantly refreshes the sample to mitigate damage, and simplifies experimental design by enabling alignment without the sample present [42].
- Transmission vs. Fluorescence Mode: Use transmission mode for homogeneous samples with >10% concentration of the analyzed element, and fluorescence mode for dilute samples or those with non-uniform thickness [12].
- Self-Absorption Mitigation: For concentrated samples requiring fluorescence detection, perform measurements at small incident angles or apply post-processing corrections using dedicated XAS analysis programs like ATHENA [12].
Table 2: Detection Mode Selection Guidelines for XAS Measurements
| Measurement Mode | Optimal Sample Type | Advantages | Limitations |
|---|---|---|---|
| Transmission | Homogeneous samples with >10% analyte concentration; powder pellets, solutions of known concentration | High-quality spectra with short acquisition time; direct measurement | Requires specific sample thickness and homogeneity |
| Fluorescence | Dilute samples, trace elements, heterogeneous samples | High sensitivity for low concentrations; reduced matrix effects | Self-absorption effects distort spectra at high concentrations |
| Electron Yield | Surface-sensitive studies; electrically-conductive samples | Extreme surface sensitivity; minimal bulk contribution | Requires specific sample properties; potential charging effects |
Experimental Protocols
Protocol: SXSHG of Aqueous Interfaces
This protocol outlines the procedure for obtaining SXSHG spectra from the liquid water/vapor interface, adaptable to other liquid interfaces relevant to electron transport studies.
Materials and Equipment
- X-ray Source: Terawatt-scale attosecond soft X-ray pulses from an XFEL (e.g., LCLS with XLEAP capability) [42]
- Liquid Delivery System: Flat liquid sheet microjet assembly [42]
- Vacuum Chamber: Maintained at high vacuum to minimize X-ray attenuation
- Focusing Optics: Kirkpatrick-Baez mirrors for ~10 μm FWHM focusing [42]
- Detection System:
- Spectrometer capable of resolving fundamental and harmonic regions simultaneously
- Gas monitor detector for shot-by-shot pulse energy measurement
- Two ionization chambers for transmission measurements (for XAS)
Procedure
Source Preparation
- Configure XFEL to produce sub-femtosecond pulses using XLEAP technique
- Tune photon energy across the oxygen K-edge region (520-560 eV) in 5 eV steps
- Amplify pulses to TW-scale peak power using superradiant amplification
Sample Alignment
- Align the flat liquid sheet microjet into the beam path without the X-ray beam
- Optimize jet position for transmission geometry
- Verify jet stability and optical flatness
Background Characterization (Jet-out)
- Acquire spectral datasets without the liquid sheet in the beam path
- Record both fundamental and harmonic spectral regions
- Collect sufficient statistics across the full range of pulse energies (100-500 μJ)
Sample Measurement (Jet-in)
- Introduce the liquid sheet into the beam path
- Simultaneously measure fundamental and harmonic regions shot-by-shot
- Record pulse energy for each shot using the gas monitor detector
- Acquire data for each photon energy setting across the full pulse energy range
Data Processing
- Bin jet-in and jet-out data by pulse energy
- Subtract jet-out data from jet-in data after accounting for absorption through the water sample
- Apply covariance mapping techniques to distinguish SHG from transient absorption signals
- Normalize signals to account for intensity fluctuations
Troubleshooting
- Low SHG Signal: Verify X-ray focus quality on the liquid sheet; check jet flatness and stability
- Excessive Background: Ensure proper vacuum conditions; verify harmonic background subtraction using jet-out data
- Source Fluctuations: Increase statistical sampling across pulse energy range; verify GMD calibration
Protocol: Multimodal PCET Dynamics
This protocol describes a multimodal approach for studying proton-coupled electron transfer (PCET) dynamics, combining optical and X-ray spectroscopies to track coupled electron, proton, and solvent motion [44].
Materials and Equipment
- Laser System: Femtosecond optical pump laser (400 nm, 500 nm)
- X-ray Source: Ultrafast soft X-ray pulses for N K-edge spectroscopy
- Detection Systems:
- Optical transient absorption spectrometer
- Soft X-ray absorption spectrometer
- X-ray scattering detector
- Sample Environment: Flow system for solution samples, pH control
Procedure
Sample Preparation
- Prepare aqueous solution of transition metal complex (e.g., [Ru(bpy)₂(bpz)]²⁺)
- Adjust to appropriate pH (e.g., pH 1 for efficient excited-state protonation)
- Degas solution if necessary to eliminate oxygen quenching
Optical Pump-X-ray Probe Measurements
- Align optical pump and X-ray probe beams with temporal overlap
- Collect OTA data with ~180 fs instrument response function
- Acquire N K-edge XAS at selected delay times
- Perform simultaneous X-ray scattering measurements
Multimodal Data Acquisition
- Collect reference spectra before time-resolved measurements
- Acquire data at multiple delay times to capture dynamics from femtoseconds to nanoseconds
- Monitor mass spectra in situ if available to identify fragmentation products
Data Correlation and Analysis
- Perform global analysis of OTA data to identify evolution-associated spectra
- Correlate XAS spectral changes with specific electronic and structural changes
- Integrate X-ray scattering data to track solvent reorganization
- Compare with computational simulations for mechanistic interpretation
Timing Considerations
- Electronic Redistribution: Occurs within instrument response function (<180 fs)
- Ligand Protonation: Typically occurs within ~100 ps
- Solvent Reorganization: Coupled to protonation dynamics, extends to hundreds of ps
The Scientist's Toolkit
Table 3: Essential Research Reagent Solutions for Time-Resolved Soft X-ray Studies
| Reagent/Equipment | Function/Application | Key Characteristics |
|---|---|---|
| Flat Liquid Sheet Microjet [42] | Provides constantly-refreshing liquid interface for vacuum-based measurements | Submicron thickness; optically flat surfaces; suitable for transmission geometry |
| Transition Metal Complexes (e.g., [Ru(bpy)₂(bpz)]²⁺) [44] | Model systems for PCET and electron transfer studies | Well-characterized optical properties; tunable redox properties; site-specific protonation |
| Kirkpatrick-Baez Mirrors [42] | Focusing X-ray beams to small spot sizes | ~10 μm FWHM focusing; compatible with high-intensity XFEL pulses |
| Gas Monitor Detector [42] | Non-invasive shot-by-shot pulse energy measurement | Essential for intensity normalization and fluctuation analysis |
| Silicon Nitride Membranes [45] | Sample support for sensitive or vacuum-incompatible materials | Thin, X-ray transparent windows; compatible with different plunge-freezing methods |
Visualizations
SXSHG Experimental Workflow
Multimodal PCET Investigation
Optimizing signal-to-noise in time-resolved and ultrafast soft X-ray studies requires a systematic approach addressing source parameters, detection methodologies, and sample design. The protocols and strategies outlined here provide a framework for overcoming the fundamental constraints of excitation density limits, source fluctuations, and background signals. For researchers investigating interfacial electron transport, the combination of intensity-resolved measurements, covariance analysis, and multimodal approaches enables the extraction of meaningful signals even from weakly responding systems. As source technologies continue to advance toward higher repetition rates and improved stability, the SNR challenges in these experiments will progressively diminish, opening new possibilities for observing ultrafast electron dynamics with atomic-site specificity and temporal resolution.
Validating Insights: Cross-Technique Comparisons and Model Verification
Correlative soft X-ray and electron microscopy represents a paradigm shift in nanoscale and functional materials research. This multimodal approach seamlessly integrates the mesoscale imaging capabilities of soft X-ray tomography (SXT) with the atomic-resolution power of transmission electron microscopy (TEM), creating a comprehensive pipeline for analyzing complex phenomena across multiple length scales. For research focused on interfacial electron transport studies, this correlation is particularly transformative, as it enables researchers to link functional electronic properties revealed by SXT with structural atomic arrangements visualized via TEM [46].
The fundamental strength of this methodology lies in bridging the resolution gap that has traditionally separated cellular and subcellular imaging techniques. Soft X-ray tomography excels at imaging fully hydrated, cryogenically preserved biological samples in their native state, revealing ultrastructural details without requiring staining, embedding, or sectioning [47]. When correlated with TEM's unparalleled resolution for detailed structural analysis, this combination provides unprecedented insights into material interactions and biological processes at interfaces where electron transport phenomena occur [48] [46].
Technical Foundations and Instrumentation
Soft X-Ray Microscopy (SXT) Fundamentals
Soft X-ray tomography operates within the "water window," a specific region of the X-ray spectrum between the K-absorption edges of carbon (284 eV) and oxygen (543 eV). This energy range provides natural contrast for biological and organic materials, as carbon-rich cellular structures absorb X-rays significantly more strongly than the surrounding oxygen-rich water [49]. This inherent contrast mechanism enables high-resolution imaging of unstained, fully hydrated specimens, preserving them in a near-native state that is crucial for accurate interfacial studies.
Recent technological advances have transformed SXT from a synchrotron-exclusive technique to one accessible in laboratory settings. Compact soft X-ray microscopes now utilize laser-driven plasma sources, achieving resolutions of 54 nm full-pitch with tomogram acquisition times ranging from 30 minutes to two hours [47]. This democratization of SXT technology has significantly broadened its application potential for correlative studies, making it more readily available for interdisciplinary research programs.
Electron Microscopy Complementarity
Transmission electron microscopy provides the structural counterpart to SXT's functional imaging capabilities. TEM reveals atomic-scale details of interfaces, crystal structures, and material compositions that underlie the electron transport phenomena observed through softer X-ray techniques. The correlation of these modalities creates a complete picture, linking macroscopic function with nanoscale structure [46].
For biological interfaces, TEM offers detailed visualization of membrane structures, protein complexes, and cellular organelles that facilitate electron transport processes. In materials science research, TEM reveals defects, grain boundaries, and interfacial layers that govern charge transfer mechanisms. This structural context is essential for interpreting the functional data obtained through soft X-ray spectroscopy and microscopy techniques [48].
Quantitative Performance Metrics
Table 1: Performance Characteristics of Correlative Soft X-Ray and Electron Microscopy
| Parameter | Soft X-Ray Tomography (SXT) | Transmission Electron Microscopy (TEM) | Correlative Benefit |
|---|---|---|---|
| Resolution | 54 nm full-pitch [47] | Atomic scale (≤1 nm) [46] | Bridges meso- to atomic scale |
| Sample Thickness | Up to 10 μm [49] | Typically <200 nm | Enables targeted ultrathin sectioning |
| Contrast Mechanism | Native absorption in water window [49] | Scattering, phase contrast | Complementary information |
| Sample Environment | Fully hydrated, cryogenic [47] | High vacuum | Preserved native state for targeting |
| Elemental Sensitivity | Moderate (C, O, N) | High with EDS | Comprehensive elemental analysis |
| Imaging Time | 30 min - 2 hours [47] | Variable (hours-days) | Efficient region of interest identification |
Table 2: Research Reagent Solutions for Correlative Microscopy
| Reagent/Material | Function | Application Notes |
|---|---|---|
| TEM Grids | Sample support | Enable correlation via same substrate imaging [49] |
| Cryogenic Fluids (Liquid Ethane) | Vitrification | Preserves native hydration state [49] |
| Metal-based Nanoparticles (MoO₂) | Contrast agents/tracers | Study cellular uptake and distribution [49] |
| Cryo-Preparation Systems | Sample vitrification | Controlled blotting (1-3 sec optimal) [49] |
| Fiducial Markers | Registration landmarks | Enable precise image correlation [50] |
| Ice Thickness Monitor | Quality control | Ensures optimal 5-10 μm thickness [49] |
Protocol: Sample Preparation for Correlative SXT-TEM Imaging
Cryogenic Fixation for Hydrated Specimens
Proper sample preparation is the critical foundation for successful correlative SXT-TEM studies. The protocol must preserve native structures while enabling optimal imaging across both modalities.
Cell Culture and Nanoparticle Exposure: Culture cells (e.g., murine macrophages RAW 264.7 or Acanthamoeba castellanii) directly on TEM grids. Expose to nanoparticles (e.g., MoO₂ NPs) for uptake studies relevant to electron transport interfaces [49].
Vitrification with Thickness Control: Utilize either manual or automated plunge-freezing systems. For manual systems, implement real-time monitoring to achieve the critical 5-10 μm ice thickness, indicated by a distinct crescent-shaped pattern on the grid [49]. For automated systems (e.g., Vitrobot-IV), optimize blotting parameters:
- Macrophages: 2-second blot time
- Amoebas: 3-second blot time
- Maintain 100% humidity and 4°C environment during blotting
Quality Assessment: Verify ice thickness and sample preservation before proceeding to imaging. Suboptimal thickness (>10 μm) reduces X-ray transmission and contrast, while excessive blotting (<2s for macrophages) causes cellular morphological alterations [49].
Correlative Imaging Workflow
Workflow Diagram: Correlative SXT-TEM Imaging Pipeline
Image Registration and Data Correlation
Accurate registration of SXT and TEM datasets is essential for meaningful correlative analysis. The eC-CLEM plugin for Icy software provides an open-source solution for this challenging task [50].
Data Preparation: Collect all SXT and TEM image files in a single directory, including:
- SXT tomograms (.rec or .mrc format)
- TEM micrographs
- Grid maps and brightfield images for orientation
Software Configuration: Install Icy bioimage analysis platform with eC-CLEM plugin (version 2.0.1 or newer). Configure memory settings to allocate sufficient RAM (≥16 GB recommended) for handling large 3D datasets [50].
3D Registration:
- Load SXT tomogram as reference volume
- Import TEM data series as target dataset
- Identify corresponding fiducial points in both modalities
- Apply affine transformation for initial alignment
- Refine with non-linear registration for optimal overlay
Validation and Analysis: Use Correlative View plugin to create overlay images without resolution loss. Verify registration accuracy by checking organelle boundaries or nanoparticle locations across modalities [50].
Application to Interfacial Electron Transport Studies
The correlative SXT-TEM approach provides unique insights into electron transport phenomena at biological and synthetic interfaces. In nanocatalysis research, this methodology links the mesoscale distribution of catalytic nanoparticles with their atomic-scale structure and composition, revealing structure-function relationships that govern electron transfer efficiency [46].
For functional materials characterization, particularly in energy storage systems like lithium-ion batteries, correlative microscopy bridges the electrode-electrolyte interface across multiple length scales. SXT visualizes lithium ion distribution and phase segregation at mesoscale, while TEM reveals the atomic structure of interface layers and solid-electrolyte interphases that control ion transport [48].
In biological systems, this approach elucidates electron transport chains in mitochondrial membranes and photosynthetic complexes. SXT identifies the spatial organization of these membrane systems within intact cellular environments, and TEM reveals the precise structural arrangement of protein complexes that facilitate electron transfer reactions [47] [46].
Future Perspectives and Protocol Optimization
The field of correlative soft X-ray and electron microscopy continues to evolve rapidly. Future developments will focus on enhanced throughput, deeper integration of correlative imaging modalities, and extension to more complex specimen types including tissues and advanced functional materials [47]. Emerging techniques like time-correlation X-ray photoelectron spectroscopy (TCXPS) offer potential for monitoring real-time electron dynamics at interfaces, providing complementary functional data to structural correlations [51].
Protocol optimization will likely address current limitations in sample preparation, particularly for radiation-sensitive materials. Advanced cryogenic techniques, integrated with machine learning approaches for automated data analysis and registration, will streamline the correlative workflow and enhance reproducibility across research laboratories [49].
For researchers investigating interfacial electron transport, the ongoing development of laboratory-based SXT systems represents a particularly significant advancement, making this powerful correlative approach more accessible for studying dynamic electron transfer processes under various environmental and experimental conditions [47].
Comparing Electron Transport in Nanoparticle Films vs. Flat Monolayers
Understanding electron transport at molecule-metal interfaces is fundamental for advancing nanoscale electronics, photovoltaics, and electrochemical sensing platforms. While flat monolayer systems have been extensively studied, condensed nanoparticle (NP) films present a more complex and technologically relevant architecture due to their high surface area-to-volume ratio and unique electronic properties. The investigation of ultrafast electron transport across these interfaces requires specialized techniques capable of femtosecond temporal resolution and elemental specificity. Soft X-ray spectroscopy has emerged as a powerful methodology for probing these dynamics, particularly through the resonant Auger electron spectroscopy with the core-hole-clock (RAES-CHC) approach. This application note details the comparative methodologies and protocols for studying electron transport in aromatic molecule-coated gold nanoparticle films versus flat monolayer systems, providing researchers with a framework for extracting quantitative transport parameters and understanding interface-specific phenomena.
Experimental Principles and Techniques
Core-Hole-Clock Methodology
The core-hole-clock (CHC) approach utilizes the natural lifetime of core-hole states (typically 1-10 femtoseconds for light elements) as an intrinsic timer for measuring electron transfer rates [26] [3]. When a core electron is resonantly excited by soft X-ray radiation, the resulting core-hole state can decay through either resonant Auger electron spectroscopy (RAES) or electron transfer to the metal substrate. The competition between these processes provides a direct pathway to quantify electron transport times:
- Fast electron transport (shorter than core-hole lifetime): Electron transfers to metal before Auger decay, reducing resonant Auger yield
- Slow electron transport (longer than core-hole lifetime): Auger decay occurs before electron transfer, producing normal resonant Auger features
The RAES-CHC approach enables measurement of electron transport times ranging from hundreds of femtoseconds to subfemtosecond domains, providing distinct advantages over optical techniques like transient laser spectroscopy, which are typically limited to subpicosecond timescales [3].
Complementary Characterization Techniques
Multiple soft X-ray techniques provide correlated structural and electronic information:
- X-ray photoelectron spectroscopy (XPS): Determines elemental composition, chemical states, and molecular layer thicknesses through core-level binding energy shifts and intensity analysis [26] [3]
- Near-edge X-ray absorption fine structure (NEXAFS) spectroscopy: Probes unoccupied electronic states and molecular orientation through polarization-dependent measurements [26] [3]
- Time-of-flight mass spectrometry (TOF-MS): Investigates nuclear dynamics and site-selective bond scission following core-level excitation [3]
Table 1: Key Soft X-Ray Spectroscopy Techniques for Electron Transport Studies
| Technique | Information Obtained | Experimental Parameters | Applications in Transport Studies |
|---|---|---|---|
| RAES-CHC | Electron transport times (femtosecond scale) | Resonant core excitation; Auger electron detection | Ultrafast electron transfer from specific molecular sites to metal surfaces |
| XPS | Elemental composition, chemical states, layer thickness | Al Kα or Mg Kα radiation; hemispherical analyzer | Verification of monolayer formation; chemical environment characterization |
| NEXAFS | Unoccupied states, molecular orientation | Polarized soft X-rays; drain current or fluorescence yield | Molecular orientation determination; electronic structure mapping |
| TOF-MS | Nuclear dynamics, site-specific reactions | Pulsed soft X-rays; time-of-flight mass analyzer | Desorption kinetics; bond cleavage studies after core excitation |
Materials and Reagent Solutions
Nanoparticle Synthesis and Functionalization
- Gold nanoparticles (7 nm average size): Synthesized via pulsed laser ablation in liquid [3]
- Aromatic thiols: Methyl 4-mercaptobenzoate (MP) and methyl 4'-mercapto(1,1'-biphenyl)-4-carboxylate (MBP) as molecular bridges with methyl ester substituents as X-ray absorption centers [26] [3]
- Reference molecules: Methyl 16-mercaptohexadecanoate (MHDA) for photon energy calibration; 1-hexadecanethiol (HD) for XPS film thickness reference [3]
- Solvents: High-purity ethanol or toluene for solution-phase functionalization
Substrate Preparation
- Flat Au substrates: Template-stripped gold or single-crystal Au substrates for flat monolayer formation
- Custom gold grids (HZB-2 design): Specialized grids with smaller slots from Gilder Grids, coated with R2/2 perforated carbon foil (Quantifoil) for NP film deposition [52]
Research Reagent Solutions
Table 2: Essential Research Reagents and Materials
| Reagent/Material | Function/Application | Source/Specifications |
|---|---|---|
| Methyl 4-mercaptobenzoate (MP) | Short-chain aromatic molecular bridge with ester group | Toronto Research Chemicals Inc. |
| Methyl 4'-mercapto(1,1'-biphenyl)-4-carboxylate (MBP) | Extended aromatic molecular bridge for length-dependent studies | NARD Institute Ltd. |
| Methyl 16-mercaptohexadecanoate (MHDA) | Photon energy calibration reference | NARD Institute Ltd. |
| 1-Hexadecanethiol (HD) | Reference for XPS thickness measurements | Tokyo Chemical Industry |
| Gold nanoparticles (7 nm) | Metallic core for electron acceptor studies | Pulsed laser ablation synthesis |
| Custom gold grids (HZB-2) | Support for NP film deposition | Gilder Grids with specialized design |
| R2/2 perforated carbon foil | Grid coating for adherent cell growth | Quantifoil Micro Tools GmbH |
Experimental Protocols
Sample Preparation Methods
Flat Monolayer Film Preparation
- Substrate pretreatment: Clean flat Au substrates via UV-ozone treatment or oxygen plasma etching
- Self-assembled monolayer formation: Immerse Au substrates in 1 mM ethanolic solutions of aromatic thiols for 18-24 hours at room temperature [3]
- Post-assembly rinsing: Rinse thoroughly with pure ethanol to remove physisorbed molecules
- Sample characterization: Verify monolayer quality using contact angle measurements and ellipsometry before spectroscopic analysis
Condensed Nanoparticle Film Preparation
- Gold nanoparticle synthesis: Prepare 7 nm AuNPs via pulsed laser ablation in liquid [3]
- Solution-phase functionalization: Mix AuNP colloidal solution with excess aromatic thiol solution (typical molar ratio 1:10,000) and stir for 12 hours [3]
- Purification: Remove residual thiol molecules through repeated centrifugation and redispersion cycles
- Film deposition: Drop-cast functionalized AuNP solution onto Au substrates and allow to dry under controlled atmosphere
- Film characterization: Verify NP film morphology and coverage using scanning electron microscopy or atomic force microscopy
Soft X-Ray Spectroscopy Measurements
Synchrotron Beamline Configuration
- Beamline selection: Utilize bending magnet beamlines (e.g., HiSOR BL-13) for NEXAFS, XPS, and RAES measurements [3]
- Ultra-high vacuum conditions: Maintain pressure at ∼10⁻⁸ Pa during electron spectroscopy measurements [3]
- Energy calibration: Reference to known absorption features (π*(C=O) peak of MHDA at 288.4 eV for C K-edge; 532.3 eV for O K-edge) [3]
- Photon polarization: Characterize polarization (typically >95%) using oriented reference samples
NEXAFS Spectroscopy Protocol
- Measurement mode: Collect both total electron yield (drain current) and fluorescence yield spectra
- Angle-dependent studies: Acquire spectra at multiple incident angles (20°, 55°, 90°) to determine molecular orientation [3]
- Data processing: Normalize spectra to incident photon flux (I₀) measured from upstream Au mesh
- Background subtraction: Remove sloping baseline through linear pre-edge fitting
RAES-CHC Measurements
- Resonant excitation: Tune photon energy to specific core resonances (e.g., C 1s→π*(C=O) transition at ~288.4 eV) [3]
- Auger electron detection: Use hemispherical analyzer with wide slit settings (4 mm) for increased throughput [3]
- Energy resolution: Set analyzer pass energy to optimize resolution and count rate trade-offs
- Inelastic background subtraction: Employ established procedures to remove secondary electron contributions [26]
TOF-MS Measurements for Nuclear Dynamics
- Bunch timing: Utilize hybrid operation mode with high-current bunch and trains of low-current bunches [3]
- Pulse selection: Mechanically extract high-current SR component using pulse selector [3]
- Ion detection: Position microchannel plate with TOF drift tube perpendicular to sample surface
- Mass calibration: Use standard compounds with known fragmentation patterns
Diagram 1: Experimental workflow for comparative electron transport studies showing parallel sample preparation pathways converging on spectroscopic characterization and data analysis.
Key Findings and Data Analysis
Quantitative Electron Transport Parameters
The RAES-CHC analysis reveals distinct electron transport characteristics between NP films and flat monolayers:
Table 3: Comparative Electron Transport Properties
| System Characteristic | Flat Monolayer Films | Condensed Nanoparticle Films | Experimental Evidence |
|---|---|---|---|
| Transport mechanism | Through-bond conduction | Through-bond conduction (dominates) | Exponential length dependence persists in both systems [26] |
| Chain length dependence | Exponential decay with length | Exponential decay with length | Transport time increases with molecular length in both systems [26] [3] |
| Inter-molecule effects | Minimal | Significant molecule-molecule interactions | Background subtraction required for NP films [26] |
| Transport timescale | Femtosecond range | Femtosecond range | Comparable timescales after background correction [26] |
| Site-specificity | Selective excitation possible | Selective excitation with background | Site-selective desorption of methyl ester group observed [3] |
Spectroscopic Signatures and Molecular Orientation
- XPS analysis: No significant chemical shift differences between NP and flat films, indicating similar chemical environments [3]
- NEXAFS orientation determination: Polarization dependence shows oriented monolayers in both systems, though NP films may exhibit greater disorder
- Inelastic background: Condensed NP films require sophisticated background subtraction to isolate primary electron transport signals from secondary processes [26]
Nuclear Dynamics and Site-Selective Chemistry
Time-of-flight mass spectrometry reveals distinctive nuclear dynamics:
- Site-selective desorption: Resonant core excitation at methyl ester group leads to selective bond scission in both systems [3]
- Ion yield spectra: Similar fragmentation patterns but different relative intensities between NP and flat films
- Secondary processes: Enhanced secondary electron effects in condensed NP films require spectral deconvolution
Diagram 2: Core-hole-clock analysis principle showing the competition between electron transport and Auger decay pathways that enables femtosecond transport time measurements.
Discussion and Interpretation
Through-Bond Transport Dominance
The experimental evidence strongly supports the prevalence of through-bond transport mechanisms in both NP films and flat monolayers [26]. This conclusion is substantiated by:
- Exponential length dependence of electron transport times with molecular chain length in both systems
- Consistent transport trends between flat and NP films, suggesting similar fundamental mechanisms
- Minimal effect of inter-molecule interactions on transport pathways in condensed NP films
Practical Implications for Device Design
The demonstrated similarity in electron transport mechanisms between flat monolayers and NP films has significant practical implications:
- Model system extrapolation: Insights from well-characterized flat monolayer systems can be reliably extended to more complex NP-based device architectures [26]
- Molecular design principles: Chain length and functional group optimization strategies developed for flat films apply directly to NP systems
- Interface engineering: The persistence of through-bond transport in condensed films guides interface design for NP-based electronics and sensors
The comparative investigation of electron transport in nanoparticle films versus flat monolayers using soft X-ray spectroscopy reveals fundamental similarities in transport mechanisms despite architectural differences. The RAES-CHC methodology provides direct access to femtosecond-scale transport times, demonstrating that through-bond conduction dominates in both systems with characteristic exponential length dependence. The experimental protocols detailed herein enable researchers to quantitatively characterize interfacial electron dynamics in complex nanoscale architectures, providing critical insights for the molecular design of nanoparticle-based electronic devices, sensors, and energy conversion systems. The ability to extrapolate findings from well-controlled flat monolayer systems to practical nanoparticle interfaces significantly accelerates the development and optimization of molecular-scale electronic components.
Linking Spectroscopic Data to Macroscopic Device Performance
The pursuit of advanced materials for energy conversion necessitates a deep understanding of electron dynamics at interfaces, a domain where soft X-ray spectroscopy has emerged as a powerful investigative tool. This protocol details the application of soft X-ray spectroscopy, specifically Resonant Auger Electron Spectroscopy with a Core-Hole-Clock (RAES-CHC) approach, to quantitatively link ultrafast electron transport phenomena at interfaces to the macroscopic performance of devices such as organic photovoltaics (OPVs) and nanoparticle-based nanodevices. The methodologies outlined herein are designed to help researchers bridge the critical knowledge gap between nanoscale electronic behavior and overall device efficiency [26] [53].
Experimental Protocols
Protocol 1: Sample Preparation of Condensed Nanoparticle Films and Flat Monolayers for Comparative Electron Transport Studies
Principle: This procedure creates two distinct sample architectures—condensed nanoparticle (NP) films and flat monolayers—enabling a direct comparison of electron transport mechanisms through aromatic molecules on curved NP surfaces versus flat interfaces. This comparison is fundamental for extrapolating findings from model systems to practical device interfaces [26].
Materials:
- Coating Molecules: Aromatic molecules with variable chain lengths (e.g., derivatives with phenyl rings and methyl ester groups).
- Substrate: Gold (Au) nanoparticles (NPs) and a flat gold substrate (e.g., Au(111) wafer).
- Solvents: High-purity solvents appropriate for molecular self-assembly (e.g., ethanol, toluene).
- Equipment: Ultra-high vacuum (UHV) chamber, molecular deposition system, quartz crystal microbalance (QCM).
Procedure:
- Synthesis of Aromatic Molecule-Coated Au NPs:
- Synthesize or procure monodisperse Au NPs.
- Incubate the Au NPs in a solution of the target aromatic molecules for a defined period (e.g., 24 hours) to allow for self-assembled monolayer (SAM) formation on the NP surfaces.
- Purify the coated NPs via repeated centrifugation and redispersion in a clean solvent to remove unbound molecules.
Preparation of Condensed NP Films:
- Deposit the purified, molecule-coated Au NPs onto a suitable substrate (e.g., silicon wafer, TEM grid) using a method such as drop-casting or spin-coating.
- Allow the solvent to evaporate fully, forming a dense, condensed film of NPs.
- Transfer the sample into a UHV chamber for subsequent spectroscopic analysis.
Preparation of Flat Monolayer Films:
- Clean the flat gold substrate thoroughly using standard protocols (e.g., argon sputtering and annealing).
- Expose the clean gold substrate to a vapor or solution of the same aromatic molecules used for NP coating.
- Allow sufficient time for the formation of a well-ordered, flat SAM.
- Transfer the sample into a UHV chamber for analysis.
Key Considerations:
- The orientation and quality of the molecular monolayers on both NP and flat films must be verified using techniques like X-ray Photoelectron Spectroscopy (XPS) and Near-Edge X-ray Absorption Fine Structure (NEXAFS) spectroscopy [26].
- Control over NP size and film morphology is critical for reproducible results.
Protocol 2: Operando Soft X-ray Spectroscopy for Catalytic Interfaces
Principle: The IOS beamline at NSLS-II is specialized for in situ and operando spectroscopy, allowing for the study of electronic structure and chemical states under realistic reaction conditions (e.g., ambient pressure, various gas environments). This bridges the "pressure gap" between ideal surface science and industrial catalytic processes [54].
Materials:
- Catalyst Sample: Fabricated catalyst deposited on a suitable sample holder.
- Reaction Gases: High-purity gases relevant to the catalytic reaction being studied (e.g., CO, O₂, H₂).
- Equipment: NSLS-II IOS beamline or similar endstation equipped with operando cells, mass spectrometer for gas analysis.
Procedure:
- Sample Loading:
- Mount the catalyst sample into the operando reaction cell of the beamline.
- Ensure the sample is securely positioned for X-ray illumination and that the cell is gas-tight.
System Evacuation:
- Pump down the reaction cell to ultra-high vacuum (UHV) base pressure to establish a clean initial state.
Operando Data Collection:
- Introduce the desired reaction gas mixture into the cell at the target pressure (ambient or elevated).
- While maintaining the reaction environment, acquire soft X-ray absorption (XAS) or emission spectra.
- Simultaneously, monitor the catalytic activity (e.g., using a mass spectrometer to analyze reaction products).
- vary external parameters such as temperature or gas composition to track dynamic changes in the electronic structure correlated with performance metrics.
Key Considerations:
- The design of the operando cell must allow for X-ray transmission or electron detection while maintaining a controlled gas atmosphere.
- The photon energy range should be selected to probe the absorption edges of key elements involved in the catalytic process (e.g., C, N, O K-edges) [54] [53].
Protocol 3: Quantifying Ultrafast Electron Transport via RAES-CHC
Principle: The RAES-CHC method uses the lifetime of a core-excited state as an internal clock to measure electron transport times through molecules on the femtosecond scale. This is crucial for understanding charge separation efficiency in devices like OPVs [26].
Materials:
- Sample: Prepared condensed NP film or flat monolayer (from Protocol 1).
- Equipment: Synchrotron beamline capable of delivering tunable soft X-rays with high energy resolution (e.g., SIX beamline at NSLS-II) [54], and a high-resolution electron spectrometer.
Procedure:
- Core-Excited State Preparation:
- Tune the incident X-ray energy to resonate with a core-level excitation of a specific atom in the molecule (e.g., the carbonyl carbon).
- This creates a localized core-hole, initiating the clock.
Auger Electron Detection:
- Measure the energy distribution of the emitted Auger electrons using the electron spectrometer.
- Participator Auger: Results from electrons involved in the transport process.
- Spectator Auger: Results from electrons not involved in transport.
Data Decomposition:
- Subtract inelastic scattering and other secondary background components from the acquired RAES spectra.
- The intensity ratio of participator to spectator Auger peaks is directly related to the electron transfer rate.
Transport Time Calculation:
- Fit the participator intensity ratio using the known core-hole lifetime to calculate the electron transport time from the specific molecular site (e.g., carbonyl group) through the molecular framework (e.g., phenyl rings) to the metal surface.
Key Considerations:
- Site-selectivity is a key advantage; different atoms in the molecule can be probed to map the transport pathway.
- Accurate background subtraction is paramount for obtaining reliable transport times, especially in complex NP films [26].
The Scientist's Toolkit: Essential Research Reagents & Materials
Table 1: Key materials and their functions in soft X-ray spectroscopy studies of electron transport.
| Material / Reagent | Function in the Experiment |
|---|---|
| Gold Nanoparticles (Au NPs) | Provide a high-surface-area, metallic platform for adsorbing molecules and studying electron transport through molecular interfaces on curved surfaces [26]. |
| Aromatic Molecules (e.g., with phenyl rings) | Form self-assembled monolayers (SAMs) through thiol-gold chemistry; their π-conjugated system facilitates electron transport, and their chain length allows tuning of transport dynamics [26]. |
| Flat Gold Substrate (e.g., Au(111)) | Serves as a model, well-defined 2D interface for comparative studies against NP films, enabling the isolation of curvature and collective effects [26]. |
| Non-Fullerene Acceptors (e.g., Y6) | Modern organic semiconductor molecules used in bulk-heterojunction OPVs. Their tunable electronic properties and strong absorption are critical for high-efficiency devices studied with TR-XAS [53]. |
| Soft X-rays (250 - 2000 eV) | Probe element-specific electronic structure by exciting core-level electrons (e.g., K-shells of C, N, O), providing insight into chemical state, charge transfer, and localization [53]. |
Data Presentation & Quantitative Analysis
Electron Transport Times in Molecular Systems
Table 2: Quantifying electron transport dynamics using the RAES-CHC technique.
| Molecular System / Sample Architecture | Electron Transport Time (fs) | Key Spectroscopic Finding | Correlation to Macroscopic Property |
|---|---|---|---|
| Aromatic Molecule on Condensed NP Film | Determined via RAES-CHC (varies with chain length) | Site-selective desorption of methyl ester group observed; electron transport time is chain-length dependent [26]. | Supports the "through-bond" transport model; insights directly applicable to molecular design of NP-based nanodevices [26]. |
| Aromatic Molecule on Flat Monolayer Film | Determined via RAES-CHC (varies with chain length) | Serves as a reference; shows similar chain-length dependence trend as NP films [26]. | Validates that insights from well-defined flat films can be extrapolated to more complex, practical NP interfaces [26]. |
| Organic Photovoltaic Blend (e.g., PM6:Y6) | Tracked via TR-XAS (processes on fs-ps scale) | XAS signatures at Carbon K-edge track charge localization, transfer, and separation from donor to acceptor phases [53]. | Understanding exciton dissociation and charge separation efficiency is directly linked to the device's power conversion efficiency (PCE) [53]. |
Soft X-ray Techniques for Device Analysis
Table 3: Summary of key soft X-ray spectroscopy techniques and their application to functional materials.
| Technique | Acronym | Key Measured Parameter | Application in Energy Devices |
|---|---|---|---|
| X-ray Absorption Spectroscopy | XAS | Absorption coefficient near a core-level edge; probes unoccupied states. | Maps element-specific density of states in OPV materials; identifies chemical states of catalysts under operando conditions [54] [53]. |
| Near-Edge X-ray Absorption Fine Structure | NEXAFS | Fine structure in the XAS near-edge region. | Determines molecular orientation in SAMs on both flat and NP surfaces [26]. |
| Resonant Auger Electron Spectroscopy | RAES | Energy distribution of Auger electrons after core-level resonance. | Used in the CHC approach to measure femtosecond electron transport times through molecules [26]. |
| X-ray Photoelectron Spectroscopy | XPS | Binding energy of core-level electrons. | Measures chemical shifts to track charge transfer dynamics at interfaces in OPVs and other photo-conversion systems [53]. |
Workflow Visualization
Soft X-Ray Spectroscopy Workflow
This diagram illustrates the logical flow connecting the experimental protocols and data analysis to the final research output.
Spectroscopy Probes in OPVs
This diagram maps the specific points in the operational mechanism of an organic photovoltaic (OPV) where soft X-ray spectroscopy techniques provide critical dynamical information.
Benchmarking Against Theoretical Calculations and Computational Models
In the field of soft X-ray spectroscopy (sXAS) for interfacial electron transport studies, benchmarking experimental data against theoretical calculations and computational models is a critical practice for validating both findings and methodologies. This process ensures that the rich electronic state information obtained from spectroscopy translates into reliable, quantitative understanding. Synchrotron-based core-level soft X-ray spectroscopy, which involves the excitation of core electrons and detection of emitted particles, provides unparalleled sensitivity to the electronic structure of materials [29]. For battery materials and interfaces, this technique reveals critical electron states, redox activities, and chemical evolution during operation [29]. However, the complexity of these measurements necessitates rigorous benchmarking frameworks to confirm that spectral features accurately represent underlying electronic structures and transport phenomena.
Theoretical Foundations of Benchmarking
Benchmarking experimental sXAS results against theoretical models serves multiple crucial functions in interfacial electron transport research. Primarily, it validates the accuracy of both experimental data interpretation and computational approaches, creating a feedback loop that improves both domains. The fundamental parameters (FP) approach, based on the Sherman equation improved by Shiraiwa and Fujino, provides a mathematical foundation for quantitative analysis by correlating measured intensities with elemental concentrations via fundamental laws governing X-ray-matter interactions [55].
Soft X-ray absorption spectroscopy (sXAS) directly probes excitations of core-level electrons to unoccupied states, where the lowest-energy sXAS peak corresponds to the lowest unoccupied molecular orbital (LUMO) states of the material [29]. For transition metal (TM)-based systems, L-edge sXAS is particularly sensitive through dipole-allowed 2p–3d transitions, detecting abundant information about TM-3d states including oxidation states, ligand field effects, and spin and orbital properties [29]. The high elemental sensitivity of sXAS, covering low-Z element K-edges and 3d transition metal L-edges within the tender X-ray range (<5 keV), makes it especially valuable for complex material systems where multiple elements contribute to interfacial electron transport phenomena [29].
Table 1: Key Electronic State Information Accessible Through sXAS Benchmarking
| Electronic Property | sXAS Spectral Feature | Theoretical Calculation | Research Significance |
|---|---|---|---|
| LUMO States | Lowest-energy sXAS peak | Density functional theory (DFT) calculations | Predicts electron doping efficiency and charge transfer processes [29] |
| Transition Metal Oxidation State | L₂,L₃-edge ratio and position | Multiplet ligand field theory | Determines redox activity in electrodes [29] |
| Orbital Hybridization | Pre-edge feature intensity & shape | DFT with projected density of states | Reveals charge transfer mechanisms at interfaces [29] |
| Crystallographic Site Symmetry | Spectral fine structure | Ab initio calculations | Identifies local chemical environments affecting transport [29] |
Experimental Protocols for Benchmarking
Spectral Acquisition Parameters
Standardized protocol for collecting sXAS data suitable for theoretical benchmarking:
Beamline Configuration: Utilize synchrotron beamlines with undulator sources providing high photon flux in the tender X-ray range (100-5000 eV). Ensure the beamline covers relevant absorption edges: C K-edge (284 eV), O K-edge (543 eV), F K-edge (687 eV), and transition metal L-edges (450-1000 eV) [29].
Detection Mode Selection: Choose appropriate detection method based on sample properties:
- Total Electron Yield (TEY): Surface-sensitive (~5 nm depth) for interface-specific studies
- Fluorescence Yield (FY): Bulk-sensitive (hundreds of nm) for volume properties
- Partial Inverse Photoemission Yield (PIPO): Enables in-situ/operando measurements through membranes [29]
Energy Calibration: Reference to known absorption features of standard samples (e.g., graphite for C K-edge at 284 eV, CuO for Cu L₃-edge at 931 eV) collected simultaneously via mesh-mounted standards.
Intensity Normalization: Normalize spectra to the incident photon flux (I₀) measured simultaneously from a clean gold mesh or fresh carbon sample.
Background Subtraction: Remove sloping backgrounds by fitting pre-edge regions to a polynomial function and subtracting.
Resolution Specification: Record energy resolution (E/ΔE) typically >5,000 for sXAS studies of fine electronic structures.
Quantitative Analysis Workflow
For quantitative analysis of sXAS data comparable to computational models:
Spectral Decomposition: Fit experimental spectra with linear combinations of reference spectra from well-characterized standard compounds to quantify phase composition or formal oxidation states.
Edge-Step Normalization: Normalize post-edge intensities to unity for comparison with theoretical cross-sections.
Linear Dichroism Correction: For anisotropic materials, collect spectra at multiple incidence angles and account for polarization-dependent transition probabilities.
Self-Absorption Correction: Apply fluorescence correction factors for concentrated samples using the FLY correction algorithm.
Statistical Validation: Repeat measurements across multiple sample regions (minimum 5 locations) and report standard deviations as error estimates.
The fundamental parameters approach provides superior quantitative results compared to built-in empirical calibrations, as demonstrated by the significantly lower Root Mean Squared Error (RMSE) values in X-ray fluorescence studies of copper-based alloys [55]. This highlights the importance of proper calibration methodology selection when benchmarking experimental data.
Diagram 1: sXAS Benchmarking Workflow. The process integrates experimental and computational phases for validating electronic structure models.
Computational Modeling Approaches
Theoretical Frameworks
Multiple computational approaches enable effective benchmarking of sXAS data, each with specific strengths for modeling different aspects of electronic structure:
Density Functional Theory (DFT): Provides ground-state electronic structure information and unoccupied states through band structure calculations. Particularly valuable for predicting LUMO states in binder polymers and understanding electron doping effects in reducing environments [29]. Implementation requires:
- Exchange-correlation functionals suitable for strongly correlated systems (e.g., DFT+U for transition metal compounds)
- Full-potential linearized augmented plane-wave (FP-LAPW) approaches for accurate core-level modeling
- Projected density of states (PDOS) analysis for orbital-specific contributions
Multiplet Ligand-Field Theory: Specifically designed for simulating transition metal L-edge spectra by accounting for:
- Intra-atomic multiplet effects from 2p⁵3dⁿ⁺¹ final states
- Ligand field splittings from the local coordination environment
- Charge transfer parameters between metal 3d and ligand p orbitals
- This approach successfully models the characteristic L₃ and L₂-edge splitting in TM compounds [29]
Bethe-Salpeter Equation (BSE): Provides more accurate core-excitation spectra than single-particle approaches by including electron-hole interactions, essential for:
- Pre-edge features in K-edges of light elements
- Excitonic effects in strongly correlated systems
- Quantitative spectral line shapes beyond DFT
Finite Difference Method Near Edge Structure (FDMNES): Ab initio approach calculating X-ray absorption spectra by solving Schrödinger equation in real space, particularly effective for:
- Low-symmetry sites in complex materials
- Interface-specific electronic structures
- Defect and impurity states
Table 2: Computational Methods for sXAS Benchmarking
| Computational Method | Theoretical Foundation | Best Suited Applications | Software Examples |
|---|---|---|---|
| Density Functional Theory (DFT) | Hohenberg-Kohn theorem, Kohn-Sham equations | Ground-state electronic structure, LUMO prediction, band alignment [29] | VASP, Quantum ESPRESSO, CASTEP |
| Multiplet Ligand-Field Theory | Atomic multiplet theory, crystal field parameters | Transition metal L-edges, oxidation state determination, spin state [29] | CTM4XAS, Quanty |
| Bethe-Salpeter Equation (BSE) | Green's function many-body perturbation theory | Core-exciton effects, quantitative peak intensities | OCEAN, EXCITING |
| Finite Difference Method (FDMNES) | Real-space Schrödinger equation solution | Complex site symmetries, interface structures | FDMNES, FEFF |
Validation Metrics and Procedures
Systematic comparison between experimental and computational spectra requires standardized validation metrics:
Spectral Similarity Score: Calculate R² values and Root Mean Square Error (RMSE) between experimental and theoretical spectra, similar to approaches used in XRF quantification studies [55].
Peak Position Deviation: Measure energy differences for characteristic peaks (should be <0.2 eV for well-benchmarked systems).
Spectral Moment Analysis: Compare integrals over specific energy regions representing particular electronic transitions.
Linear Combination Fitting: Assess whether experimental spectra can be reproduced as linear combinations of theoretical spectra from different structural models.
Cross-Validation: Test computational models trained on one set of materials against experimental data from different but related compounds.
Case Study: Benchmarking Transition Metal Oxide Cathodes
The application of rigorous benchmarking is exemplified in studies of transition metal (TM)-based positive electrodes for battery technologies. The electronic structure of TM compounds directly controls their electrochemical performance, redox behavior, and interfacial stability [29].
Experimental Protocol for TM Oxides
Sample Preparation:
- Synthesize well-characterized reference compounds (e.g., LiCoO₂, LiMn₂O₄, LiFePO₄) with verified phase purity via X-ray diffraction
- Prepare electrochemically cycled samples in inert atmosphere to prevent surface degradation
- For interface studies, fabricate model electrode systems with controlled surface area
sXAS Measurements:
- Collect TM L-edge spectra at high resolution (E/ΔE > 5,000)
- Utilize both TEY and FY detection modes to distinguish surface vs. bulk electronic structure
- Record O K-edge spectra to complement TM L-edge information
- Maintain consistent beam exposure to minimize radiation damage
Data Processing:
- Normalize spectra to incident flux and edge-step
- Remove extrinsic backgrounds using Victoreen or polynomial functions
- Apply self-absorption corrections for FY measurements of concentrated samples
Computational Modeling of TM Systems
Multiplet Calculations:
- Parameterize crystal field (10Dq), charge transfer energy (Δ), and Coulomb interaction (Uₚd) terms
- Include tetragonal or trigonal distortions for realistic coordination environments
- Simulate spectra for different oxidation states (e.g., Co³⁺ vs. Co⁴⁺) and spin states
DFT+U Approach:
- Apply Hubbard U corrections to TM 3d states (Uₑff = 4-6 eV typical for 3d TM oxides)
- Calculate projected density of states for TM 3d and O 2p orbitals
- Simulate XAS spectra through dipole transition matrix elements
Benchmarking Procedure:
- Compare experimental and theoretical L₃/L₂ ratios and peak splittings
- Validate energy positions of main spectral features
- Quantify mixing between d⁴, d⁵L, and d⁶L² configurations (where L denotes a ligand hole)
- Extract quantitative oxidation state information through linear combination fitting
The exceptional sensitivity of sXAS to TM-3d states enables quantitative definition of redox evolution with elemental, orbital, and even site sensitivities [29]. This makes it particularly valuable for understanding complex phenomena in battery electrodes, such as the relative configuration of TM-3d and O-2p states that fundamentally regulates chemical activity at interfaces [29].
Diagram 2: TM Oxide Benchmarking Process. Key spectral features are compared between experimental and theoretical spectra to validate electronic structure models.
Research Reagent Solutions
Table 3: Essential Materials for sXAS Studies of Interfacial Electron Transport
| Research Reagent | Function | Application Example | Technical Specifications |
|---|---|---|---|
| CHARM Reference Materials | Certified standards for quantitative calibration | Calibration of XRF and sXAS measurements of copper-based alloys [55] | Cu-based alloys with certified concentrations of As, Pb, Sn, Sb [55] |
| Transition Metal Oxide Standards | Reference compounds for oxidation state validation | Benchmarking TM L-edge spectra for battery electrodes [29] | High-purity (>99.9%) powders with well-defined oxidation states |
| Soft X-ray Transparent Membranes | Windows for in-situ/operando cells | Studying electrochemical interfaces under working conditions [29] | Silicon nitride (Si₃N₄), graphene, or polyimide films (100-200 nm thickness) |
| Conductive Binder Polymers | Electrode formulation with electronic functionality | Enabling binder systems with special LUMO states for enhanced conductivity [29] | Poly(fluorene) derivatives with carbonyl groups for electron acceptance [29] |
| Ionic Liquid Electrolytes | Electrochemical environment for in-situ studies | Maintaining liquid environment in vacuum-compatible electrochemical cells [29] | Low vapor pressure electrolytes (e.g., Pyr₁₄TFSI) compatible with UHV conditions |
| Synchrotron Calibration References | Energy and intensity calibration | Standardizing beamline performance across measurement sessions | Au mesh for I₀, graphite for C K-edge (284 eV), CuO for Cu L₃-edge (931 eV) |
Benchmarking against theoretical calculations and computational models represents an essential methodology in soft X-ray spectroscopy studies of interfacial electron transport. The protocols outlined in this document provide a systematic framework for acquiring, processing, and validating sXAS data against computational models, with specific applications to battery materials and interfaces. The integration of experimental spectroscopy with computational approaches like DFT and multiplet ligand-field theory enables researchers to move beyond qualitative interpretation toward quantitative electronic structure description. This rigorous benchmarking paradigm ensures that the unique sensitivity of soft X-ray spectroscopy to chemical and physical evolutions at interfaces can be fully leveraged to advance materials innovation for energy storage, electronic devices, and beyond.
Conclusion
Soft X-ray spectroscopy has firmly established itself as an indispensable tool for dissecting the complex electronic processes at material interfaces. By providing element-specific, site-selective, and time-resolved insights, it bridges the critical gap between molecular structure and device function. The methodologies discussed, from the core-hole-clock approach to operando spectroscopy, allow researchers to not only observe but also quantify ultrafast electron transport in diverse systems, from designed molecular layers on nanoparticles to operational battery electrodes. Looking forward, the ongoing development of brighter light sources, faster detectors, and more sophisticated multimodal correlative approaches will further push the boundaries of what is observable. These advancements promise to unlock deeper understanding and enable the rational design of next-generation materials for biomedical applications, advanced energy storage, and efficient catalytic systems, ultimately translating fundamental interfacial knowledge into transformative technologies.
References
- 1. Core Level Spectroscopy [https://www-ssrl.slac.stanford.edu/nilssongroup/corelevel.html]
- 2. Core level spectroscopy [https://www.tcm.phy.cam.ac.uk/castep/documentation/WebHelp/content/modules/castep/thcastepeels.htm]
- 3. Comparative study of electron transport through aromatic ... [https://pubs.rsc.org/en/content/articlehtml/2025/cp/d4cp03556a]
- 4. Practical Guides for X-Ray Photoelectron Spectroscopy ... [https://pmc.ncbi.nlm.nih.gov/articles/PMC6774202/]
- 5. Correlative transmission electron and soft x-ray microscopy ... [https://www.sciencedirect.com/science/article/pii/S1748013225001045]
- 6. Soft x-ray absorption spectroscopy of metalloproteins and ... [https://pmc.ncbi.nlm.nih.gov/articles/PMC5586166/]
- 7. Time-resolved X-ray photoelectron spectroscopy ... [https://www.sciencedirect.com/science/article/abs/pii/S0368204815000596]
- 8. In situ X-ray spectroscopies beyond conventional X ... [https://www.nature.com/articles/s41467-023-42370-8]
- 9. In-Situ/Operando X - ray Characterization of Metal Hydrides [https://pubmed.ncbi.nlm.nih.gov/30737862/]
- 10. Soft x-ray spectroscopy - Synchrotron beamlines [https://www.ansto.gov.au/facilities/australian-synchrotron/synchrotron-beamlines/soft-x-ray-spectroscopy]
- 11. Techniques available (Soft x-ray) - Synchrotron - ANSTO [http://archive.synchrotron.org.au/aussyncbeamlines/soft-x-ray-spectroscopy/techniques-available]
- 12. X-Ray Absorption and Emission Spectroscopy in ... [https://www.mdpi.com/2076-3417/15/19/10784]
- 13. Soft X-Ray Absorption Spectroscopy - an overview [https://www.sciencedirect.com/topics/materials-science/soft-x-ray-absorption-spectroscopy]
- 14. The evolution of CNO elements in galaxies [https://link.springer.com/article/10.1007/s00159-022-00144-z]
- 15. CNO cycle [https://en.wikipedia.org/wiki/CNO_cycle]
- 16. Electron transport chain [https://en.wikipedia.org/wiki/Electron_transport_chain]
- 17. Functional basis of electron transport within photosynthetic ... [https://www.nature.com/articles/s41467-021-25527-1]
- 18. Spectroscopic evidence for a common electron transfer ... [https://pubmed.ncbi.nlm.nih.gov/7876189/]
- 19. Probing charge transfer dynamics in self-assembled ... [https://www.sciencedirect.com/science/article/abs/pii/S0368204815001395]
- 20. The measurement of ultrafast electronic and structural ... [https://pmc.ncbi.nlm.nih.gov/articles/PMC6452056/]
- 21. Ultrafast X-ray Spectroscopy [https://www.nature.com/collections/jacbghgedd]
- 22. In-situ/operando soft x-ray spectroscopy characterization of ... [https://www.sciencedirect.com/science/article/abs/pii/S0927024820300386]
- 23. Best practices for in-situ and operando techniques within ... [https://www.nature.com/articles/s41467-025-57563-6]
- 24. In-situ/operando soft x-ray spectroscopy characterization of ... [https://www.osti.gov/biblio/1775383]
- 25. The electronic structure of the metal–organic interface ... [https://pmc.ncbi.nlm.nih.gov/articles/PMC8922996/]
- 26. Comparative study of electron transport through aromatic ... [https://pubs.rsc.org/en/content/articlelanding/2025/cp/d4cp03556a]
- 27. Gold Nanoparticle Monolayers from Sequential Interfacial ... [https://www.nature.com/articles/srep35339]
- 28. NEXAFS Spectroscopy [https://www-ssrl.slac.stanford.edu/stohr/nexafs.htm]
- 29. Soft x-ray spectroscopy for probing electronic and chemical ... [https://cpb.iphy.ac.cn/article/2016/1806/cpb_25_1_017104.html]
- 30. Soft X-ray spectroscopy of light elements in energy storage ... [https://www.sciencedirect.com/science/article/abs/pii/S2405829721002014]
- 31. Revealing solid electrolyte interphase formation through ... [https://www.nature.com/articles/s41467-022-33691-1]
- 32. An ultrahigh-resolution soft x-ray microscope for quantitative ... [https://pmc.ncbi.nlm.nih.gov/articles/PMC7744074/]
- 33. Radiation damage in soft X-ray microscopy [https://www.sciencedirect.com/science/article/abs/pii/S0368204808000303]
- 34. Soft X-Ray Microscopy Radiation Damage On Fixed Cells ... [https://www.nature.com/articles/srep10250]
- 35. Characterizing sample degradation from synchrotron ... [https://www.frontiersin.org/journals/electronic-materials/articles/10.3389/femat.2025.1572940/full]
- 36. Investigating discontinuous X-ray irradiation as a damage ... [https://pubs.rsc.org/en/content/articlehtml/2025/cp/d5cp00089k]
- 37. New Technique Gives a Deeper Look into the Chemistry of ... [https://als.lbl.gov/new-technique-gives-a-deeper-look-into-the-chemistry-of-interfaces/]
- 38. Using “Tender” X-ray Ambient Pressure ... [https://www.nature.com/articles/srep09788]
- 39. Non-destructive imaging of buried electronic interfaces ... [https://www.nature.com/articles/ncomms12701]
- 40. Understanding X-ray absorption spectra by means of ... [https://www.nature.com/articles/s41524-021-00664-9]
- 41. A new framework for X-ray absorption spectroscopy data ... [https://pmc.ncbi.nlm.nih.gov/articles/PMC12416422/]
- 42. Surface structure of water from soft X-ray second harmonic ... [https://www.nature.com/articles/s41467-025-65514-4]
- 43. Excitation density in time-resolved water window soft X-ray ... [https://www.sciencedirect.com/science/article/abs/pii/S036820482100092X]
- 44. Tracking Electron, Proton, and Solvent Motion in ... [https://arxiv.org/html/2510.03693v1]
- 45. January 2025 issue - IUCr Journals [https://journals.iucr.org/s/issues/2025/01/00/]
- 46. Correlating transmission electron and soft x-ray microscopy ... [https://www.psi.ch/en/micmag/scientific-highlights/correlating-transmission-electron-and-soft-x-ray-microscopy]
- 47. Demonstrating soft X-ray tomography in the lab for ... [https://www.nature.com/articles/s41598-025-29385-5]
- 48. Correlative transmission electron and soft x-ray microscopy for ... [https://www.semanticscholar.org/paper/Correlative-transmission-electron-and-soft-x-ray-in-Kleibert-Vaz/43182d3e36acc8debe15ec4419f0c62ba79f025f]
- 49. Sample Preparation Protocol for Laboratory Cryo-Soft X- ... [https://www.mdpi.com/1422-0067/26/4/1657]
- 50. Protocol for image registration of correlative soft X-ray ... [https://pmc.ncbi.nlm.nih.gov/articles/PMC8121986/]
- 51. Real-time interfacial electron dynamics revealed through ... [https://pmc.ncbi.nlm.nih.gov/articles/PMC8270649/]
- 52. Correlative VIS-fluorescence and soft X-ray cryo-microscopy ... [https://pmc.ncbi.nlm.nih.gov/articles/PMC3343273/]
- 53. Toward ultrafast soft - x of organic photovoltaic... ray spectroscopy [https://pmc.ncbi.nlm.nih.gov/articles/PMC10799687/]
- 54. NSLS-II Soft X-ray Scattering & Spectroscopy Program [https://www.bnl.gov/nsls2/programs/soft-xray-scattering.php]
- 55. Comparison of Different Methods for Evaluating ... [https://www.mdpi.com/2410-3896/9/1/5]