Physisorption vs Chemisorption: A Comprehensive Guide for Biomedical Research and Drug Development
This article provides a definitive guide to adsorption phenomena, specifically tailored for researchers and professionals in drug development and biomedical science.
Physisorption vs Chemisorption: A Comprehensive Guide for Biomedical Research and Drug Development
Abstract
This article provides a definitive guide to adsorption phenomena, specifically tailored for researchers and professionals in drug development and biomedical science. We dissect the fundamental principles distinguishing physical adsorption from chemical adsorption, exploring the underlying forces, energetics, and kinetics. The content extends to practical methodologies for characterization, application-based selection of processes, and troubleshooting for system optimization. With a focus on validation techniques and a forward-looking perspective, this review synthesizes key concepts to inform material selection, catalytic processes, and contaminant removal in pharmaceutical and clinical research, bridging foundational knowledge with cutting-edge applications.
Core Principles: Unraveling the Fundamental Forces of Adsorption
Adsorption is a fundamental surface process with critical applications across environmental technology, catalysis, and pharmaceutical development. This phenomenon involves the accumulation of atoms, ions, or molecules from a gas, liquid, or dissolved solid onto a surface, creating a film of the adsorbate on the adsorbent material [1] [2]. Understanding the distinction between adsorption (surface accumulation) and absorption (bulk penetration) is essential, with sorption serving as the umbrella term encompassing both processes [1] [3].
The adsorption system comprises three fundamental components, as illustrated in Figure 1:
- Adsorbent: The solid material on which accumulation occurs, characterized by high surface area and porosity [2]
- Adsorbate: The substance that becomes adsorbed at the interface [2]
- Medium: The fluid phase (gas or liquid) containing the adsorbate
Figure 1. Components and relationships in an adsorption system, showing key adsorbent materials.
This process arises from unbalanced surface forces that create surface energy, driving the adhesion of substances to interfaces between condensed and fluid phases [1] [4]. The following sections provide a comprehensive technical examination of adsorption fundamentals, classification, and experimental characterization.
Adsorption Fundamentals and Classification
Physisorption versus Chemisorption
Adsorption mechanisms are primarily categorized as physical adsorption (physisorption) or chemical adsorption (chemisorption), distinguished by their fundamental interaction forces, energetics, and reversibility characteristics [5] [4].
Table 1. Comparative analysis of physisorption and chemisorption properties
| Property | Physisorption | Chemisorption |
|---|---|---|
| Interaction Forces | Weak van der Waals forces [5] [2] | Strong chemical bonding [5] [2] |
| Enthalpy Range | Low (20–40 kJ/mol) [5] | High (80–240 kJ/mol) [5] |
| Reversibility | Reversible [5] [2] | Irreversible [5] [2] |
| Temperature Dependence | Favored at low temperatures [5] | Increases with temperature then decreases [5] |
| Specificity | Non-specific [5] | Highly specific [5] |
| Adsorbate State | No change in state [5] | May change state [5] |
| Typical Layers | Multilayer formation possible [1] | Monolayer limited [1] |
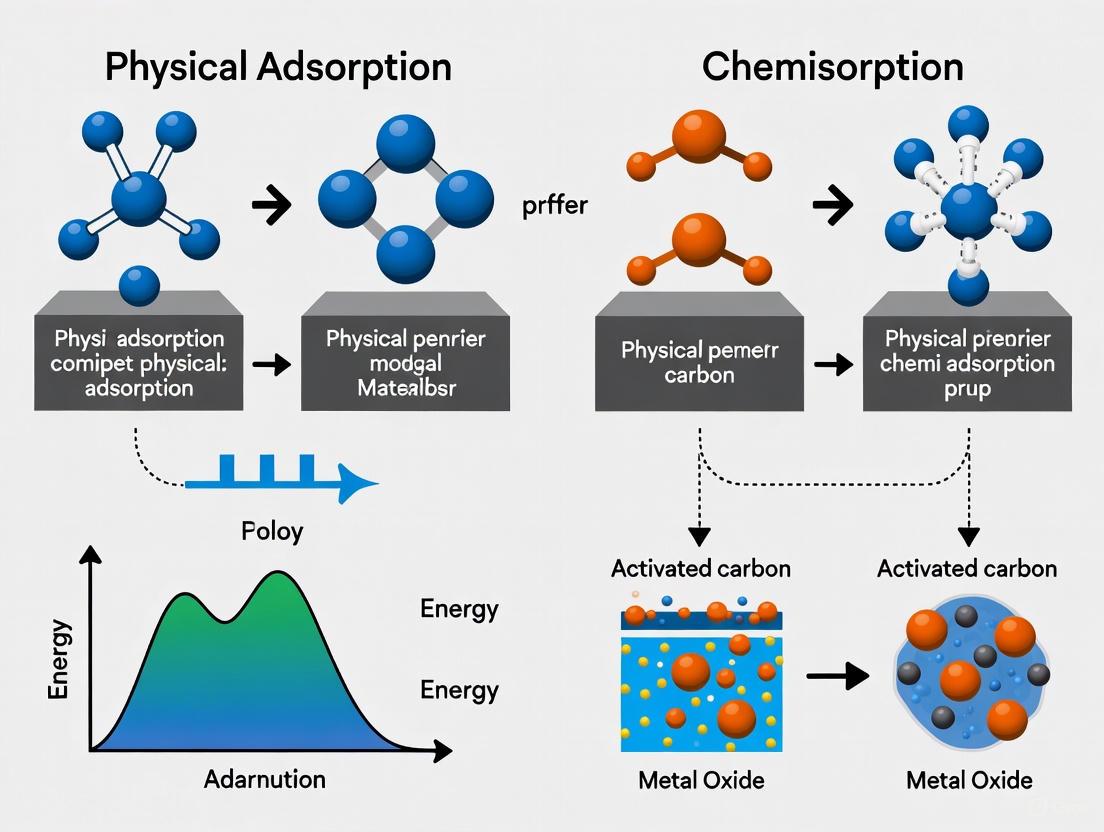
The potential energy curves in Figure 2 illustrate the distinct interaction profiles and energy barriers between physisorption and chemisorption processes, explaining their different temperature dependencies and bonding characteristics.
Figure 2. Potential energy curves distinguishing physisorption and chemisorption mechanisms.
Adsorption Isotherm Models
The quantitative relationship between adsorbed quantity and pressure or concentration at constant temperature is described by adsorption isotherms. Several models have been developed to characterize this relationship, with the Langmuir and Freundlich isotherms being most fundamental [1].
Langmuir Isotherm: Derived by Irving Langmuir in 1918, this model assumes: (1) all adsorption sites are equivalent, (2) each site accommodates one molecule, (3) no interactions between adsorbed molecules, and (4) monolayer coverage [1]. The model is expressed as:
θ = KP / (1 + KP)
Where θ represents surface coverage, K is the equilibrium constant, and P is pressure. The Langmuir model is particularly applicable to chemisorption systems and homogeneous surfaces [1].
Freundlich Isotherm: An empirical relationship describing adsorption on heterogeneous surfaces, expressed as:
x/m = kP^(1/n)
Where x/m is quantity adsorbed per mass unit, P is pressure, and k and n are constants [1]. Unlike the Langmuir model, Freundlich accounts for surface heterogeneity and is applicable to multilayer adsorption.
BET Theory: Developed by Brunauer, Emmett, and Teller, this model extends Langmuir theory to describe multilayer physisorption, particularly important for surface area characterization of porous materials [1].
Experimental Characterization and Methodology
Case Study: CO₂ Adsorption on Activated Carbon
A 2025 investigation of CO₂ adsorption on activated carbon (AC) provides a representative experimental protocol for physisorption analysis [6]. The study employed a probabilistic modeling framework combined with adsorption experiments to quantify multilayer adsorption behavior.
Materials and Reagents:
- Powdered Activated Carbon (PAC) from bituminous coal (Surface area: 879 m²/g, Pore volume: 0.540 cm³/g) [6]
- High-purity CO₂ gas (>95%)
- Characterization gases: N₂ for BET surface area analysis
Experimental Conditions:
- Temperature range: 26°C, 43°C, 51°C, and 62.5°C
- Pressure variation across appropriate ranges for isotherm generation
- Equilibrium establishment at each condition
Instrumentation and Methodology:
- Sample Preparation: AC washed with distilled water to neutral pH and dried at 109°C for 18 hours [6]
- Surface Characterization:
- BET analysis using N₂ adsorption at 77K for surface area determination
- BJH method for mesopore size distribution
- SEM for morphological analysis
- XRD for crystallographic structure
- Adsorption Experiments:
- Gravimetric or volumetric measurement of CO₂ uptake at varying pressures
- Establishment of adsorption isotherms at four temperatures
- Kinetic analysis to determine adsorption rates
- Statistical Modeling:
- Application of grand canonical ensemble for theoretical framework
- Fitting of experimental isotherm data to Langmuir and other models
- Parameter extraction including adhesion energy (ΔEa) and internal energy (Eint)
Key Findings:
- CO₂ adsorption on AC formed 3-4 distinct layers under optimal conditions
- Adsorption identified as exothermic physisorption (ΔEa: 23.08–23.78 kJ/mol) with no chemical bonding
- Elevated temperatures reduced adsorption layers but increased interaction energy
- Multilayer adsorption compensated for AC's high density of active sites, enhancing capture efficiency [6]
Advanced In Situ Monitoring Techniques
Recent methodological advances enable real-time quantitative monitoring of adsorption processes. A 2024 study demonstrated an integrated approach coupling in situ UV-Vis spectroscopy with a two-step algorithm strategy for heterogeneous reaction quantification [7].
Methodological Framework:
- In Situ UV-Vis Spectroscopy: Real-time monitoring of adsorption kinetics in aqueous suspension
- Inverse Adding-Doubling (IAD) Method: Correction for light scattering effects in heterogeneous systems
- Multivariate Curve Resolution-Alternating Least Squares (MCR-ALS): Spectral deconvolution without prior reference spectra requirements
- Computational Spectroscopy Simulations: Connection of MCR-ALS solutions with molecular structural evolution
Application Workflow:
- Continuous monitoring of reflectance and transmittance spectral kinetics during adsorption
- Extraction of pure optical absorption properties after scattering correction
- Identification of spectral profiles of chemical compositions and their abundance
- Quantification of adsorption kinetics through spectral evolution tracking
This methodology successfully quantified bisphenol A adsorption onto polyamide microparticles, demonstrating applicability for pharmaceutical and environmental adsorption studies [7].
The Researcher's Toolkit: Essential Materials and Reagents
Table 2. Essential research reagents and materials for adsorption studies
| Material/Reagent | Function & Application | Key Characteristics |
|---|---|---|
| Activated Carbon [6] | Broad-spectrum adsorbent for gases, organics, and pollutants | High surface area (600-1500 m²/g), microporous structure |
| Zeolites [2] | Selective gas adsorption, ion exchange, and catalysis | Crystalline aluminosilicates, uniform pore structure, acidity |
| Silica Gel [2] [3] | Humidity control, chromatography, and separation | Amorphous SiO₂, high hydrophilicity, tunable porosity |
| Activated Alumina [2] [3] | Drying, purification, and catalyst support | Porous Al₂O₃, thermal stability, surface acidity |
| Molecular Sieves [6] | Size-selective separation and drying | Uniform pore size, high selectivity, regenerability |
| Nanoparticle Adsorbents [2] | Enhanced adsorption capacity and kinetics | High surface area-to-volume ratio, tunable surface chemistry |
The selection of appropriate adsorbent materials depends on specific application requirements, including surface chemistry, pore structure, regeneration capability, and selectivity for target adsorbates.
The accumulation of molecules, atoms, or ions from a fluid onto the surface of a solid material represents a fundamental process known as adsorption [8]. This phenomenon, distinct from absorption where molecules penetrate the bulk material, plays a critical role in numerous scientific and industrial applications, including purification, separation, catalytic transformation, and drug development [8]. Adsorption mechanisms are primarily categorized into physisorption (physical adsorption) and chemisorption (chemical adsorption), with the nature of the intermolecular forces involved serving as the key differentiator between these processes [9] [8].
Physisorption is characterized by weak, reversible interactions, predominantly van der Waals forces, which include dipole-dipole, dipole-induced dipole, and London dispersion forces [10]. These forces arise from transient fluctuations in electron distribution within molecules and do not involve significant electronic rearrangement or chemical bond formation. In contrast, chemisorption involves the formation of strong, irreversible chemical bonds through substantial electron transfer or sharing between the adsorbate and adsorbent [9]. This fundamental distinction in bonding mechanisms leads to dramatic differences in adsorption behavior, including enthalpy changes, temperature dependence, reversibility, and the formation of monolayer versus multilayer structures [9] [8].
Understanding these mechanisms is particularly crucial in pharmaceutical research and development, where surface interactions influence drug stability, formulation, delivery, and efficacy [11] [12]. The following sections provide a comprehensive technical examination of physisorption, with emphasis on its quantitative characterization, experimental protocols, and applications in drug development.
Fundamental Principles of Physisorption
Molecular Interactions and Energetics
Physisorption occurs when gas or liquid molecules adhere to a surface through weak van der Waals forces without forming chemical bonds [13] [9]. This process is characterized by low adsorption enthalpies, typically ranging between 5 and 40 kJ/mol [8]. The weakness of these interactions makes physisorption generally reversible and favored at lower temperatures, as increased thermal energy can readily overcome these forces [9] [8].
Several types of van der Waals forces contribute to physisorption:
- London dispersion forces: Temporary fluctuating dipoles due to uneven electron distribution in adjacent atoms or molecules.
- Dipole-dipole interactions: Electrostatic forces between permanent molecular dipoles.
- Dipole-induced dipole forces: Interactions between a permanent dipole and an induced dipole in a polarizable molecule.
Unlike chemisorption, which typically forms a unimolecular layer due to specific chemical bonding requirements, physisorption can result in multimolecular layers as additional layers can form through the same weak forces that initial layers formed [9]. The non-specific nature of physisorption means it occurs across a wide variety of surfaces without requiring particular chemical compatibility between adsorbate and adsorbent [9].
Table 1: Key Characteristics of Physisorption versus Chemisorption
| Property | Physisorption | Chemisorption |
|---|---|---|
| Forces Involved | Van der Waals forces | Chemical bonds |
| Enthalpy (kJ/mol) | 5-40 | 40-800 |
| Reversibility | Reversible | Irreversible |
| Temperature Dependence | Decreases with increasing temperature | Increases with increasing temperature |
| Specificity | Non-specific | Highly specific |
| Layer Formation | Multimolecular layers | Uni-molecular layers |
| Activation Energy | Low | High |
Factors Influencing Physisorption
Multiple factors govern the extent and strength of physisorption interactions:
- Nature of the Adsorbate: Compounds that are easier to liquefy generally exhibit greater physisorption, with adsorption tendency increasing with the critical temperature of the gas [8].
- Surface Area: Materials with larger surface areas provide more sites for molecular attachment, significantly enhancing adsorption capacity [10] [8].
- Temperature: Unlike chemisorption, physisorption decreases with rising temperature due to the exothermic nature of the process and the weak binding forces involved [9].
- Pressure: Adsorption capacity initially increases rapidly with pressure as available surface sites fill, then gradually slows as surface coverage approaches maximum [8].
In porous materials, pore size distribution significantly impacts physisorption behavior. Micropores (diameter < 2 nm) demonstrate enhanced adsorption potential due to the overlapping potential fields from opposite pore walls, while mesopores (2-50 nm) often exhibit capillary condensation phenomena [8].
Quantitative Analysis of Physisorption
Adsorption Isotherm Models
Adsorption isotherms describe how the amount of adsorbate on the adsorbent varies with pressure or concentration at constant temperature [8]. Several mathematical models have been developed to quantify and interpret physisorption behavior:
Langmuir Isotherm: This model assumes monolayer adsorption onto a homogeneous surface with identical, independent adsorption sites and no lateral interactions between adsorbed molecules [8]. The nonlinear form of the Langmuir equation is represented as: [ \frac{Q}{Q0} = \frac{KL C}{1 + KL C} ] where Q is the amount adsorbed, Q₀ is the maximum monolayer capacity, KL is the Langmuir constant related to adsorption energy, and C is the equilibrium concentration [8].
Freundlich Isotherm: An empirical model used for heterogeneous surfaces, expressing the relationship between adsorption capacity and equilibrium concentration as: [ Q = KF C^{1/n} ] where KF and n are Freundlich constants related to adsorption capacity and intensity, respectively [8].
BET (Brunauer-Emmett-Teller) Theory: Extending the Langmuir model to multilayer adsorption, the BET theory is particularly valuable for determining the specific surface area of porous materials [8]. The BET equation is expressed as: [ \frac{P}{V(P0 - P)} = \frac{1}{Vm C} + \frac{C - 1}{Vm C} \left(\frac{P}{P0}\right) ] where P is the equilibrium pressure, P₀ is the saturation pressure, V is the adsorbed gas quantity, V_m is the monolayer capacity, and C is the BET constant [8].
Table 2: Quantitative Parameters in Physisorption Analysis
| Parameter | Description | Typical Range for Physisorption | Measurement Techniques |
|---|---|---|---|
| Surface Area | Total specific surface area of adsorbent | 10-1500 m²/g for activated carbons | BET analysis from N₂ adsorption isotherms |
| Pore Volume | Total volume of pores | 0.2-1.5 cm³/g | Single point adsorption at P/P₀ ≈ 0.95 |
| Pore Size Distribution | Distribution of pore diameters | Micropores (<2 nm), Mesopores (2-50 nm) | DFT, BJH method |
| Isosteric Heat of Adsorption | Energy released during adsorption | 5-40 kJ/mol | Calorimetry, temperature-dependent isotherms |
| Mean Pore Width | Average pore diameter | 0.5-10 nm | DFT methods |
Advanced Computational Methods
Modern computational approaches provide atomic-level insights into physisorption mechanisms. Density Functional Theory (DFT) with advanced van der Waals functionals (such as SCAN-rvv10, optPBE-vdW, optB88-vdW) enables accurate prediction of binding affinities and adsorption configurations [14]. These methods are particularly valuable for studying the adsorption of small organic molecules (CH₄, CO₂, H₂O) on novel materials like MXenes, where weak dispersion interactions dominate [14].
For pharmaceutical applications, Quantitative Structure-Property Relationship (QSPR) modeling utilizes topological indices as molecular descriptors to correlate molecular structure with physicochemical properties relevant to adsorption behavior, including boiling points, enthalpy of vaporization, and molar refraction [15]. These computational approaches facilitate early-stage screening and optimization of drug candidates without extensive laboratory experimentation [15].
Experimental Characterization of Physisorption
Gas Sorption Analysis
Gas sorption analysis represents the primary method for characterizing physisorption in porous materials. The following protocol details the standard approach for determining surface area and pore characteristics:
Equipment and Reagents:
- Physisorption analyzer (e.g., Micromeritics, Quantachrome, Belsorp instruments) [13]
- High-purity analysis gases (N₂ at 77 K or Ar at 87 K)
- Degassing system for sample preparation
- Cryogenic bath (liquid N₂ or Ar)
- Reference and sample tubes
Sample Preparation Protocol:
- Weigh 50-200 mg of sample into a clean, dry analysis tube
- Secure the tube to the degas port and begin evacuation
- Heat the sample to an appropriate temperature (typically 100-300°C) under vacuum for 2-12 hours to remove contaminants
- Monitor pressure rise to verify complete degassing
- Transfer the degassed sample to the analysis station
Analysis Procedure:
- Immerse the sample tube in a cryogenic bath (typically liquid N₂ at 77 K)
- Introduce known quantities of adsorbate gas (N₂) into the sample chamber
- Allow the system to reach equilibrium at each pressure point
- Measure the quantity of gas adsorbed at each relative pressure (P/P₀)
- Continue measurements across the relative pressure range from 10⁻⁵ to 0.995
- Perform desorption measurements to assess hysteresis
Data Analysis:
- Apply the BET equation to the relative pressure range 0.05-0.30 P/P₀ to calculate specific surface area
- Use the t-plot or αs-plot method to determine micropore volume and external surface area
- Apply appropriate methods (DFT, BJH) to calculate pore size distribution from the adsorption isotherm
Diagram 1: Gas Sorption Analysis Workflow
Distinguishing Physisorption from Chemisorption in Experimental Systems
Experimental differentiation between physisorption and chemisorption is crucial for accurate material characterization. Research on carbon nanotube (CNT) gas sensors demonstrates a methodology for identifying both processes through analysis of response curves [16].
Voltage Response Measurement Protocol:
- Prepare multi-walled CNTs grown on SiO₂ substrate with silver-flake electrical junctions
- Place samples in high vacuum conditions (10⁻⁶ mbar) with constant temperature control
- Apply a constant current (5 mA) to the CNT system using a sourcemeter (e.g., Keithley 2400)
- Measure voltage across CNTs as a function of time with 500 ms sampling
- Collect background data for 5 minutes to establish voltage offset
- Introduce target gases (H₂, CO₂) at various concentrations via leak valve
- Monitor voltage response during gas exposure (adsorption) and pump-out (desorption) phases
Data Analysis for Mechanism Identification:
- Calculate responsiveness as (V(t) - V₀)/V₀, where V₀ is equilibrium voltage
- Fit both adsorption and desorption curves with double exponential function:
- Ascending branch: Responsiveness = A(1 - e^(-(t-t₀)/τ)) + B
- Descending branch: Responsiveness = Ae^(-(t-t₀)/τ) + B
- Extract characteristic time constants (τ) from fitting
- Identify faster processes as physisorption (shorter τ) and slower processes as chemisorption (longer τ) based on timescale separation [16]
This approach capitalizes on the fundamental kinetic difference between physisorption (generally faster physi(de)sorption) and chemisorption (slower chemi(de)sorption) [16].
The Researcher's Toolkit: Essential Materials and Methods
Table 3: Research Reagent Solutions for Physisorption Studies
| Reagent/Material | Function | Application Examples |
|---|---|---|
| BET Analyzer | Measures specific surface area, pore volume, and pore size distribution through gas adsorption | Characterization of pharmaceutical carriers, activated carbons, metal-organic frameworks [13] |
| Activated Carbons | High-surface-area adsorbents with tunable porosity | Environmental remediation, pharmaceutical impurity removal, gas separation [13] [8] |
| Silica and Aluminum Gels | Desiccants with controlled pore structures | Humidity control, moisture removal in pharmaceutical packaging [9] |
| Van der Waals Density Functionals (SCAN-rvv10) | Computational methods for modeling weak dispersion interactions | Predicting binding affinities of small organic molecules on novel materials [14] |
| Quantitative Structure-Property Relationship (QSPR) Models | Mathematical correlation of molecular structure with adsorption properties | Early-stage drug screening, prediction of physicochemical properties [15] |
| MXenes (V₂C) | Novel 2D materials with tunable surface chemistry | Gas separation, carbon capture, sensing applications [14] |
Pharmaceutical Applications of Physisorption
Drug Development and Formulation
In pharmaceutical sciences, physisorption principles find application across multiple stages of drug development:
Drug Polymorphism and Cocrystal Engineering: Physisorption analysis helps characterize different crystalline forms of active pharmaceutical ingredients (APIs), which directly impact stability, solubility, and bioavailability [12]. Techniques including dynamic vapor sorption (DVS) quantify water uptake in various polymorphic forms, informing selection of optimal solid forms for development [12].
Model-Informed Drug Development (MIDD): Physisorption parameters contribute to quantitative structure-activity relationship (QSAR) models that predict drug behavior, enabling more efficient lead optimization and reducing late-stage failures [11]. These approaches integrate physicochemical properties, including those governed by surface interactions, into predictive frameworks for absorption, distribution, metabolism, and excretion (ADME) [11].
Enhancing Bioavailability: For Biopharmaceutics Classification System (BCS) Class II and IV drugs with low solubility, adsorption onto high-surface-area carriers can improve dissolution rates and oral bioavailability [12]. Physisorption onto mesoporous silica or other inert carriers presents a strategy for enhancing the performance of poorly soluble APIs without chemical modification.
Material Characterization in Pharma
Surface Area and Porosity Analysis: BET surface area measurements represent a critical quality attribute for many pharmaceutical excipients and active ingredients, influencing dissolution, stability, and processing behavior [12]. Regulatory guidelines often require thorough characterization of porous drug carriers to ensure consistent performance.
Dynamic Vapor Sorption (DVS): This technique measures water uptake by materials under controlled humidity conditions, providing insights into hygroscopicity, hydrate formation, and physical stability [12]. Such information is crucial for predicting shelf life, selecting appropriate packaging, and designing stable formulations.
Emerging Trends and Future Perspectives
The field of physisorption continues to evolve with several emerging trends:
Integration with Artificial Intelligence: Machine learning algorithms are increasingly applied to predict adsorption properties and optimize adsorbent materials, reducing experimental screening time [11] [13]. AI-driven analysis of large-scale biological, chemical, and clinical datasets enhances prediction accuracy for drug adsorption and release profiles [11].
Advanced Materials Design: Novel 2D materials like MXenes and metal-organic frameworks (MOFs) with tailored surface properties offer unprecedented control over physisorption behavior [14] [8]. These materials demonstrate potential for selective gas separation, targeted drug delivery, and energy storage applications.
Miniaturization and Automation: Trends toward miniaturized physisorption instruments enable in-field analysis and real-time monitoring of adsorption processes [13]. Automated systems with integrated data analysis streamline material characterization in quality control environments.
Despite these advances, challenges remain in standardizing physisorption measurements across materials and instruments, scaling adsorption technologies for industrial applications, and fully understanding complex adsorption mechanisms in heterogeneous systems. Future research will likely focus on developing more sophisticated computational models, designing multifunctional adsorbents with precisely controlled properties, and integrating physisorption principles into broader pharmaceutical development frameworks.
Chemisorption, or chemical adsorption, is a fundamental surface phenomenon where a chemical reaction occurs between an adsorbate (gas or vapor) and the solid surface of a material. This process results in the formation of strong chemical bonds via electron sharing and valence bonding, creating a distinct chemical species at the surface [17]. Unlike physical adsorption, chemisorption is characterized by the splitting of adsorbing gas or vapor molecules into atoms, radicals, or ions that chemically bond to specific adsorption sites on the surface [17]. This interaction is typically characterized by high binding energy and is often irreversible under standard conditions [18] [17].
The process plays a vital role in numerous industrial applications and scientific fields, particularly in heterogeneous catalysis, where it enables the formation of chemisorbed intermediates that react with each other to form products [19]. Understanding chemisorption is essential for researchers and scientists working in catalyst characterization, petroleum refining, biofuel production, plastic manufacturing, and environmental technology [20]. The specificity and strength of chemisorption make it a critical phenomenon for drug development professionals who utilize surface interactions in various analytical and synthetic processes.
Fundamental Mechanisms of Chemisorption
The Chemisorption Process
The mechanism of chemisorption follows a distinct sequence of events that begins when an adsorbate particle approaches a solid surface. The first stage involves the particle becoming trapped on the surface by losing sufficient momentum through an inelastic collision, forming a precursor state bonded to the surface by weak forces similar to physisorption [19]. In this precursor state, the particle diffuses across the surface until it encounters a deep chemisorption potential well. The particle then reacts with the surface, forming new types of electronic bonds, or simply desorbs after gaining sufficient energy [19].
The reaction between the surface and adsorbate depends on the chemical species involved and follows fundamental thermodynamic principles. Applying the Gibbs energy equation for reactions (ΔG = ΔH - TΔS), the spontaneity of chemisorption requires a negative change in free energy (ΔG) at constant temperature and pressure [19]. Since a free particle becomes restrained to a surface (decreasing entropy, ΔS < 0), the enthalpy term (ΔH) must be sufficiently negative (exothermic) to drive the process [19]. This results in the characteristically high binding energy associated with chemisorption processes.
Bond Formation in Chemisorption
The formation of chemical bonds during chemisorption occurs when a molecule moves sufficiently close to surface atoms that their electron clouds overlap [20]. This overlap allows the adsorbate and adsorbent to share electrons, leading to the formation of chemical bonds that are typically ionic or covalent in nature [19]. The strong interaction between the adsorbate and substrate surface creates these new electronic bonds, fundamentally distinguishing chemisorption from physisorption [19].
Two primary mechanisms describe the bonding process in catalytic systems. In molecular adsorption, the adsorbate remains intact during the bonding process, such as occurs with alkene binding using platinum catalysts [20]. In dissociative adsorption, chemical bonds within the adsorbate molecule break concomitantly with bond formation to the surface. A classic example is the binding of H₂ to metal catalysts, where the hydrogen molecule dissociates into atoms that individually bond to the surface [20]. The barrier to dissociation significantly impacts the adsorption rate, with the energy to overcome the activation potential typically coming from translational and vibrational energy [19].
Comparative Analysis: Chemisorption vs. Physisorption
Understanding the distinctions between chemisorption and physisorption is essential for researchers studying surface phenomena. The table below provides a comprehensive comparison of these two adsorption processes based on key characteristics.
| Characteristic | Physisorption | Chemisorption |
|---|---|---|
| Bond Type | Weak van der Waals forces [21] [20] | Strong chemical bonds (ionic/covalent) [19] [21] |
| Reversibility | Reversible [21] | Often irreversible [21] [17] |
| Specificity | Not specific [21] | Highly specific [21] |
| Enthalpy of Adsorption | Low (20-40 kJ/mol) [21] [20] | High (80-240 kJ/mol) [21] [20] |
| Temperature Dependence | Favors low temperature, decreases with increasing temperature [21] | Favors high temperature, increases with increasing temperature [21] |
| Layer Formation | Multimolecular layers [21] | Monolayer only [21] |
| Activation Energy | Low [21] | Significant [21] |
Energetics and the Potential Energy Diagram
The potential energy diagram provides a conceptual framework for understanding the energetics of adsorption processes. This diagram represents the variation in the energy of a system as a function of the distance (d) of an adsorbate from a surface [4]. In the case of pure physisorption, weak van der Waals forces create a shallow minimum in the potential energy curve at a relatively large distance from the surface (typically d > 0.3 nm) [4]. This physisorption well is characterized by the absence of an activation barrier, making the kinetics of physisorption invariably fast.
For systems capable of chemisorption, the potential energy curve features a much deeper chemisorption minimum at shorter distances, representing the strong chemical bond formation [4]. The overall potential energy curve for such systems combines both physisorption and chemisorption characteristics, with a curve crossing point where chemisorption forces begin to dominate over physisorption forces [4]. The depth of the chemisorption well corresponds directly to the energy of adsorption, while the location of the global minimum on the distance axis represents the equilibrium bond distance (d_ch) for the adsorbed molecule on the surface [4].
Figure 1: Potential Energy Diagram Showing Physisorption and Chemisorption Pathways
Experimental Methodologies for Chemisorption Analysis
Static Volumetric Chemisorption
The static volumetric technique is performed using instruments like the Micromeritics 3Flex and ASAP 2020 Plus, which operate over a range of pressures [17]. In this method, two adsorption isotherms (quantities of gas adsorbed as functions of pressure at constant temperature) are collected at sub-atmospheric pressures [17]. The first isotherm represents total adsorption (both physisorption and chemisorption), while the second represents reversible adsorption (primarily physisorption) [17]. The difference between these two isotherms provides a measure of the irreversible adsorption, which is operationally defined as chemisorption [17]. This technique yields quantitative information on the number of adsorption sites available on the catalyst surface, enabling subsequent calculations of active surface area. When the active surface area analysis is performed at one specific temperature, it is termed isothermal chemisorption [17].
Protocol for Static Volumetric Chemisorption:
- Sample Preparation: The catalyst sample is placed in the analysis tube and subjected to pre-treatment (often degassing) to remove contaminants and moisture.
- Conditioning: The sample may undergo reduction or oxidation cycles to activate the surface.
- First Isotherm Measurement: The sample is exposed to the probe gas (e.g., H₂, CO) at increasing pressures while maintaining constant temperature.
- Evacuation: The system is evacuated to remove reversibly adsorbed species.
- Second Isotherm Measurement: The process is repeated to measure reversible adsorption.
- Calculation: The difference between the first and second isotherms gives the chemisorbed quantity.
Dynamic Chemisorption Techniques
Dynamic chemisorption utilizes flowing gas systems to characterize catalytic surfaces through various temperature-programmed methods. Instruments such as the ChemiSorb and AutoChem series implement these techniques using pulse chemisorption in a dynamic flow system to titrate the active surface [17]. In these experiments, the identity, quantity, and strength of active sites can be quantified by adsorption, desorption, or reaction under isothermal or temperature-programmed conditions [17]. The dynamic approach employs several specialized techniques:
- Temperature Programmed Reduction (TPR): Measures the reduction profile of catalytic materials as temperature increases in a reducing atmosphere [17].
- Temperature Programmed Desorption (TPD): Analyzes desorbed species as temperature increases, providing information on adsorption strength and active site distribution [22] [17].
- Temperature Programmed Oxidation (TPO): Characterizes the oxidation behavior of catalysts in an oxidizing environment [22] [17].
- Pulse Chemisorption: Involves injecting precise volumes of probe gas into a carrier stream flowing over the catalyst to titrate active sites [17].
Figure 2: Experimental Workflow for Chemisorption Analysis
Research Reagent Solutions for Chemisorption Studies
The table below outlines key reagents and materials commonly used in chemisorption experiments, along with their specific functions in catalyst characterization.
| Reagent/Material | Function in Chemisorption Studies | Application Examples |
|---|---|---|
| Hydrogen (H₂) | Probe molecule for metal surface sites; participates in dissociative chemisorption [20] | Determination of metal dispersion in supported metal catalysts [17] |
| Carbon Monoxide (CO) | Probe for both metallic and cationic sites; forms various surface complexes [20] | Titration of surface active sites; IR spectroscopy studies [17] |
| Ammonia (NH₃) | Acidic probe molecule for characterization of solid acid catalysts [20] | Measurement of acid site density and strength distribution [17] |
| Oxygen (O₂) | Oxidizing agent for temperature-programmed oxidation studies [17] | Determination of oxidation characteristics and carbonaceous deposits [22] |
| Nitrogen (N₂) | Relatively inert carrier gas; can chemisorb dissociatively on certain surfaces [19] | Carrier gas in pulse chemisorption; study of ammonia synthesis catalysts [18] |
Applications in Research and Industry
Heterogeneous Catalysis
Chemisorption serves a fundamental role in heterogeneous catalysis, where it facilitates the formation of chemisorbed intermediates that react with each other on catalyst surfaces [19]. After these chemisorbed species combine through bond formation, the resulting products desorb from the surface, regenerating the active sites for subsequent catalytic cycles [19]. This mechanism is crucial for numerous industrial processes, including petroleum refining, biofuel production, and plastic manufacturing [20]. The strong interaction between adsorbates and catalyst surfaces enables the breaking and formation of chemical bonds under controlled conditions, significantly accelerating reaction rates and improving selectivity.
In catalyst characterization, chemisorption measurements provide vital insights into key properties such as the reduction temperature at which metals become catalytically active, the quantity of surface metal or active species available for reaction, the strength of specific active sites, and the material's performance after undergoing reduction or oxidation cycles [17]. For example, the dissociative chemisorption of hydrogen on copper surfaces has been extensively studied, revealing a large activation energy of 0.35–0.85 eV, with vibrational excitation of the hydrogen molecule promoting dissociation on low index copper surfaces [19].
Environmental and Materials Applications
Beyond traditional catalysis, chemisorption principles find applications in environmental remediation and advanced materials development. In environmental technology, chemisorption is employed for the removal of heavy metals and organic pollutants from aquatic media [23]. For instance, chemisorption mechanisms involving metal-organic complexes or cation exchange reactions effectively remove lead ions (Pb²⁺) from wastewater [23]. The process has also been applied to capture gaseous pollutants such as mercury, nitrogen dioxide, and carbon dioxide through functionalized carbon-based materials [22].
In materials science, chemisorption enables the creation of self-assembled monolayers (SAMs) by chemisorbing reactive reagents with metal surfaces [19]. A prominent example involves thiols (RS-H) adsorbing onto gold surfaces, forming strong Au-SR bonds while releasing H₂ [19]. These densely packed thiol groups protect the surface and provide platforms for sensor development, molecular electronics, and nanotechnology applications. Additionally, chemisorption techniques are utilized to modify carbon black surfaces through oxidation, halogenation, and polymer grafting, enhancing their dispersion, electrochemical properties, and compatibility in composite materials [22].
Advanced Concepts and Recent Developments
Dissociative Chemisorption
Dissociative chemisorption represents a specialized category where diatomic gas molecules, such as hydrogen, oxygen, and nitrogen, separate into atoms upon adsorption onto a surface [19]. The precursor-mediation model describes this process: the gas molecule first adsorbs onto the surface into a precursor state, then diffuses across the surface to chemisorption sites where the molecular bond breaks in favor of new bonds with the surface [19]. The energy required to overcome the activation potential for dissociation typically derives from translational and vibrational energy [19].
The hydrogen-copper system exemplifies dissociative chemisorption and has been extensively studied. This system exhibits a substantial activation energy ranging from 0.35 to 0.85 eV, with vibrational excitation of the hydrogen molecule significantly promoting dissociation on low-index copper surfaces [19]. Such fundamental studies provide insights into surface reactivity and bond formation that inform catalyst design for industrial processes including ammonia synthesis, hydrogenation reactions, and fuel cell technologies.
Theoretical Modeling Challenges
Theoretical modeling of chemisorption presents significant challenges due to the complexity of real-world systems. A multidimensional potential energy surface derived from effective medium theory typically describes the effect of the surface on absorption, though only certain portions are utilized depending on the specific research focus [19]. The basic equation representing the total energy as a function of location is:
[E({Ri}) = E{el}({Ri}) + V{\text{ion-ion}}({R_i})]
where (E{el}) represents the electronic energy contribution and (V{\text{ion-ion}}) accounts for ion-ion interactions [19].
Several factors complicate theoretical calculations of chemisorption processes. Solid surfaces are not necessarily at equilibrium and may contain irregularities, defects, and odd adsorption sites that create a distribution of adsorption energies [19]. Additionally, bonds formed between adsorbates can further alter the surface chemistry [19]. Unlike physisorption where adsorbates simply reside on the surface, chemisorbed species can induce substantial surface restructuring through relaxation (changing interplanar distances) or reconstruction (altering surface structure) [19]. For example, oxygen forms strong bonds (~4 eV) with metals like Cu(110), accompanied by surface bond breaking and large restructuring through "missing row" formations [19].
Two primary models describe surface reactions: the Langmuir-Hinshelwood mechanism, where both reacting species are adsorbed before reaction, and the Eley-Rideal mechanism, where one adsorbed species reacts directly with a gas-phase molecule [19]. Understanding these mechanisms provides crucial insights for designing more efficient and selective catalytic processes across pharmaceutical, environmental, and industrial applications.
Surface chemistry plays a critical role in numerous scientific and industrial processes, from catalytic converters in automobiles to drug development and environmental remediation [24]. At the heart of this field lies adsorption, the process whereby molecules adhere to a surface. For researchers and scientists engaged in drug development and material science, a precise understanding of the two primary adsorption mechanisms—physisorption (physical adsorption) and chemisorption (chemical adsorption)—is fundamental [25]. These processes govern interactions at the solid-gas and solid-liquid interfaces, influencing everything from catalyst design to pollutant removal and pharmaceutical compound behavior. This technical guide provides an in-depth, side-by-side examination of their key characteristics, enabling professionals to select and optimize processes based on the underlying interaction mechanisms.
Fundamental Mechanisms and Theoretical Framework
Physisorption: Weak Surface Interactions Governed by Van der Waals Forces
Physisorption is a process in which the electronic structure of the adsorbate atom or molecule is barely perturbed upon adsorption [26]. The fundamental interacting force is van der Waals attraction, which originates from interactions between induced, permanent, or transient electric dipoles [26]. This force is relatively weak, leading to adsorption energies typically on the same order of magnitude as the heat of liquefaction [24].
The process can be modeled using a quantum-mechanical oscillator approach. When an atom approaches a surface, the motion of its electrons is modified by image charges, effectively lowering the system's vibrational frequencies. The van der Waals binding energy (Vv) can be expressed as Vv = -Cv/(Z-Z0)³, where Cv is a constant related to the atomic polarizability, Z is the distance from the surface, and Z0 is the position of the dynamical image plane, accounting for the spilling of electron wavefunction out of the surface [26]. This model accurately describes the weak, long-range Z⁻³ dependence of the physisorption potential.
Chemisorption: Strong Bond Formation via Orbital Overlap
Chemisorption involves the formation of a chemical bond—either covalent or ionic—between the adsorbate molecule and the surface atoms [25]. This process involves sharing or transferring electrons, resulting in a significant perturbation of the electronic structures of both the adsorbate and the adsorbent [25]. The union is much stronger than a physical bond, with heats of adsorption comparable to those of chemical reactions [27]. This often leads to the formation of a new surface compound, such as iron nitride when nitrogen is chemisorbed on iron at high temperatures [27]. Due to this bond strength, chemisorption is typically difficult to reverse [27].
Table 1: Fundamental Characteristics of Physisorption and Chemisorption
| Characteristic | Physisorption | Chemisorption |
|---|---|---|
| Binding Force | Van der Waals forces [26] | Covalent or Ionic bonds [25] |
| Energy Range | Low (∼10–100 meV; ~20–40 kJ/mol) [26] [5] | High (80–800 kJ/mol) [25] [27] [5] |
| Electronic Perturbation | Barely perturbed [26] | Significant change; electron sharing/transfer [25] |
| Theoretical Model | Image charge, Quantum oscillator [26] | Chemical bonding models (e.g., molecular orbital theory) |
| Nature of Process | Non-specific and reversible [5] | Highly specific and often irreversible [5] |
Potential Energy Curves and Energetics
The interaction of a molecule with a surface is effectively visualized through a one-dimensional potential energy (PE) curve, which plots the system's energy as a function of the molecule's distance from the surface [28].
In the PE diagram above, the red curve depicts the potential energy pathway for chemisorption. It is characterized by a deep minimum at a short distance from the surface, representing the strong bond formation. A significant feature is the possible presence of an activation energy barrier (Eaᵃᵈˢ), which must be overcome for the chemisorption bond to form. The depth of this well corresponds to the energy of adsorption (ΔH꜀ₕₑₘ), which is strongly exothermic [28]. The blue dashed curve shows the physisorption potential, featuring a shallow minimum at a larger distance, governed by long-range van der Waals forces. Its depth (ΔHₚₕᵧₛ) is much smaller [28]. In many real systems, the overall potential is a combination of these two curves. The physisorption well often acts as a precursor state, facilitating the eventual chemisorption process by trapping molecules near the surface before they overcome the activation barrier [28].
Comparative Analysis of Key Properties
A detailed comparison of the properties of physisorption and chemisorption is essential for predicting and controlling surface behavior in applied research.
Table 2: Comparative Properties of Physisorption and Chemisorption
| Property | Physisorption | Chemisorption |
|---|---|---|
| Enthalpy (ΔH) | Low (∼20–40 kJ/mol) [5] | High (80–240 kJ/mol, up to 800 kJ/mol) [25] [27] [5] |
| Reversibility | Reversible; equilibrium is quickly established [5] | Irreversible; often forms a stable surface compound [5] |
| Temperature Dependence | Favored at low temperature; decreases with increasing T [5] | Often requires high temperature; rate increases with T (initially) [5] |
| Specificity | Non-specific; occurs on all surfaces [5] | Highly specific; requires chem. affinity [5] |
| State of Adsorbate | No change in the state of the adsorbate [5] | Adsorbate may change its state due to reaction [5] |
| Adsorbate Layer | Multi-layer formation is possible [27] | Typically limited to a monolayer [25] [27] |
| Kinetics | Fast and non-activated [28] | Can be activated; may have an energy barrier [28] |
The temperature dependence of adsorption is a critical distinguishing factor. Physisorption occurs readily at low temperatures and diminishes as temperature increases due to the exothermic nature of the process [5]. In contrast, chemisorption, often being an activated process, may initially increase with temperature as molecules gain sufficient energy to overcome the activation barrier. After reaching an optimum temperature, the extent of chemisorption may decrease due to desorption or decomposition at very high temperatures [5]. Notably, a gas adsorbed via physisorption at low temperatures may transition to chemisorption as the temperature is raised [5].
Experimental Characterization Methodologies
Characterizing adsorbents and catalysts requires precise methodologies to quantify surface area, active sites, and adsorption strength.
Volumetric (Static) Chemisorption Analysis
The volumetric technique is a standard method for obtaining high-resolution chemisorption isotherms. It operates by precisely dosing a known quantity of adsorbate gas into a calibrated volume containing the evacuated adsorbent sample [27]. The pressure change is monitored until equilibrium is reached, allowing for the calculation of the quantity adsorbed using gas laws. This process is repeated at various pressures to construct an adsorption isotherm. The technique is highly accurate and can be performed at various temperatures, but requires high vacuum and is best suited for powdered or granular samples [27].
Dynamic (Flowing Gas) Pulse Chemisorption
The dynamic pulse chemisorption technique operates at ambient pressure. After sample pre-treatment, small, precise pulses of the adsorbate gas are injected into a carrier gas stream flowing over the sample [27]. A downstream thermal conductivity detector (TCD) measures the quantity of gas not adsorbed by the sample. The adsorbed quantity per pulse is calculated by subtracting the detected amount from the injected amount. The process continues until the sample is saturated, as indicated by the TCD signal returning to baseline. This method is faster and simpler than the volumetric method and is well-suited for determining total active site capacity, though it provides less detailed isotherm data [27].
Temperature-Programmed Desorption (TPD)
Temperature-Programmed Desorption (TPD) is a powerful technique for probing the strength and distribution of adsorption sites. After the adsorbate is adsorbed onto the surface at a specific temperature, the temperature is increased linearly under a flow of inert gas [27]. As the temperature rises, adsorbed molecules gain energy to desorb, causing peaks in the detector signal (e.g., a TCD). The temperature at which desorption occurs indicates the binding strength—higher temperatures correspond to stronger bonds—while the area under the peak quantifies the number of sites. TPD is invaluable for studying catalyst deactivation, surface reaction intermediates, and the energy distribution of active sites [27].
The Scientist's Toolkit: Research Reagent Solutions
Selecting the appropriate materials and probe molecules is critical for designing meaningful adsorption experiments.
Table 3: Essential Research Reagents and Materials for Adsorption Studies
| Reagent/Material | Function & Characteristics | Common Applications |
|---|---|---|
| Nitrogen (N₂) at 77 K | Non-reactive probe gas for physisorption; used to determine total surface area and pore size distribution based on BET theory. | Standard characterization of porous materials (e.g., catalyst supports, zeolites) [27]. |
| Carbon Dioxide (CO₂) at 273 K | Probe molecule for analyzing ultramicropores; its higher temperature use minimizes diffusion limitations. | Characterization of microporous carbons and zeolites [27]. |
| Hydrogen (H₂) | Reactive probe for chemisorption on metal sites; can dissociate to form hydrides. | Measurement of metal dispersion and active surface area in transition metal catalysts (e.g., Pt, Pd, Ni) [27] [5]. |
| Carbon Monoxide (CO) | Strongly coordinating molecule that chemisorbs on both metallic and oxide sites; can bridge multiple metal atoms. | Probing the coordination and oxidation state of active metal sites in catalysts [27]. |
| Ammonia (NH₃) | Basic probe molecule for characterizing surface acidity via chemisorption. | Acidity measurement of solid acid catalysts (e.g., zeolites, alumina-silica) [27]. |
| Porous Solids (Zeolites, Activated Carbon) | High-surface-area adsorbents with tunable surface chemistry (acidity, hydrophobicity) and pore structures. | Model adsorbents for gas separation, catalysis, and environmental remediation studies [25]. |
| Metal Nanoparticles on Supports (Pt/SiO₂, Pd/Al₂O₃) | Model catalysts with well-defined active phases dispersed on high-surface-area supports. | Studies of structure-activity relationships, metal dispersion, and catalytic performance [27]. |
Applications in Research and Industry
The distinct characteristics of physisorption and chemisorption make them suitable for different applications.
- Heterogeneous Catalysis: Chemisorption is a fundamental step in heterogeneous catalysis, where reactant molecules form intermediate surface complexes that are more receptive to chemical reaction [27] [24]. The catalytic activity depends critically on the strength of the chemisorption bond; if it is too weak, the molecule may desorb before reacting, and if it is too strong, the product may not be released, poisoning the catalyst [27]. An iconic example is the platinum-catalyzed reaction between hydrogen and oxygen to form water, where the platinum surface provides alternative reaction pathways by breaking the bonds in the gas molecules [24].
- Environmental Remediation and Water Purification: Adsorption is a key purification procedure for removing contaminants like heavy metals and organic dyes from wastewater [25]. Both physisorption and chemisorption play roles, often simultaneously [25]. Chemisorption mechanisms such as complexation reactions are particularly effective. For instance, modified sodium alginate materials can remove arsenic and chromium through complexation with functional groups [25]. Biosorbents, derived from natural biomass, are also gaining interest due to their multiple functional groups that enable sorption via electrostatic interaction, complexation, and ion exchange [25].
- Surface Area and Porosity Analysis: Physical adsorption of gases, particularly nitrogen at 77 K, is the standard method for characterizing the total surface area, pore volume, and pore size distribution of porous materials like catalyst supports, zeolites, and activated carbons [27] [24]. The analysis of the resulting physisorption isotherm provides critical information about the material's texture, which influences mass transfer, accessibility of active sites, and overall performance in applications ranging from drug delivery to gas storage.
- Computational Material Design: Modern research leverages molecular dynamics (MD), Monte Carlo (MC) simulations, and density functional theory (DFT) calculations to provide atomic-level insights into adsorption processes [29]. These methods simulate the entire adsorption process, predict equilibrium properties, and help understand stable adsorption configurations and interaction energies. This computational toolkit is invaluable for designing and optimizing new adsorbent materials before their synthetic realization [29].
Physisorption and chemisorption represent two distinct yet interconnected pathways by which molecules interact with surfaces. The comparative analysis presented in this guide underscores that physisorption, governed by weak van der Waals forces, is a reversible, non-specific process characterized by low enthalpy and multi-layer formation. In contrast, chemisorption, involving strong covalent or ionic bonding, is specific, often irreversible, and characterized by high enthalpy and monolayer limitation. The choice between these mechanisms—or their synergistic exploitation—dictates the efficiency of processes ranging from industrial catalysis and environmental cleanup to pharmaceutical development. A deep understanding of their side-by-side characteristics, combined with robust experimental and computational tools, empowers researchers to rationally design and optimize materials and processes for the advanced technological challenges of today and tomorrow.
In both chemical engineering and pharmaceutical development, the adsorption of molecules onto solid surfaces is a critical process, influencing applications ranging from drug delivery system design to contaminant removal. The thermodynamic analysis of adsorption provides fundamental insights into the energy changes and spontaneity of these processes, enabling scientists to optimize conditions for desired outcomes. Thermodynamic parameters—specifically Gibbs free energy (ΔG), enthalpy (ΔH), and entropy (ΔS)—serve as essential indicators of adsorption behavior, revealing whether a process occurs spontaneously and the nature of the driving forces involved. Within this framework, adsorption mechanisms are broadly classified as either physisorption, involving weak van der Waals forces, or chemisorption, characterized by strong chemical bonds. The distinction has profound implications for the stability, capacity, and reversibility of adsorption systems, making thermodynamic studies indispensable for researchers designing novel materials or processes.
This guide provides an in-depth technical examination of adsorption thermodynamics, focusing on experimental methodologies, data interpretation, and practical applications relevant to scientific researchers and drug development professionals. By integrating contemporary research case studies and quantitative data analysis, this work establishes a rigorous foundation for understanding how thermodynamic principles govern adsorption phenomena across different systems.
Core Thermodynamic Parameters in Adsorption
The spontaneity and fundamental nature of an adsorption process are quantitatively described by three primary thermodynamic parameters. The Gibbs free energy change (ΔG) determines the spontaneity of a process; a negative ΔG value indicates a thermodynamically favorable, spontaneous reaction [30]. The enthalpy change (ΔH) reveals whether the process is exothermic (releases heat, ΔH < 0) or endothermic (absorbs heat, ΔH > 0), providing insight into the energy changes during adsorption. The entropy change (ΔS) reflects the change in molecular disorder or randomness in the system upon adsorption.
These parameters are intrinsically related through the fundamental equation: ΔG = ΔH - TΔS, where T is the absolute temperature in Kelvin. In adsorption studies, the magnitude and sign of these parameters help distinguish between physisorption and chemisorption. Physisorption typically features lower enthalpy changes (ΔH < 40 kJ/mol), minimal activation energy requirements, and often negative entropy changes due to the reduced freedom of adsorbed molecules [30]. In contrast, chemisorption involves higher enthalpy changes (ΔH > 40 kJ/mol), significant activation energy barriers, and may result in either positive or negative entropy changes depending on the specific molecular rearrangements [30].
Table 1: Characteristic Thermodynamic Parameters for Physisorption vs. Chemisorption
| Parameter | Physisorption | Chemisorption |
|---|---|---|
| ΔH Magnitude | Typically < 40 kJ/mol [30] | Typically > 40 kJ/mol [30] |
| Activation Energy (Eₐ) | 5–40 kJ/mol [30] | 40–800 kJ/mol [30] |
| ΔS Change | Usually negative (molecules lose freedom) | Variable (can be positive if surface reconstruction occurs) |
| Nature of Bond | Weak van der Waals, electrostatic | Strong covalent, chemical bonds |
| Reversibility | Highly reversible | Often irreversible or requires significant energy for reversal |
| Temperature Dependence | Often decreases with increasing temperature | May increase or decrease with temperature depending on system |
Quantitative Thermodynamic Data from Contemporary Studies
Recent adsorption studies across various material systems provide concrete examples of how thermodynamic parameters are determined and interpreted. The following table summarizes key thermodynamic data from current research, illustrating the range of values encountered in different adsorption scenarios.
Table 2: Experimentally Determined Thermodynamic Parameters from Recent Adsorption Studies
| Adsorbate/Adsorbent System | Temperature Range (°C) | ΔH (kJ/mol) | ΔS (J/mol·K) | ΔG (kJ/mol) | Nature of Process | Citation |
|---|---|---|---|---|---|---|
| Hydroquinone/Quartz | 25-80 | -8.02 | 6.12 | Negative (spontaneous) | Exothermic, spontaneous | [31] |
| Hydroquinone/Carbonate Rock | 25-90 | -6.49 | 6.47 | -8.34 to -8.74 | Exothermic, spontaneous | [32] |
| Urotropine/Kaolinite | Not specified | +9.53 | Not specified | Negative (spontaneous) | Endothermic, spontaneous | [33] |
| Ni(II)/GO@Fe₃O₄@Pluronic-F68 | Not specified | Not specified | Not specified | Negative (spontaneous) | Spontaneous | [34] |
The data reveals how different adsorbate-adsorbent systems exhibit distinct thermodynamic signatures. For hydroquinone adsorption on both quartz and carbonate rocks, the consistently negative enthalpy values confirm exothermic processes, while the negative Gibbs free energy across all temperatures indicates spontaneity [31] [32]. Interestingly, the urotropine-kaolinite system demonstrates that endothermic adsorption (positive ΔH) can still proceed spontaneously when driven by sufficiently positive entropy changes [33]. This highlights the compensatory relationship between enthalpy and entropy in determining overall process spontaneity.
Temperature dependence represents another critical aspect of adsorption thermodynamics. For the hydroquinone-quartz system, adsorption capacity decreased significantly from 47.1 mg/g at 25°C to 27.1 mg/g at 80°C, reflecting the exothermic nature of the process where higher temperatures reduce favorability [31]. Similarly, in hydroquinone-carbonate systems, adsorption capacity declined from 45.2 mg/g at 25°C to 34.2 mg/g at 90°C [32]. This consistent pattern across different rock types provides valuable predictive insight for applications such as chemical injection strategies in subsurface environments where temperature variations occur naturally.
Experimental Protocols for Thermodynamic Parameter Determination
Batch Adsorption Experiments
The determination of thermodynamic parameters requires carefully controlled batch adsorption experiments followed by appropriate data analysis. A typical protocol involves preparing a series of adsorbate solutions across a concentration range (e.g., 100-100,000 mg/L for hydroquinone studies) using distilled or deionized water as the solvent [31] [32]. The solutions are mixed thoroughly using magnetic stirrers (commonly at 400 rpm) to ensure complete dissolution and homogeneity [31]. The adsorbent material is then added in precise quantities (e.g., 20 g quartz per 100 mL solution) to each solution, and the mixtures are agitated for a sufficient duration (typically 24 hours) to reach equilibrium at constant temperatures [31].
Post-equilibrium, the solid adsorbent is separated from the liquid phase via centrifugation (e.g., at 6000 rpm), and the residual adsorbate concentration in the supernatant is quantified using appropriate analytical techniques such as UV-Vis spectrophotometry [31]. The adsorption capacity at equilibrium (qe) is calculated using the equation: qe = 1000 × (Ci - Ce) × Vs / mq, where Ci and Ce represent the initial and equilibrium concentrations (mg/L), Vs is the solution volume (L), and mq is the adsorbent mass (g) [31]. This procedure is repeated across a temperature range (commonly 25°C to 90°C or higher) to capture temperature dependence.
Data Analysis and Parameter Calculation
Once equilibrium adsorption capacities are determined across temperatures, thermodynamic parameters are derived through mathematical analysis. The equilibrium constant (Kc) is first calculated from the adsorption data at different temperatures. The values of ΔH and ΔS are then determined from the van't Hoff equation: ln(Kc) = -ΔH/RT + ΔS/R, where R is the universal gas constant (8.314 J/mol·K) [30]. Plotting ln(K_c) versus 1/T yields a linear relationship where the slope equals -ΔH/R and the intercept equals ΔS/R.
The Gibbs free energy change is calculated at each temperature using the relationship: ΔG = -RT ln(K_c) [30]. Consistent negative ΔG values across temperatures confirm spontaneous processes, as observed in both hydroquinone-quartz and hydroquinone-carbonate systems [31] [32]. For activation energy (Eₐ) determination, which helps distinguish between physisorption and chemisorption, the Arrhenius equation is employed: ln(k₂) = ln(A) - Eₐ/RT, where k₂ is the pseudo-second-order rate constant at temperature T, and A is the Arrhenius constant [30]. The slope of the Arrhenius plot (ln(k₂) versus 1/T) provides the Eₐ value.
The Scientist's Toolkit: Essential Research Reagents and Materials
Successful adsorption thermodynamic studies require specific materials and analytical tools carefully selected based on the research objectives. The following table catalogizes essential components used in contemporary adsorption research, with examples drawn from recent studies.
Table 3: Essential Research Reagents and Materials for Adsorption Thermodynamic Studies
| Category/Item | Specification Examples | Function/Purpose | Research Example |
|---|---|---|---|
| Adsorbents | Quartz (96% purity, 10-250 µm particles) | Provides homogeneous adsorption surface with active sites | [31] |
| Carbonate rocks (>95% calcite, 2-4 µm) | Represents reservoir rocks for oil recovery studies | [32] | |
| Kaolinite (>97% purity, <2 µm) | High-specific surface area clay adsorbent | [33] | |
| GO@Fe₃O₄@Pluronic-F68 nanocomposite | Engineered nanomaterial for heavy metal removal | [34] | |
| Adsorbates | Hydroquinone (>98% purity) | Crosslinker for gelation studies in oil reservoirs | [31] [32] |
| Urotropine (>99% purity) | Crosslinking agent for in-situ gel injection processes | [33] | |
| Ni(II) ions (from NiCl₂·6H₂O) | Model heavy metal contaminant for removal studies | [34] | |
| Analytical Instruments | UV-Vis Spectrophotometer | Quantifies residual adsorbate concentration in solution | [31] [33] |
| Magnetic Stirrer (400 rpm) | Ensures homogeneous mixing of adsorption mixtures | [31] [32] | |
| Laboratory Centrifuge (6000 rpm) | Separates solid adsorbent from liquid phase post-adsorption | [31] | |
| FT-IR Spectrometer | Characterizes functional groups and surface chemistry | [34] | |
| Characterization Tools | X-ray Diffraction (XRD) | Verifies crystallinity and purity of adsorbent materials | [31] [33] |
| Scanning Electron Microscope (SEM) | Visualizes surface morphology and particle size distribution | [31] [34] | |
| BET Surface Area Analyzer | Measures specific surface area and pore characteristics | [34] |
The selection of appropriate adsorbent materials with well-characterized properties proves crucial for generating reproducible and meaningful thermodynamic data. High-purity materials (typically >95-97% purity) minimize interference from impurities, while controlled particle size distributions ensure consistent surface area availability for adsorption [31] [33]. Similarly, high-purity adsorbates enable accurate concentration measurements and reduce experimental uncertainty. The combination of bulk adsorption measurements with sophisticated characterization techniques provides comprehensive insight into both macroscopic thermodynamic behavior and molecular-level adsorption mechanisms.
Thermodynamic Distinctions: Case Studies in Physisorption and Chemisorption
Real-world research examples illustrate how thermodynamic parameters differentiate adsorption mechanisms and guide system optimization. The adsorption of hydroquinone on quartz and carbonate rocks exemplifies physisorption, with ΔH values of -8.02 kJ/mol and -6.49 kJ/mol respectively—well below the 40 kJ/mol threshold typically associated with chemisorption [31] [32] [30]. The negative ΔH values confirm exothermic processes, while negative ΔG across all temperatures demonstrates spontaneity. The decreasing adsorption capacity with increasing temperature further corroborates the exothermic nature, as higher temperatures reduce favorability according to Le Chatelier's principle [31].
In contrast, the adsorption of palladium on poly(m-aminobenzoic acid) polymer demonstrates classic chemisorption, with a reported activation energy of 61.71 kJ/mol, significantly exceeding the physisorption threshold [30]. Similarly, copper adsorption on A. bisporus showed chemisorption behavior with an activation energy of 118.86 kJ/mol, indicating strong chemical bonding between adsorbate and adsorbent [30]. These high activation energy values reflect the substantial energy barrier that must be overcome for chemical bond formation, unlike the minimal barriers in physisorption.
Interestingly, some systems exhibit atypical thermodynamic behavior that reveals complex underlying mechanisms. The adsorption of urotropine on kaolinite demonstrates endothermic character (ΔH = +9.53 kJ/mol) yet proceeds spontaneously, indicating that the process is entropy-driven rather than energy-driven [33]. This suggests that structural rearrangements or solvent effects contribute significantly to the adsorption mechanism. Such cases highlight the importance of measuring all thermodynamic parameters rather than assuming behavior based on limited data.
Thermodynamic analysis provides fundamental insights into adsorption processes that are critical for advancing research across scientific disciplines and industrial applications. The parameters ΔG, ΔH, and ΔS collectively describe system spontaneity, energy changes, and structural reorganizations during adsorption, enabling researchers to distinguish between physisorption and chemisorption mechanisms. Contemporary research demonstrates that these thermodynamic principles apply consistently across diverse systems—from hydroquinone adsorption in reservoir engineering to heavy metal removal using advanced nanomaterials.
The experimental methodologies outlined in this work provide a rigorous framework for determining thermodynamic parameters, while case studies illustrate how these principles manifest in real research scenarios. As adsorption technologies continue to evolve in sophistication—from MOF-based CO₂ capture to targeted drug delivery systems—thermodynamic perspectives will remain essential for optimizing performance, predicting behavior under varying conditions, and designing novel materials with tailored adsorption properties. For researchers and drug development professionals, this thermodynamic foundation enables evidence-based decisions in process design and material selection, ultimately contributing to more efficient and effective technological solutions.
Techniques and Real-World Applications in Science and Industry
In surface chemistry, adsorption describes the process where atoms, ions, or molecules from a substance (gas, liquid, or dissolved solid) adhere to the surface of an adsorbent. This process is distinct from absorption, where a substance permeates into the bulk of a material. The broader term sorption encompasses both phenomena [35]. Understanding the mechanism—whether it is physical adsorption (physisorption) or chemical adsorption (chemisorption)—is fundamental to designing and optimizing materials for applications in catalysis, environmental remediation, and drug development.
The distinction between physisorption and chemisorption is critical. Physisorption is characterized by weak van der Waals forces, is typically reversible, and occurs more readily at low temperatures. In contrast, chemisorption involves the formation of strong chemical bonds, is often irreversible, and may require higher temperatures to proceed [5] [4]. The potential energy curve for an adsorbate approaching a surface clearly shows a shallow physisorption well at a larger distance from the surface, which may be a precursor to a deeper chemisorption well at a shorter distance, separated by an activation energy barrier [4].
Characterizing the adsorbent materials is crucial to linking their physical and chemical properties to their performance. This guide details four core techniques—BET, FTIR, XRD, and SEM—that are indispensable for elucidating the properties of porous materials like Activated Carbon Black Microparticles (ACBMPs) and others used in adsorption studies.
Core Characterization Techniques
Surface Area and Porosity Analysis (BET Theory)
The Brunauer-Emmett-Teller (BET) theory is the standard method for determining the specific surface area of porous materials by analyzing the physical adsorption of gas molecules (typically nitrogen at 77 K) on a solid surface.
- Principle: The theory extends the Langmuir model to multilayer adsorption. It operates by measuring the quantity of adsorbate gas required to form a monomolecular layer on the adsorbent surface, which is then used to calculate the total specific surface area.
- Data Output: The primary result is the specific surface area (m²/g). The analysis of the adsorption and desorption isotherms can also provide information about the pore size distribution, distinguishing between micropores (pores < 2 nm), mesopores (pores between 2-50 nm), and macropores (pores > 50 nm).
- Relevance to Adsorption: Surface area is a primary factor determining the capacity of an adsorbent in physisorption processes. A higher surface area provides more sites for adsorbate molecules to adhere. For instance, Activated Carbon Black typically has a large internal surface area ranging from 500 to 2000 m²/g [36].
Chemical Bonding and Functional Group Analysis (FTIR)
Fourier-Transform Infrared (FTIR) Spectroscopy is used to identify the chemical functional groups present on the surface of an adsorbent, which is vital for understanding chemisorption mechanisms.
- Principle: The technique measures the absorption of infrared light by a material. Different chemical bonds (e.g., O-H, C=O, C-O) vibrate at characteristic frequencies, producing a unique absorption spectrum that acts as a molecular fingerprint.
- Data Output: An IR spectrum plotting transmittance or absorbance against wavenumber (cm⁻¹). Specific peaks are identified and correlated to known functional groups.
- Relevance to Adsorption: FTIR can confirm the successful activation of materials (e.g., by phosphoric acid) and identify surface functional groups (e.g., carboxyl, hydroxyl, carbonyl) that can form strong chemical bonds with adsorbates, facilitating chemisorption [37] [36]. It can also be used to study the mechanism of dye adsorption, such as with Methyl Red (MR) molecules [36].
Crystalline Structure and Phase Identification (XRD)
X-ray Diffraction (XRD) is employed to determine the crystallinity, phase composition, and structural parameters of solid adsorbents.
- Principle: A collimated X-ray beam strikes a powdered sample, and the constructive interference of the scattered X-rays occurs at specific angles according to Bragg's law (nλ = 2d sinθ). This produces a diffraction pattern unique to the material's atomic structure.
- Data Output: A diffractogram plotting intensity against the diffraction angle (2θ). The positions of the peaks identify the crystalline phases, while peak broadening can be used to estimate crystallite size.
- Relevance to Adsorption: XRD reveals the d-spacing (the distance between parallel crystal planes), which can indicate the presence of graphitic structures or other layered materials. For example, in ACBMPs, the parallel planes spacing (dₕₖₗ) of the carbonaceous framework sheets was found to be about 2.98 Å to 4.44 Å [36]. Changes in d-spacing or crystallinity after activation or adsorption can provide insights into the interaction mechanism.
Surface Morphology and Topography Analysis (SEM)
Scanning Electron Microscopy (SEM) provides high-resolution, topographical images of the adsorbent's surface, revealing its micro- and nano-structure.
- Principle: A focused beam of high-energy electrons scans the sample surface. The interactions between the electrons and the atoms in the sample generate various signals (e.g., secondary electrons, backscattered electrons) that are detected to create an image.
- Data Output: High-resolution, black-and-white images showing surface morphology, texture, and porosity.
- Relevance to Adsorption: SEM directly visualizes the pore structure, active site shapes, and surface geometry of adsorbents. For instance, SEM analysis of ACBMPs revealed "super macro voids" with average diameters of 150 nm to 400 nm and numerous nano-scale wells, which are critical for adsorption and catalytic processes [37] [36]. This helps researchers understand the physical pathways and available surfaces for adsorbate molecules.
Table 1: Summary of Core Characterization Techniques in Adsorption Studies
| Technique | Primary Information Obtained | Key Parameters in Adsorption | Applicable Adsorption Type |
|---|---|---|---|
| BET | Specific surface area, pore volume, pore size distribution | Surface area (500-2000 m²/g for ACB [36]), pore size (Micropores: <2 nm, Mesopores: 2-50 nm) | Primarily Physisorption |
| FTIR | Identification of surface functional groups and chemical bonds | Presence of O-H, C=O, C-O bonds; changes after adsorption [37] [36] | Primarily Chemisorption |
| XRD | Crystalline structure, phase identification, d-spacing, crystallite size | d-spacing (e.g., 2.98-4.44 Å in ACBMPs [36]), crystallinity | Both |
| SEM | Surface morphology, topography, pore structure visualization | Pore size (e.g., 150-400 nm macro voids in ACBMPs [37]), surface texture, active site shape | Both |
Experimental Protocols and Workflows
Integrated Workflow for Adsorbent Characterization
A typical experimental workflow for characterizing a novel adsorbent, such as Activated Carbon Black Microparticles (ACBMPs), involves a sequential and complementary application of the techniques described above. The following diagram visualizes this integrated workflow from sample preparation through to data synthesis.
Diagram 1: Integrated characterization workflow for adsorbent analysis.
Detailed Protocol for Adsorbent Fabrication and Analysis
The following protocol is adapted from a study on fabricating and characterizing Activated Carbon Black Microparticles (ACBMPs) [36]. This serves as a concrete example of how these techniques are applied in practice.
1. Materials and Equipment
- Materials: Commercial Carbon Black powder, Virgin Coconut Oil (VCO), Distilled Water, Phosphoric Acid (H₃PO₄), Sodium Hydroxide (NaOH), Methyl Red dyes.
- Equipment: Ball milling machine, Electrical Oven, Furnace (capable of 400°C, 500°C, 600°C), Ultrasonic cleaner (40 kHz, 2 × 50 W), SEM-EDX instrument, X-ray Diffractometer, FTIR Spectrometer, Particles Size Analyzer (Dynamic Light Scattering method), UV-Vis spectrometer.
2. Fabrication of Activated Carbon Black Microparticles (ACBMPs)
- Milling: Begin by milling 200 g of commercial carbon black (CB) powder to 100 meshes (approximately 80 microns) using a ball milling machine.
- Dispersion and Ultrasonic Treatment: Mix the fine CB powder with 1000 mL of a DW/VCO mixture (995:5 volume ratio). Treat this mixture with ultrasonic agitation for 20 minutes. Allow it to equilibrate at room temperature for 24 hours. Decant to remove the upper aqueous layer, obtaining CB microparticles (CBMPs). Dry the CBMPs at 110°C until a constant weight is achieved.
- Chemical Activation: Homogeneously mix samples of dried CBMPs (e.g., 50 g each) with varying masses of H₃PO₄ (e.g., 50 g, 75 g, 100 g) to achieve different impregnation ratios (1:1, 1:1.5, 1:2). Incubate the mixtures at room temperature for 12 hours.
- Thermal Activation: Heat approximately 2.5 g of the acid-impregnated samples in a furnace at various temperatures (e.g., 400°C, 500°C, 600°C) and for different durations (e.g., 20, 40, 60 minutes).
- Washing and Drying: After thermal treatment, wash the samples thoroughly with distilled water until a neutral pH (~7) is reached. Follow this with a wash using 0.5 M NaOH solution to remove residual acid, and finally wash again with distilled water to pH 7. Dry the final fabricated ACBMPs samples in an oven at 105°C.
3. Characterization of ACBMPs
- Particle Size Analysis: Use a Particle Size Analyzer (e.g., Horiba Scientific SZ-100) based on Dynamic Light Scattering (DLS). The hydrodynamic diameter (Dₕ) is calculated using the Stokes-Einstein equation: Dₕ = (kₚT)/(3πηDₜ), where kₚ is the Boltzmann constant, T is temperature, η is dynamic viscosity, and Dₜ is the diffusion coefficient [36].
- SEM Analysis: Image the surface morphology of the ACBMPs using a Scanning Electron Microscope (e.g., JEOL JSM-6510LA). Operate at various magnifications (5,000x, 10,000x, 20,000x) to visualize super macro voids, nano-wells, and the shapes of binding or active sites [37] [36].
- XRD Analysis: Analyze the crystallinity and d-spacing of the carbonaceous framework using an X-ray Diffractometer. The diffraction pattern will allow for the calculation of the interlayer spacing (dₕₖₗ) using Bragg's law [36].
- FTIR Analysis: Obtain the infrared spectrum of the ACBMPs using an FTIR Spectrometer (e.g., Perkin Elmer) to identify the types of chemical bonds and functional groups present on the surface after activation [37] [36].
Table 2: Essential Research Reagent Solutions and Materials
| Material/Reagent | Function in Adsorption Studies | Example Use Case |
|---|---|---|
| Activated Carbon Black | High-surface-area adsorbent for pollutants and catalysts. | Base material for fabricating ACBMPs [36]. |
| Phosphoric Acid (H₃PO₄) | Chemical activating agent to create and functionalize pores. | Used to impregnate CBMPs before thermal activation [36]. |
| Virgin Coconut Oil (VCO) | Organic dispersing agent for carbon black. | Used in a water mixture to disperse CB during ultrasonic treatment [36]. |
| Methyl Red (MR) Dye | Model adsorbate molecule for testing adsorption capacity. | Guest molecule to study entry into ACBMPs intra-particles pores [37] [36]. |
| Sodium Hydroxide (NaOH) | Alkaline solution for neutralizing acid after activation. | Used in the washing step to remove residual H₃PO₄ from ACBMPs [36]. |
Data Interpretation and Correlation with Adsorption Type
The power of this analytical suite lies in correlating data from all techniques to build a comprehensive picture of the adsorbent and its function.
Distinguishing Physisorption and Chemisorption
The following diagram illustrates how characterization data can be used to identify the dominant adsorption mechanism.
Diagram 2: Technique signatures for physisorption vs. chemisorption.
Case Study: Interpreting Data from ACBMPs Research
The study on ACBMPs provides a practical example of data correlation [37] [36]:
- SEM and Adsorption: SEM images confirmed the generation of "super macro voids" (150-400 nm) and nano-scale wells, which act as transit terminals for guest molecules like Methyl Red to enter the intra-particle pores. A nomenclature based on the shape of these active sites (Q1-Q4 quadrants with different turn angles) was proposed, linking physical structure to function.
- XRD and Structure: XRD analysis revealed the internal carbonaceous structure, with d-spacings of 2.98 Å to 4.44 Å, indicative of the parallel planes of carbon sheets. This information is crucial for understanding the potential for adsorbates to intercalate or adsorb on graphitic surfaces.
- FTIR and Surface Chemistry: FTIR analysis identified the typical chemical bonds in the activated carbon, confirming the successful introduction of functional groups during the H₃PO₄ activation process, which can serve as specific sites for chemisorption.
- Synthesis: The combination of ultrasonic and thermal energy treatments successfully created a material with a complex hierarchical pore structure (from macro to nano) and specific surface chemistry, making it highly effective for adsorption.
The synergistic application of BET, FTIR, XRD, and SEM provides an unparalleled toolkit for deconstructing the performance of adsorbent materials. BET quantifies the "stage" for physisorption, FTIR identifies the "actors" (functional groups) for chemisorption, XRD reveals the "scaffolding" (crystalline structure), and SEM visualizes the "landscape" (morphology). For researchers in fields from environmental engineering to pharmaceutical development, mastering these techniques and their interrelationships is essential for rationally designing and optimizing next-generation materials tailored for specific adsorption applications, effectively bridging the fundamental understanding of physical versus chemical adsorption to practical implementation.
Adsorption, the adhesion of atoms, ions, or molecules from a gas, liquid, or dissolved solid to a surface, is a fundamental process with critical applications across environmental remediation, drug delivery, catalysis, and gas separation technologies [1]. This surface phenomenon is distinct from absorption, where a fluid permeates the volume of a material. Understanding and quantifying adsorption equilibria is essential for designing efficient adsorption systems, with adsorption isotherms serving as the primary tool for describing how adsorbate molecules distribute between the solid and fluid phases at equilibrium [1].
The analysis of adsorption mechanisms hinges on differentiating between physisorption, characterized by weak van der Waals forces, and chemisorption, which involves strong covalent bonding and often irreversible, monolayer coverage [1]. Isotherm modeling provides critical insights into these mechanisms, surface energetics, and adsorbent capacity. Among the numerous models developed, the Langmuir and Freundlich isotherms stand as the most widely applied frameworks for analyzing adsorption equilibrium data [38]. This technical guide provides an in-depth analysis of these fundamental models, their mathematical formulations, parameter interpretations, and practical applications, with a specific focus on differentiating physical adsorption from chemisorption processes.
Theoretical Foundations of Isotherm Models
The Langmuir Isotherm: Homogeneous Monolayer Adsorption
Proposed by Irving Langmuir in 1918, the Langmuir isotherm model derives from kinetic principles and statistical thermodynamics, built upon several key assumptions [1]. The model presumes a homogeneous adsorbent surface with energetically equivalent adsorption sites, each capable of accommodating a single adsorbate molecule (monolayer coverage). It further assumes that no interactions occur between adsorbed molecules and that adsorption is confined to localized sites without phase transitions [1].
The Langmuir model describes the relationship between the fractional surface coverage (θ) and the equilibrium adsorbate concentration (Cₑ) or pressure (P) as follows. For liquid-phase adsorption, the amount adsorbed per unit mass of adsorbent (qₑ) is given by [39]:
[ qe = \frac{{a \cdot b \cdot Ce}}{{1 + b \cdot C_e}} ]
Where:
- qₑ = amount of adsorbate adsorbed per unit mass of solid (mg/g)
- a = maximum monolayer adsorption capacity (mg/g)
- b = Langmuir adsorption constant related to the energy of adsorption (L/mg)
- Cₑ = equilibrium solution concentration of the adsorbate (mg/L)
For gas-phase adsorption, the model is expressed in terms of pressure [1]:
[ \theta = \frac{{K \cdot P}}{{1 + K \cdot P}} ]
Where:
- θ = fraction of surface coverage
- K = equilibrium constant (adsorption coefficient)
- P = pressure
The Langmuir constant K (or b) reflects the affinity between the adsorbate and adsorbent, with higher values indicating stronger affinity. The model predicts near-linear adsorption at low concentrations (θ ≈ KP) and approaches maximum surface coverage (θ ≈ 1) at high concentrations [1]. A dimensionless separation factor (RL) derived from the Langmuir constant indicates whether adsorption is irreversible (RL=0), favorable (0
The Freundlich Isotherm: Heterogeneous Surface Adsorption
The Freundlich isotherm, developed earlier than the Langmuir model, is an empirical equation designed to describe adsorption on heterogeneous surfaces and multilayer adsorption [38]. Unlike the Langmuir model, it does not approach a limiting saturation capacity, making it suitable for systems where adsorption capacity increases continuously with concentration.
The Freundlich equation is expressed as [39]:
[ qe = Kf \cdot C_e^{1/n} ]
Where:
- qₑ = amount of adsorbate adsorbed per unit mass of solid (mg/g)
- K_f = Freundlich adsorption capacity constant (mg/g)
- 1/n = Freundlich intensity parameter (dimensionless)
- Cₑ = equilibrium solution concentration of the adsorbate (mg/L)
The parameter 1/n indicates the adsorption intensity or surface heterogeneity. Values of 1/n < 1 suggest favorable adsorption, 1/n > 1 indicates unfavorable adsorption, and 1/n = 1 implies linear adsorption where partition coefficients are concentration-independent [39] [40]. The Freundlich model can be linearized by taking logarithms:
[ \log qe = \log Kf + \frac{1}{n} \log C_e ]
This linear form allows for easy determination of K_f and 1/n from experimental data by plotting log qₑ versus log Cₑ.
Advanced and Hybrid Isotherm Models
For complex adsorption systems, several advanced models have been developed:
- Langmuir-Freundlich (Sips) Isotherm: This hybrid model combines features of both Langmuir and Freundlich isotherms, incorporating surface heterogeneity while maintaining a saturation limit at high concentrations [40]. It is expressed as:
[ qe = \frac{{q{MLF} \cdot (K{LF} \cdot Ce)^{M{LF}}}}{{1 + (K{LF} \cdot Ce)^{M{LF}}}} ]
Where M_LF is the heterogeneity parameter. The model reduces to the Freundlich isotherm at low concentrations and approaches Langmuir behavior at high concentrations [40].
- Temkin Isotherm: This model accounts for adsorbent-adsorbate interactions by assuming that the heat of adsorption decreases linearly with coverage due to these interactions [40]. The model is expressed as:
[ qe = B \ln A + B \ln Ce ]
Where B = RT/b, b is the Temkin constant related to heat of adsorption, and A is the Temkin isotherm constant [40].
Table 1: Comparison of Fundamental Adsorption Isotherm Models
| Model | Surface Assumption | Adsorption Type | Key Parameters | Best Application |
|---|---|---|---|---|
| Langmuir | Homogeneous, finite identical sites | Monolayer, no interaction | a (mg/g), b (L/mg) | Chemisorption, uniform surfaces |
| Freundlich | Heterogeneous, different site energies | Multilayer, exponential energy distribution | K_f (mg/g), 1/n | Physisorption, heterogeneous surfaces |
| Langmuir-Freundlich (Sips) | Heterogeneous with saturation | Combined features | KLF, MLF, q_MLF | Systems showing both heterogeneity and saturation |
| Temkin | Uniform distribution of binding energies | Accounts for adsorbate interactions | A (L/g), B | Systems with significant adsorbate-adsorbate interactions |
Experimental Protocols for Isotherm Determination
Batch Adsorption Methodology
Determining adsorption isotherms typically involves batch equilibrium studies. The following protocol outlines a standardized approach for liquid-phase adsorption experiments, adaptable for various adsorbent-adsorbate systems:
Adsorbent Preparation: Characterize the adsorbent material for physical and chemical properties. Key characterization techniques include:
Solution Preparation: Prepare stock solutions of the adsorbate at known concentrations. For heavy metal adsorption studies, synthetic solutions at specified concentrations (e.g., copper solutions at 10-50 mg/L) are commonly used [39].
Experimental Procedure:
- Place a fixed mass of adsorbent (e.g., 1 g/L) in a series of containers with varying initial adsorbate concentrations (C₀) [39]
- Maintain constant temperature using a water bath or environmental chamber
- Agitate the mixtures until equilibrium is reached (typically 2-24 hours, depending on the system) [39]
- Separate the adsorbent from the solution via filtration or centrifugation
- Analyze the equilibrium concentration (Cₑ) in the supernatant using appropriate analytical techniques (AAS, ICP, UV-Vis spectroscopy)
Data Calculation: Calculate the amount adsorbed at equilibrium (qₑ) using the mass balance equation [39]:
[ qe = \frac{{(C0 - C_e) \cdot V}}{m} ]
Where:
- C₀ = initial concentration of adsorbate (mg/L)
- Cₑ = equilibrium concentration of adsorbate (mg/L)
- V = volume of solution (L)
- m = mass of adsorbent (g)
- Model Fitting: Fit the experimental (qₑ, Cₑ) data pairs to isotherm models using nonlinear regression techniques. Avoid using linearized forms as they can distort error distribution [1]. Evaluate model fit using statistical parameters like R² and RMSE [41].
Model-Based Design of Experiments (MBDoE)
Traditional equidistant measurement points in isotherm studies often yield suboptimal information for parameter estimation. Model-Based Design of Experiments (MBDoE) provides a systematic approach to identify the most informative experimental conditions, significantly reducing experimental effort while maintaining model accuracy [42].
The MBDoE framework involves:
- Preliminary Experiments: Conducting initial screening experiments to identify potential isotherm shapes
- Model Discrimination: Designing experiments to distinguish between competing isotherm models
- Parameter Precision: Optimizing experimental conditions to minimize parameter uncertainty
- Iterative Refinement: Sequentially updating the experimental design based on incoming data
Studies demonstrate that MBDoE can reduce experimental effort by 70-81% while maintaining or improving parameter estimation accuracy compared to conventional equidistant point selection [42].
Diagram 1: Experimental workflow for adsorption isotherm determination incorporating MBDoE principles
Data Analysis and Interpretation
Comparative Analysis of Langmuir and Freundlich Parameters
Interpreting isotherm parameters provides critical insights into adsorption mechanisms and surface properties. The following case studies illustrate typical parameter values and their interpretations:
In a study on copper removal by limestone adsorbent, both Langmuir and Freundlich models were fitted to experimental data [39]. The Langmuir parameters were determined as a = 0.022 mg/g and b = 1.46 L/mg, while the Freundlich parameters were K_f = 0.010 mg/g and n = 1.58 L/mg [39]. The higher coefficient of determination (R²) for the Freundlich model indicated that it better described the adsorption process, suggesting surface heterogeneity and multilayer adsorption.
For drug delivery applications, a study on disulfiram adsorption onto mesoporous silica SBA-3 revealed that a simple Langmuir model showed strong discrepancies with experimental data [43]. Implementing a hybrid Langmuir model with two different adsorption sites (accounting for geminal and vicinal silanol groups with different adsorption energies) significantly improved the fit, demonstrating the importance of selecting appropriate models for complex surfaces [43].
Table 2: Typical Parameter Values and Interpretations for Langmuir and Freundlich Models
| Parameter | Typical Range | Physical Interpretation | Implications for Adsorption Mechanism |
|---|---|---|---|
| Langmuir a | Varies widely with system | Maximum monolayer capacity (mg/g) | Higher values indicate greater adsorption potential |
| Langmuir b | 0.1 - 10 L/mg | Affinity constant related to adsorption energy | Higher values indicate stronger adsorbate-adsorbent affinity |
| R_L | 0 < R_L < 1 (favorable) | Separation factor | R_L < 1 indicates favorable adsorption; smaller values = more favorable |
| Freundlich K_f | Varies with system | Adsorption capacity indicator | Higher values indicate greater adsorption capacity |
| Freundlich 1/n | 0.1 - 1 (typically) | Surface heterogeneity index | Values closer to 0 indicate greater heterogeneity; <1 = favorable adsorption |
Distinguishing Physisorption and Chemisorption through Isotherm Analysis
Isotherm modeling provides critical evidence for differentiating between physisorption and chemisorption mechanisms:
Physisorption typically exhibits characteristics aligned with Freundlich model behavior, indicating multilayer formation on heterogeneous surfaces with relatively low adsorption energies [1]. Physisorption isotherms often show reversible adsorption with minimal hysteresis.
Chemisorption typically follows Langmuir model behavior, suggesting monolayer coverage on specific, uniform active sites with higher adsorption energies [1]. Chemisorption often involves irreversible binding and may exhibit significant activation energy.
The table below summarizes key diagnostic criteria for distinguishing these mechanisms through isotherm analysis:
Table 3: Isotherm Characteristics for Physisorption vs. Chemisorption
| Characteristic | Physisorption | Chemisorption |
|---|---|---|
| Best-Fit Model | Often Freundlich or BET | Typically Langmuir |
| Layer Formation | Multilayer possible | Monolayer only |
| Binding Energy | Low (ΔE < 40 kJ/mol) | High (ΔE > 80 kJ/mol) |
| Temperature Dependence | Decreases with increasing temperature | May increase with temperature |
| Reversibility | Highly reversible | Often irreversible |
| Surface Specificity | Non-specific | Highly specific |
| Isotherm Shape | Type II, III (BET-like) | Type I (Langmuir-like) |
Applications in Research and Industry
Environmental Remediation
In water treatment applications, adsorption isotherms play a crucial role in designing contaminant removal systems. For heavy metal removal, such as copper adsorption on limestone, isotherm studies help determine the optimal adsorbent dosage and predict removal efficiency under various concentration conditions [39]. The Freundlich model's superior fit in such systems informs engineers about the heterogeneous nature of low-cost adsorbents, guiding material selection and process optimization.
For multicomponent systems common in industrial wastewater, competitive adsorption models become essential. The recently developed JAMM (Jeppu Amrutha Manipal Multicomponent) isotherm incorporates interaction coefficients and mole fraction parameters to predict adsorption behavior in complex mixtures, addressing a significant limitation of traditional single-component models [44].
Pharmaceutical and Drug Delivery Applications
In pharmaceutical research, adsorption isotherms guide the design of drug delivery systems, particularly for loading active compounds onto carrier materials. For example, studies on disulfiram adsorption onto mesoporous silica for cancer therapy utilize isotherm analysis to optimize drug loading conditions [43]. The hybrid Langmuir model accounting for different silanol group interactions demonstrates how sophisticated isotherm analysis can reveal molecular-level interactions critical for formulation development.
The finding that disulfiram forms a monolayer coverage of 0.93 μmol/m² on SBA-3 silica, with geminal and vicinal silanol groups exhibiting different complexation energies (differing by 10.5 kJ/mol at MP2 level), illustrates the precision possible with advanced isotherm modeling in drug carrier design [43].
Gas Separation and Carbon Capture
For gas phase applications like CO₂ capture on activated carbon, isotherm modeling provides essential data for process design. Advanced statistical physics models that treat adsorption as a multilayer process with two energy types (-ε1 for adsorbent-adsorbate interactions and -ε2 for adsorbate-adsorbate interactions in subsequent layers) have shown excellent correlation with experimental CO₂ adsorption data on activated carbon derived from olive waste [41].
These models reveal that the number of CO₂ molecules captured per site (n) increases with temperature (from 1.41 to 1.98 between 298-318 K), indicating a thermally activated process where temperature influences the aggregation mechanism [41].
Essential Research Reagents and Materials
Table 4: Key Research Materials for Adsorption Studies
| Material/Reagent | Specification Requirements | Function in Experiments |
|---|---|---|
| Activated Carbon | High surface area (500-1500 m²/g), controlled pore size distribution | Primary adsorbent for various contaminants |
| Mesoporous Silica | Uniform pore size (2-50 nm), high surface area | Drug carrier, model adsorbent for molecular studies |
| Limestone Adsorbent | Specific particle sizes (e.g., 3.75 mm), characterized composition | Low-cost adsorbent for heavy metal removal |
| Heavy Metal Salts | Analytical grade (e.g., CuSO₄, Pb(NO₃)₂, K₂Cr₂O₇) | Model contaminants for adsorption studies |
| pH Buffer Solutions | Certified buffers covering relevant pH range (3-9) | Control of solution chemistry for pH-dependent studies |
| Analytical Standards | Certified reference materials for calibration | Quantitative analysis of equilibrium concentrations |
Diagram 2: Logical relationships between isotherm models and adsorption mechanism interpretations
The Langmuir and Freundlich isotherm models provide fundamental frameworks for analyzing adsorption data, each with distinct assumptions and applications. The Langmuir model excels in describing monolayer adsorption on homogeneous surfaces, typically associated with chemisorption processes involving specific, high-energy binding sites. In contrast, the Freundlich model better represents adsorption on heterogeneous surfaces with exponential energy distribution, typically observed in physisorption systems where multilayer formation occurs through weaker intermolecular forces.
Selecting the appropriate model requires careful consideration of the adsorbent-adsorbate system, with advanced hybrid models like Langmuir-Freundlich and statistical physics approaches providing more nuanced insights for complex surfaces. Through rigorous experimental design, including Model-Based Design of Experiments, and comprehensive data interpretation, researchers can extract meaningful parameters that inform both fundamental understanding and practical applications across environmental technology, pharmaceutical development, and industrial separation processes. The continued development of multicomponent and advanced isotherm models promises enhanced predictive capabilities for real-world applications where multiple adsorbates compete for surface sites.
Physisorption, or physical adsorption, is a fundamental process where gas or liquid molecules adhere to a solid surface through weak, non-covalent interactions, primarily van der Waals forces. Unlike chemisorption, which involves the formation of strong chemical bonds, physisorption is characterized by its reversibility and lower enthalpy of adsorption, typically ranging from 20 to 40 kJ/mol [5]. This reversible nature, driven by equilibrium dynamics where increased pressure favors adsorption and decreased pressure facilitates desorption, makes physisorption exceptionally well-suited for cyclic processes like gas separation and purification [5]. The process is exothermic and occurs more readily at lower temperatures, as increased molecular kinetic energy at higher temperatures promotes desorption [45] [5].
A critical advantage of physisorption is its lack of specificity; all gases can be physisorbed on any solid surface to some degree, though gases with higher critical temperatures (more easily liquefied) generally exhibit stronger adsorption due to enhanced van der Waals interactions [5]. These characteristics have established physisorption as a cornerstone mechanism in diverse technological applications, including energy storage, environmental remediation, and industrial separation processes [45] [13]. This guide explores its operational principles in three key areas: gas separation, humidity control, and vacuum generation, providing detailed experimental protocols and data analysis for researchers and engineers.
Fundamental Principles and Comparison with Chemisorption
Understanding the distinctions between physisorption and chemisorption is crucial for selecting the appropriate mechanism for a given application. The following table summarizes the key differences:
Table 1: Fundamental Differences Between Physisorption and Chemisorption
| Property | Physisorption | Chemisorption |
|---|---|---|
| Binding Forces | Weak van der Waals forces [45] | Strong chemical bonds [5] |
| Enthalpy (kJ/mol) | Low (20-40) [5] | High (80-240) [5] |
| Reversibility | Reversible; highly dependent on pressure and temperature [45] [5] | Largely irreversible [5] |
| Temperature Dependence | Favored at low temperatures [45] [5] | Often requires high temperature and increases initially with temperature [5] |
| Specificity | Non-specific [5] | Highly specific [5] |
| State of Adsorbate | No change in state of the adsorbate [5] | Adsorbate may change its state due to chemical reaction [5] |
| Layer Formation | Multilayers possible [45] | Typically limited to a monolayer [45] |
The operational window for physisorption is primarily defined by temperature and pressure. The following conceptual diagram illustrates the typical dependence of adsorption capacity on these parameters for both processes.
Figure 1: Adsorption Capacity vs. Temperature. This diagram shows the general trend of adsorption capacity for physisorption and chemisorption. Physisorption capacity decreases monotonically with increasing temperature, while chemisorption often requires an activation energy, leading to an initial increase before decreasing at higher temperatures.
Physisorption in Gas Separation
Gas separation represents a primary application of physisorption, leveraging differences in the affinity and diffusion rates of gas molecules within porous adsorbents. The efficiency of separation hinges on the adsorbent's textural properties, including specific surface area, pore size distribution, and pore volume [46].
Case Study: Methane Storage via Activated Carbon
Adsorbed Natural Gas (ANG) technology using activated carbons (ACs) is a promising alternative to compressed natural gas, operating at significantly lower pressures. A 2025 study investigated CH₄ adsorption on biomass-derived ACs to develop a semi-empirical adsorption model, quantitatively linking capacity to pore size [46].
Table 2: Quantitative Contribution of Micropore Sizes to CH₄ Adsorption on Activated Carbon [46]
| Micropore Size Range | Contribution at 1 bar (%) | Contribution at 35 bar (%) |
|---|---|---|
| dᵢ < 0.76 nm | 91 | 35 |
| 0.76 nm < dᵢᵢ < 1.14 nm | 9 | 54 |
| 1.14 nm < dᵢᵢᵢ < 2 nm | 1 | 11 |
The data demonstrates a dramatic shift in the most effective pore sizes with increasing pressure. At low pressure (1 bar), ultra-narrow micropores (<0.76 nm) contribute over 90% of the adsorption capacity due to the overlapping potential of pore walls, creating a strong adsorption field. At high pressure (35 bar), the contribution shifts to wider micropores (0.76-1.14 nm), which can accommodate multiple layers of CH₄ molecules, maximizing volumetric storage capacity [46]. This pore-size/pressure relationship is critical for designing optimal ANG adsorbents.
Experimental Protocol: Gas Adsorption Isotherm Measurement
Objective: To determine the methane storage capacity and pore size distribution of activated carbon adsorbents.
Materials and Equipment:
- Adsorbent: Activated carbon (e.g., PC series from polysaccharide precursor) [46].
- Analytical Gas: High-purity CH₄ (99.99%) and N₂ (99.999%) [46].
- Core Equipment: High-pressure volumetric or gravimetric adsorption analyzer (e.g., Belsorp series) [13].
- Sample Cell: A calibrated, high-pressure vessel capable of withstanding at least 35 bar.
- Auxiliary: High-vacuum system (<10⁻³ mbar) for degassing, temperature-controlled bath (e.g., 298 K) [46].
Procedure:
- Sample Preparation: Approximately 0.5-1.0 g of AC sample is loaded into the sample cell.
- Degassing: The sample is heated under vacuum (e.g., 573 K) for several hours (e.g., 12 h) to remove pre-adsorbed contaminants and water vapor [46].
- Leak Check: The sealed system is checked for leaks before introducing the analysis gas.
- Isotherm Measurement:
- The system is brought to a constant temperature (e.g., 298 K).
- CH₄ gas is introduced into the system in incremental doses up to the target pressure (e.g., 35 bar).
- After each gas dose, the system is allowed to reach equilibrium, and the quantity of gas adsorbed is calculated from pressure (volumetric) or mass (gravimetric) changes.
- The desorption isotherm can be measured by reversing the process.
- Pore Size Analysis: The N₂ adsorption isotherm at 77 K is also measured. Micropore size distribution is calculated from this isotherm using methods such as Non-Local Density Functional Theory (NLDFT) or Quenched Solid Density Functional Theory (QSDFT) [46].
Data Analysis:
- The gravimetric uptake is plotted against pressure to create the adsorption isotherm.
- The total pore volume is estimated from the amount adsorbed at a relative pressure close to saturation (P/P₀ ≈ 0.99).
- The specific surface area is calculated from the N₂ isotherm using the Brunauer-Emmett-Teller (BET) method.
- Pore size contributions can be decoupled by preparing a series of ACs with controlled pore sizes and correlating their textural properties with CH₄ uptake at different pressures [46].
Physisorption in Humidity Control
Humidity control relies on the physisorption of water vapor onto hydrophilic solid surfaces. The performance of humidity sensors and desiccant materials is directly governed by this phenomenon, with material properties such as hydrophilicity and specific surface area being paramount [47].
Case Study: Flexible Resistive Humidity Sensors
Flexible humidity sensors are pivotal components for the Internet of Things (IoT), healthcare monitoring, and smart agriculture. Their working mechanism is based on the physisorption of water molecules onto a humidity-sensitive layer, which induces a measurable change in electrical resistance or capacitance [47].
Material Selection and Performance:
- Polymers: Amine-terminated polyamide-amine (PAMAM) dendrimer-gold nanoparticle composites coated on PET substrates have demonstrated response times of 40 s and recovery times of 50 s across a 30–90% relative humidity (RH) range [47].
- 2D Materials: MXenes and graphene oxide (GO) are highly promising due to their high specific surface area and tunable surface chemistry, which can be functionalized with hydrophilic groups (e.g., -OH, -COOH) to enhance water molecule capture [47].
- Metal Oxides & Carbon Materials: ZnO and carbon nanotubes (CNTs) are also explored, often forming composites with polymers to improve sensitivity and response time [47].
Experimental Protocol: Fabrication and Testing of a Flexible Humidity Sensor
Objective: To fabricate a flexible impedance-type humidity sensor and characterize its sensitivity, response, and recovery times.
Materials and Equipment:
- Flexible Substrate: Polyethylene terephthalate (PET), polyimide (PI), or polydimethylsiloxane (PDMS) [47].
- Humidity-Sensitive Material: A solution of the sensing material (e.g., PAMAM dendrimer composite, GO dispersion, polymer film) [47].
- Electrodes: Silver paste or pre-fabricated interdigitated electrodes (IDEs).
- Fabrication Tools: Screen printer, spray coater, or spin coater.
- Test Equipment: Climate chamber with precise RH and temperature control, LCR meter or source meter, ultramicrobalance [47] [48].
Procedure:
- Substrate Preparation: Clean the flexible substrate (e.g., PET film) with ethanol and deionized water, then dry.
- Electrode Patterning: Screen-print silver paste interdigitated electrodes onto the substrate, or use pre-fabricated IDEs [47].
- Sensitive Layer Deposition: Deposit the humidity-sensitive material (e.g., G1-NH₂-AuNPs composite) onto the electrode area using drop-casting, spin-coating, or spraying. The film is then dried at a moderate temperature (e.g., 50°C) to remove solvents [47].
- Curing: The assembled sensor is fully cured according to the material's requirements.
- Sensor Characterization:
- Place the sensor in a climate chamber with controlled RH.
- Measure the electrical resistance (or impedance/capacitance) of the sensor while varying the RH in steps from low (e.g., 30% RH) to high (e.g., 90% RH) and back down.
- At each RH step, allow the system to stabilize before recording the reading.
- For dynamic performance, expose the sensor to a rapid pulse of humid or dry air and record the time taken for the signal to change by a certain percentage (e.g., 63%) for response and recovery times [47].
Data Analysis:
- Plot sensor resistance (or capacitance) as a function of RH to obtain the sensitivity curve.
- Calculate sensitivity as the change in signal per unit change in RH (e.g., ΔR/%RH or ΔC/%RH).
- Response time is defined as the time required for the sensor's signal to change from 10% to 90% of its final value when RH is increased. Recovery time is the reverse process when RH is decreased [47].
Physisorption in Vacuum Generation
In vacuum technology, the physisorption of gas molecules on solid surfaces within the vacuum chamber is a key mechanism for achieving and maintaining low pressures. This principle is exploited in sorption pumps and cryopumps, where cooling a large surface area of an adsorbent like activated charcoal or a molecular sieve traps gas molecules, thereby reducing the pressure.
Managing Water Vapor in Vacuum Systems
A critical challenge in vacuum generation is handling water vapor and other condensable gases. Rotary vane and plunger pumps require a gas ballast to prevent the condensation of water vapor during compression. The gas ballast introduces a controlled amount of dry air into the pump's compression chamber, diluting the vapor and ensuring its partial pressure remains below the saturation point at the exhaust temperature, allowing it to be expelled without condensing into a liquid that could contaminate the pump oil [49].
The effectiveness of this process depends on the relationship between the vapor's saturation pressure and the total pressure in the pump. Vapors can be pumped without condensation if the partial pressure of the vapor in the pump's exhaust phase is lower than its saturation pressure at the exhaust temperature [49].
Experimental Protocol: Measuring Water Uptake for Hygroscopicity Assessment
Objective: To determine the water uptake capacity of materials (e.g., desiccants or aerosol particles) at high relative humidity, relevant to vacuum system performance.
Materials and Equipment:
- Sample Material: Particles collected on a Teflon filter or a solid desiccant [48].
- Constant-Humidity Solutions (CHS): Saturated salt solutions (e.g., KCl for ~84% RH, BaCl₂ for ~90% RH, K₂SO₄ for ~97% RH) [48].
- Containers: Small, sealed chambers to house the CHS and maintain constant RH.
- Balance: Ultramicrobalance with a resolution of 0.001 mg or better [48].
- Pouches: Aluminum pouches to hold filter samples and minimize water loss during weighing [48].
Procedure:
- Sample Preparation: Weigh a dry, blank Teflon filter and its aluminum pouch using the ultramicrobalance. This is the dry blank mass.
- Loading: Load the sample material (e.g., aerosol particles) onto the filter. Weigh the loaded filter in its pouch. This is the dry loaded mass.
- Humidity Exposure: Place the open pouches containing the dry blank and dry loaded filters into separate RH-controlled chambers (with different CHS for different RH levels). Seal the chambers and allow them to equilibrate for more than 24 hours [48].
- Wet Measurement: Quickly transfer the pouches from the chambers and seal them. Weigh the sealed pouches to obtain the wet blank and wet loaded masses.
- Calculation: The net mass of water absorbed by the sample is calculated as: Mass_water = (wet_loaded - dry_loaded) - (wet_blank - dry_blank) [48].
Data Analysis:
- Key hygroscopicity parameters can be calculated, including the water-to-solute ratio and growth factor.
- This methodology is accurate for RH levels up to 97% and allows for linking water uptake with material composition [48].
The Scientist's Toolkit: Essential Research Reagents and Materials
The experimental study of physisorption requires a suite of specialized materials and instruments. The following table details key solutions for researchers in this field.
Table 3: Essential Research Reagents and Materials for Physisorption Studies
| Item | Primary Function | Common Examples & Specifications |
|---|---|---|
| Porous Adsorbents | Provide high surface area for molecular adsorption. | Zeolite 13X [50], Activated Carbons (ACs) [46], Metal-Organic Frameworks (MOFs) [45] [46], Graphene Oxide (GO) [51]. |
| Analytical Gases | Serve as the adsorbate for capacity and selectivity measurements. | High-purity N₂ (for surface area analysis), CH₄, CO₂ [46], and other target gases (99.99% purity or higher). |
| Physisorption Analyzer | Measures the quantity of gas adsorbed as a function of pressure at constant temperature. | Volumetric or gravimetric analyzers (e.g., from Micromeritics, Quantachrome Instruments, Belsorp) [13]. |
| Flexible Substrates | Serve as a mechanically robust, bendable base for sensor fabrication. | Polyethylene terephthalate (PET), Polyimide (PI), Polydimethylsiloxane (PDMS) [47]. |
| Humidity-Sensitive Materials | Undergo measurable electrical change upon water vapor physisorption. | Polyamide-amine (PAMAM) dendrimers [47], MXenes [47], Graphene Oxide [47], cross-linked polymer films [47]. |
| Constant-Humidity Solutions | Generate and maintain precise relative humidity levels for calibration and testing. | Saturated salt solutions: KCl (~84% RH), BaCl₂ (~90% RH), K₂SO₄ (~97% RH) [48]. |
Physisorption is a versatile and powerful phenomenon underpinning critical technologies across multiple disciplines. Its reversible, weak interactions enable efficient gas separation processes like Direct Air Capture and methane storage, where material design is paramount [50] [46]. In humidity sensing, the physisorption of water molecules drives the operation of next-generation flexible electronics for healthcare and environmental monitoring [47]. Furthermore, the principles of physisorption are fundamental to managing vapor loads and generating vacuum in industrial processes [49]. The experimental protocols and data outlined in this guide provide a foundation for researchers and engineers to quantitatively analyze and apply physisorption across this diverse spectrum of applications, from foundational material characterization to cutting-edge technological development.
Heterogeneous catalysis is a fundamental process where the catalyst exists in a different phase than the reactants, typically involving solid catalysts and gas-phase reactants [52]. This process is vital to modern industry, influencing approximately 35% of the world's GDP and assisting in the production of 90% of chemicals by volume [52]. At the heart of heterogeneous catalysis lies adsorption, the essential process where gas or liquid molecules bind to solid surface atoms [52]. The nature of this binding differentiates two primary adsorption types: physisorption (physical adsorption) and chemisorption (chemical adsorption). Understanding their distinct characteristics is crucial for elucidating catalytic mechanisms and diagnosing catalyst deactivation phenomena such as catalyst poisoning.
The following table summarizes the core differences between these two adsorption processes, which form the theoretical foundation for understanding subsequent catalytic and poisoning mechanisms.
Table 1: Fundamental Characteristics of Physisorption and Chemisorption
| Characteristic | Physisorption | Chemisorption |
|---|---|---|
| Forces Involved | Weak van der Waals forces [52] [21] | Strong chemical bonds [52] [21] |
| Enthalpy of Adsorption | Low (3–10 kcal/mol or 20–40 kJ/mol) [52] [21] | High (20–100 kcal/mol or 80–240 kJ/mol) [52] [21] |
| Specificity | Non-specific [21] | Highly specific [21] |
| Nature | Reversible [21] | Often irreversible [21] |
| Temperature Dependence | Favors low temperature, decreases with increasing temperature [21] | Favors high temperature, often increases with temperature [21] |
| Resulting Layer | Multimolecular layer [21] | Unimolecular layer [21] |
| Activation Energy | Low or none [21] | Significant [21] |
The potential energy diagram below illustrates the energetic pathway for an adsorbate molecule approaching a surface, highlighting the precursor state of physisorption and the activated process of chemisorption.
Diagram 1: Adsorption potential energy diagram showing physisorption and chemisorption paths.
The Role of Chemisorption in Heterogeneous Catalysis
Mechanism of Catalytic Action
In heterogeneous catalysis, chemisorption is not merely binding but an activating process. It weakens or breaks bonds within reactant molecules, facilitating their transformation into products [53]. For instance, when H₂ gas chemisorbs on a metal surface, it often undergoes dissociative adsorption, breaking the H-H bond and creating two adsorbed H atoms that are highly reactive [52]. The catalytic cycle generally follows these steps [52] [53]:
- Diffusion: Reactant molecules move from the bulk fluid phase to the catalyst surface.
- Adsorption: Reactants are chemically adsorbed onto active sites.
- Surface Reaction: The adsorbed reactants undergo chemical reaction, often via catalytic intermediates.
- Desorption: Product molecules leave the active sites.
- Diffusion: Products diffuse away from the catalyst surface.
Surface Reaction Mechanisms
Two primary mechanisms describe reactions on surfaces:
- Langmuir-Hinshelwood Mechanism: Both reactants adsorb onto the catalytic surface adjacent to each other and then combine to form the product, which subsequently desorbs [52]. This is the most common mechanism for heterogeneously catalyzed reactions [52].
- Eley-Rideal Mechanism: One reactant adsorbs onto the surface, and the other reacts directly with it from the gas or liquid phase without adsorbing first [52].
The diagram below illustrates the sequential steps of a heterogeneously catalyzed reaction, incorporating these mechanisms.
Diagram 2: Sequential steps in a heterogeneous catalytic reaction.
The Scientist's Toolkit: Key Research Reagent Solutions
The experimental study and industrial application of chemisorption and heterogeneous catalysis rely on several critical materials and reagents.
Table 2: Essential Reagents and Materials in Heterogeneous Catalysis Research
| Reagent/Material | Function | Example Use Case |
|---|---|---|
| Precious Metal Catalysts (Pt, Pd, Rh) | Provide active sites for adsorption and reaction; high electron density and surface reactivity [54]. | Automobile catalytic converters, hydrogenation reactions [54]. |
| Metal Oxide Catalysts (Fe, V₂O₅, Ni) | Often lower-cost alternatives; provide active sites or support for active metals [52] [53]. | Haber process (Fe), Contact Process (V₂O₅), Steam Reforming (Ni) [52] [53]. |
| Porous Supports (Alumina, Silica, Zeolites) | Maximize catalyst surface area; provide stability and dispersion for active metal sites [52]. | Supporting Co-Pd catalysts for CO hydrogenation [55]. |
| Promoters (Al₂O₃, K₂O) | Substances added to improve catalyst activity, selectivity, or stability [52]. | Al₂O₃ added to Fe-catalyst in ammonia synthesis to slow sintering [52]. |
| Common Poison Analysts (H₂S, CO, Pb, S) | Used in controlled studies to understand deactivation mechanisms and develop resistant catalysts [56] [57]. | Studying sulfur tolerance in hydrodesulfurization catalysts [56]. |
Catalyst Poisoning: The Dark Side of Chemisorption
Definition and Fundamental Mechanisms
Catalyst poisoning is the partial or total deactivation of a catalyst caused by the strong, undesirable chemisorption of a chemical compound onto its active sites [56] [54]. These poisons bind to the active sites more strongly than the reactant molecules, blocking access and preventing the catalytic cycle from proceeding [56] [57]. The fundamental cause is the chemical interaction between a component in the feed or product stream and the catalyst's active sites [57]. The severity of poisoning is positively correlated with exposure time [57].
The schematic below illustrates how poison molecules disable a catalyst's active sites.
Diagram 3: Poison molecules block active sites, preventing reactant adsorption.
Classification and Impact of Poisons
Catalyst poisons can be categorized by their chemical nature and the permanence of their effect.
Table 3: Common Catalyst Poisons and Their Effects
| Poison Category | Specific Examples | Mechanism & Impact |
|---|---|---|
| Group V, VI, VII Elements | N, P, O, S, Se, Cl [52] [57] | Poison metal catalysts via interaction with their "s" and "p" orbitals [57]. The effect can depend on oxidation state (e.g., H₂S is a stronger poison than SO₄²⁻) [57]. |
| Toxic Heavy Metals | Pb, Hg, Cd, As [52] [57] | Form strong, often irreversible compounds or alloys with active metal sites [52] [54]. E.g., Lead from leaded fuel poisons automotive catalytic converters [56]. |
| Specific Molecules | CO, unsaturated hydrocarbons [52] [57] | Strongly chemisorb to active sites via multiple bonds [52]. E.g., CO poisons Pt-based PEM fuel cell catalysts even at 10 ppm levels [57]. |
Poisoning can also be classified based on the strength of the poison-catalyst interaction:
- Reversible (Temporary) Poisoning: The poison is weakly chemisorbed and can be removed by specific regeneration processes (e.g., high-temperature oxidation for some sulfur poisons), restoring catalyst activity [57] [54].
- Irreversible (Permanent) Poisoning: The poison forms an extremely strong chemical bond with the active site, making regeneration impractical and necessitating catalyst replacement [57] [54].
- Selective Poisoning: The poison deactivates only certain types of active sites, potentially improving selectivity for a desired intermediate product. Lindlar's catalyst (Pd poisoned with Pb) is intentionally poisoned to halt hydrogenation at the alkene stage instead of the alkane [56].
Experimental Protocols and Analytical Approaches
Quantifying Adsorption: The Tamoxifen Case Study
A recent study on the adsorption of the pharmaceutical contaminant tamoxifen onto calcined bone char provides a detailed experimental protocol for studying chemisorption [58].
1. Adsorbent Preparation (Calcined Bone Char):
- Source Material: Cattle leg bones.
- Pre-treatment: Boil to remove fat and tissues, followed by deproteinization in acetone for 24 hours.
- Processing: Dry at 100°C, grind into a fine powder using a ball mill.
- Calcination: Heat in a nitrogen atmosphere at 700°C for 2 hours (5°C/min ramp rate). Sieve through a 40-mesh sieve for uniformity [58].
2. Material Characterization:
- Surface Area (BET Method): Analyze using a Micromeritics Gemini 2360 analyzer with high-purity N₂ as the adsorbate gas. Pre-degas samples at 250°C [58].
- Surface Morphology (SEM): Examine using a LEO 1430 VP model instrument.
- Point of Zero Charge (pHpZc): Determine by adding 0.050 g of adsorbent to 50 mL of 0.1 M NaCl solutions with initial pH (pHi) values from 2-12. Agitate for 24 hours at 25°C, then measure final pH (pHf). Plot ΔpH (pHf - pHi) vs. pHi to find the pHpZc [58].
3. Batch Adsorption Experiments:
- Procedure: Conduct experiments in an orbital shaker (180 rpm, 25 ± 1°C). Use 50 mL of tamoxifen solution. Filter solutions post-reaction through a 0.45 μm syringe filter before analysis [58].
- Variable Analysis:
- Adsorbent Dose: 10, 15, 20, 25, and 30 mg per 50 mL of 40 mg/L tamoxifen solution.
- Initial Concentration: 20, 30, 40, 50, 60, and 100 mg/L.
- pH: Values of 4, 7, and 10.
- Temperature & Contact Time: Varied to study kinetics and thermodynamics [58].
- Analysis: Determine residual tamoxifen concentration (Ce) using HPLC [58].
4. Data Modeling to Confirm Chemisorption:
- Isotherm Modeling: The Langmuir model (R² = 0.9900) provided the best fit, supporting monolayer, homogeneous surface adsorption [58].
- Kinetic Modeling: The pseudo-second-order kinetic model (R² = 0.9997) best described the adsorption kinetics, indicating that chemisorption was the dominant mechanism [58].
Differentiating Physisorption and Chemisorption Experimentally
Researchers can use the following criteria, derived from fundamental principles and experimental observations, to distinguish between the two adsorption types in practice.
Table 4: Experimental Differentiation Between Physisorption and Chemisorption
| Experimental Observation | Indicates Physisorption | Indicates Chemisorption |
|---|---|---|
| Enthalpy of Adsorption (ΔH) | Low (≈20-40 kJ/mol) [21] | High (≈80-240 kJ/mol) [21] |
| Temperature Effect | Amount adsorbed decreases with temperature [21] | Amount adsorbed may increase with temperature (activated process) [21] |
| Reversibility | Fully reversible upon pressure reduction [21] | Often irreversible under mild conditions [21] |
| Layer Formation | Multilayers can form [21] | Only a monolayer forms [21] |
| Kinetic Model Fit | Pseudo-first-order kinetics may apply | Pseudo-second-order kinetics often applies [58] |
| Spectroscopic Evidence | Minimal perturbation of adsorbate electronic structure (e.g., slight peak shift in IR) [52] [4] | Formation of new chemical bonds observable (e.g., new peaks or significant shifts in IR/XPS) [52] [4] |
Applications, Implications, and Mitigation Strategies
Industrial Relevance and Economic Impact
The principles of chemisorption and catalyst poisoning have profound implications across the chemical, energy, and environmental sectors. Key applications include:
- Chemical Production: The Haber process for ammonia synthesis uses an iron catalyst where chemisorption dissociates N₂ and H₂, enabling reaction. Promoters like Al₂O₃ are added to mitigate poisoning and sintering [52] [53].
- Environmental Protection: Automotive catalytic converters use platinum, palladium, and rhodium to chemisorb and convert CO, NOₓ, and unburned hydrocarbons into harmless gases. This system is highly susceptible to poisoning by lead, sulfur, and phosphorus [56] [54].
- Energy Sector: Proton Exchange Membrane (PEM) fuel cells use platinum catalysts that are extremely sensitive to CO poisoning, with concentrations as low as 10 ppm sufficient to block active sites [57].
Catalyst deactivation, including poisoning, costs industries billions of dollars annually due to process shutdowns and catalyst replacement [52].
Strategies for Mitigating Catalyst Poisoning
Managing catalyst poisoning is critical for sustainable industrial operations. Strategies include:
- Feedstock Purification: Removing potential poisons before they reach the reactor is the most common strategy. Hydrodesulfurization converts sulfur compounds to H₂S, which is then adsorbed on a ZnO guard bed [57].
- Catalyst Formulation: Developing poison-tolerant catalysts. For example, using vanadium(V) oxide instead of platinum in the Contact Process for sulfuric acid production avoids arsenic poisoning [53]. In PEM fuel cells, Pt/Ru bimetallic catalysts increase CO tolerance [57].
- Process Optimization: Operating at high temperatures (e.g., >1273 K in catalytic combustion) can prevent the adsorption of certain poisons like sulfur and halogens [57].
- Intentional Poisoning for Selectivity: In specific cases, controlled poisoning is used to improve selectivity, as in the Lindlar catalyst (Pd poisoned with Pb) for the partial hydrogenation of alkynes to alkenes [56].
Chemisorption is the cornerstone of heterogeneous catalysis, enabling countless industrial processes by activating reactants on catalyst surfaces. However, this same strong, specific binding is also the mechanism behind catalyst poisoning, a major challenge that leads to significant economic losses. The distinction between chemisorption and physisorption—based on enthalpy, reversibility, and specificity—is therefore fundamental to both applying and preserving catalytic activity. Ongoing research focused on understanding surface interactions at the molecular level, developing poison-resistant catalyst formulations, and implementing effective feedstock purification and regeneration protocols continues to be essential for advancing catalytic science and technology.
Adsorption, the accumulation of molecular species at the surface of a solid or liquid, is a fundamental interfacial phenomenon critical to numerous modern technologies. This process is categorized into two distinct mechanisms with different characteristics and applications: physisorption (physical adsorption) and chemisorption (chemical adsorption). Physisorption arises from weak, non-specific van der Waals forces with low adsorption enthalpy (typically 20–40 kJ/mol), is reversible, and can form multiple molecular layers. In contrast, chemisorption involves the formation of strong chemical bonds with high adsorption enthalpy (typically 80–800 kJ/mol), is often irreversible, and is limited to a single, monomolecular layer due to the specific chemical interaction required between the adsorbate and adsorbent [4] [59] [21].
The distinction between these mechanisms is not merely academic; it directly informs the design and optimization of materials for advanced applications. As global challenges such as climate change, environmental pollution, and the need for advanced medical therapies intensify, harnessing and controlling these adsorption processes has become increasingly important. This whitepaper explores how the principles of physisorption and chemisorption underpin cutting-edge technologies in carbon capture, environmental remediation, and drug delivery systems, providing a technical guide for researchers and professionals developing next-generation solutions.
Table 1: Fundamental Characteristics of Physisorption and Chemisorption
| Characteristic | Physisorption | Chemisorption |
|---|---|---|
| Binding Forces | Weak van der Waals forces | Strong chemical bonds |
| Enthalpy (kJ/mol) | Low (20 - 40) | High (80 - 800) |
| Reversibility | Reversible | Often Irreversible |
| Temperature Preference | Favors low temperature | Favors high temperature |
| Specificity | Non-specific | Highly specific |
| Layer Formation | Multilayer possible | Monolayer only |
| Activation Energy | Low | Can be high |
Physisorption and Chemisorption in CO2 Capture
Carbon capture, utilization, and storage (CCUS) is a critical climate change mitigation strategy, and adsorption-based technologies are at its forefront. The selection between physisorbents and chemisorbents is dictated by the CO2 concentration, process temperature, and energy requirements for sorbent regeneration.
Physisorption-Based Capture with Advanced Solid Sorbents
Physisorption is leveraged for CO2 capture primarily through porous solid sorbents with exceptionally high surface areas. The process is driven by the concentration or partial pressure of CO2 and is easily reversed by reducing pressure (Pressure Swing Adsorption - PSA) or increasing temperature (Temperature Swing Adsorption - TSA) [59] [60]. Key material classes include:
- Metal-Organic Frameworks (MOFs): Crystalline, porous materials with tunable pore chemistry and ultra-high surface areas, allowing for high CO2 capacity and selectivity [61] [60].
- Porous Carbons: Materials like activated carbon, carbon nanotubes, and nanostructured graphite are valued for their large surface area, thermal stability, and low cost. Their performance is highly dependent on pore size distribution [62] [61].
- Zeolites: Crystalline aluminosilicates with well-defined, uniform pore structures that act as molecular sieves, selectively adsorbing CO2 based on molecule size and polarity [59] [61].
A prominent emerging application is Moisture-Swing Adsorption (MSA), a novel physisorption-based approach for Direct Air Capture (DAC). Certain materials, such as activated carbon and metal oxides (e.g., aluminum oxide, iron oxide), capture CO2 at low humidity and release it when exposed to high humidity. This method significantly reduces the energy penalty associated with traditional temperature or pressure swings, as it leverages natural humidity cycles [62].
Chemisorption-Based Capture with Functionalized Materials
Chemisorption is employed for CO2 capture in scenarios requiring high selectivity and strong binding, particularly in low-concentration environments like ambient air. This typically involves amine-functionalized sorbents where amines (e.g., monoethanolamine - MEA) chemically react with CO2 to form stable carbamates or bicarbonates [63] [61].
- Amine-Grafted Solids: Amine-containing molecules are chemically anchored to the surface of porous supports (e.g., silica, polymers, MOFs). This combines the high selectivity of chemisorption with the high surface area of a solid substrate [61].
- Layered Double Hydroxides (LDHs): These materials capture CO2 via chemical adsorption and are particularly useful in intermediate-temperature applications [61].
- Advanced Liquid Sorbents: While aqueous amine solutions are the benchmark for point-source capture, research is advancing towards more efficient systems, including amino acid-based solvents and guanidine-based systems, which offer lower regeneration energy and greater stability [61].
Table 2: Selected Nanomaterials for Direct Air Capture (DAC) of CO2 [62] [61]
| Material Class | Example Materials | Key Characteristics | Primary Adsorption Mechanism |
|---|---|---|---|
| Carbonaceous | Activated Carbon, Nanostructured Graphite, Carbon Nanotubes | Fast kinetics, cost-effective, performance linked to pore size (50-150 Å). | Primarily Physisorption |
| Metal Oxides | Aluminum Oxide (AlOx), Iron Oxide (FeOx), Manganese Oxide (MnOx) | High capacity, abundant, suitable for moisture-swing cycles. | Physisorption/Chemisorption |
| Amine-Functionalized | Amine-impregnated polymers or porous silica | High selectivity for CO2, strong binding, requires thermal regeneration. | Primarily Chemisorption |
| Metal-Organic Frameworks (MOFs) | Various structures (e.g., with open metal sites) | Tunable pore chemistry, very high surface area, can be functionalized. | Physisorption or Chemisorption |
Experimental Protocol: Evaluating Solid Sorbents for CO2 Capture
Title: Determination of CO2 Adsorption Capacity and Kinetics of Porous Sorbents.
Principle: This protocol uses a volumetric (manometric) method to measure the quantity of CO2 gas adsorbed by a solid sorbent material at a constant temperature and over a range of pressures, generating an adsorption isotherm [27].
Materials and Equipment:
- Test Apparatus: Automated gas sorption analyzer (e.g., static volumetric system).
- Sorbent Sample: Powdered or pelletized material (e.g., MOF, activated carbon, zeolite).
- Gases: High-purity CO2 (adsorptive) and High-purity He (for dead volume calibration).
- Sample Cell: A calibrated, temperature-stable vessel to hold the sorbent.
- Thermostat: For maintaining a constant temperature (e.g., 0°C for physisorption, 25-50°C for chemisorption).
- Vacuum System: For degassing the sample prior to analysis.
Procedure:
- Sample Preparation: A precise mass (e.g., 100-500 mg) of the sorbent is loaded into a clean, dry sample cell.
- Degassing: The sample is heated under vacuum (e.g., 150°C for 12 hours) to remove any pre-adsorbed contaminants (water vapor, gases).
- System Calibration: The sample cell is inserted into the analysis station, and the system's "dead volume" (free space) is calibrated using helium gas.
- Isotherm Measurement: a. The analysis station is thermostatted to the desired temperature. b. A known dose of CO2 gas is introduced into the sample cell. c. The system monitors pressure until equilibrium is established. d. The quantity of gas adsorbed is calculated from the pressure drop. e. Steps b-d are repeated, incrementing the pressure for each step, until the target maximum pressure is reached.
- Data Analysis: The total gas uptake is plotted versus equilibrium pressure to generate the adsorption isotherm. Models like Langmuir or Freundlich can be fitted to determine monolayer capacity and binding energy.
Adsorption in Environmental Remediation
Environmental remediation relies heavily on adsorption for the purification of air and water by removing contaminants. The choice between physisorption and chemisorption depends on the nature of the pollutant and the desired permanence of its removal.
Physisorption for Waste Gas Purification and Water Treatment
Physisorption is the workhorse mechanism for the non-specific removal of a wide range of pollutants. Its reversibility is key to regenerative processes like Temperature Swing Adsorption (TSA) and Pressure Swing Adsorption (PSA), which are used for gas separation and purification [59].
- Activated Carbon: The most common adsorbent, used for removing organic contaminants (e.g., solvent vapors, hydrocarbons), odorous compounds, and certain heavy metals from gases and liquids due to its vast, amorphous surface area [59].
- Zeolites and Molecular Sieves: These materials are employed for selective removal based on molecular size and polarity, such as drying gases (removing H2O) or capturing specific small molecules like hydrogen sulfide (H2S) from biogas [59].
Chemisorption for Targeted Contaminant Removal
Chemisorption is applied when irreversible binding or specific chemical destruction of a pollutant is required.
- Removal of Acidic Gases: Chemisorbents like calcium oxide (CaO) can permanently capture acidic gases like SO2 and CO2 by forming stable salts (e.g., CaSO4, CaCO3) [63].
- Catalytic Converters: A prime example of chemisorption in action. Precious metals (Pt, Pd, Rh) in automotive catalysts chemisorb pollutant molecules like CO, NOx, and unburned hydrocarbons, facilitating their chemical conversion into less harmful substances like CO2, N2, and H2O [27].
- Heavy Metal Capture: Functionalized surfaces with thiol (-SH) or amino (-NH2) groups can form strong coordinate covalent bonds with heavy metal ions (e.g., Pb²⁺, Hg²⁺), effectively removing them from wastewater [59].
Adsorption in Drug Delivery Systems
In pharmaceutical sciences, the principles of adsorption are harnessed to design sophisticated drug delivery platforms that enhance therapeutic efficacy and reduce side effects.
Physisorption for Controlled Release
Porous materials are ideal carriers for drug molecules due to their high loading capacity, which is achieved primarily through physisorption.
- Mesoporous Silica Nanoparticles (MSNs): These feature a highly ordered pore network that can be loaded with a drug payload. The weak physisorption forces allow for a controlled, diffusion-based release of the drug at the target site [59].
- Metal-Organic Frameworks (MOFs): Bio-compatible MOFs are emerging as versatile drug carriers. Their tunable pore size and surface chemistry allow for high drug loading via physisorption and enable triggered release in response to specific physiological stimuli, such as pH changes [61].
Chemisorption for Targeted and Stimuli-Responsive Delivery
Chemisorption enables the design of more advanced, targeted delivery systems where the drug is covalently tethered to a carrier.
- Prodrug Conjugates: Drug molecules can be chemically bound (conjugated) to a polymer or nanoparticle carrier via a cleavable linker. This linkage is a form of chemisorption. The drug remains inactive until the linker is broken by a specific stimulus at the target site (e.g., a particular enzyme or a low pH environment), ensuring precise release [4].
- Functionalized Nanocarriers: The surfaces of nanocarriers can be chemically modified with targeting ligands (e.g., antibodies, peptides). These ligands specifically chemisorb to receptors overexpressed on target cells (e.g., cancer cells), enabling active targeting and improving therapeutic specificity [4].
The Scientist's Toolkit: Essential Research Reagents and Materials
The development of advanced adsorption-based technologies relies on a suite of specialized materials and reagents. The following table details key components used in the research and application of these systems.
Table 3: Key Research Reagents and Materials for Adsorption Applications
| Item | Function/Description | Example Applications |
|---|---|---|
| Metal-Organic Frameworks (MOFs) | Crystalline porous materials with ultra-high surface area and tunable chemistry. | High-capacity CO2 capture [61] [60], drug delivery carriers [61]. |
| Activated Carbon | Amorphous carbon with a highly porous structure and very large specific surface area. | General-purpose adsorbent for water and air purification [59], physisorption of gases [62]. |
| Amino-based Sorbents (e.g., MEA) | Molecules containing amine groups (-NH2) that chemically react with CO2. | Chemisorption-based carbon capture from flue gas or air [63] [61]. |
| Zeolites | Crystalline, microporous aluminosilicates with molecular sieving properties. | Gas separation, drying, and selective adsorption in environmental remediation [59] [61]. |
| Mesoporous Silica | Silica-based materials with ordered pore structures in the 2-50 nm range. | Platform for controlled drug delivery via physisorption [59]. |
| Layered Double Hydroxides (LDHs) | Ionic lamellar solids with high anion exchange capacity. | Intermediate-temperature CO2 chemisorption [61]. |
| Porous Polymers | Organic polymers with permanent porosity, such as Porous Organic Polymers (POPs). | Tunable platforms for gas storage and separation [60]. |
| Ionic Liquids | Salts in a liquid state below 100°C with low volatility and tunable properties. | Used as neat liquids or supported on solids for selective CO2 capture [61]. |
The distinction between physisorption and chemisorption is a cornerstone of modern material science and chemical engineering, directly enabling a new generation of technologies aimed at addressing global challenges. Physisorption, with its reversible, multi-layer nature, is ideal for high-capacity, cyclic processes like carbon capture using MOFs or porous carbons and for the controlled release of drugs from nanocarriers. Chemisorption, characterized by its strong, specific, and often irreversible bonds, is indispensable for selective capture in ultra-dilute environments, permanent contaminant immobilization, and the creation of smart, stimuli-responsive drug delivery systems.
The future of these fields lies in the intelligent integration of both mechanisms. The development of hybrid materials that combine the high capacity of physisorbents with the robust selectivity of chemisorbents represents a key research frontier. Furthermore, reducing the energy penalty of sorbent regeneration in carbon capture, enhancing the specificity and biocompatibility of drug carriers, and scaling up the production of advanced nanomaterials like MOFs are critical challenges that must be overcome. As our understanding of interfacial phenomena deepens and our ability to engineer matter at the nanoscale advances, adsorption-based technologies will undoubtedly play an increasingly vital role in building a sustainable and healthy future.
Strategies for Enhancing Adsorption Efficiency and Process Design
The selective removal of molecules from a fluid phase onto a solid surface, known as adsorption, is a fundamental process critical to numerous scientific and industrial applications, from drug delivery and hydrogen storage to environmental remediation. The efficacy of any adsorption-based technology hinges on selecting the appropriate process—physical adsorption (physisorption) or chemical adsorption (chemisorption)—based on the specific needs of the application. Physical adsorption is characterized by weak, nonspecific van der Waals forces between the adsorbate and the adsorbent, resulting in low enthalpy changes (typically 20–40 kJ/mol), facile reversibility, and a tendency to form multilayers [27] [5]. In contrast, chemical adsorption involves the formation of strong, specific chemical bonds, akin to a surface chemical reaction. This process features high enthalpy changes (80–600 kJ/mol, or more for strong covalent bonds), is often irreversible, and is limited to a monolayer [27] [5].
This guide provides a structured decision framework for researchers and development professionals to navigate this critical selection process. By integrating quantitative data, experimental protocols, and analytical techniques, we aim to bridge the gap between fundamental theory and practical application, enabling the rational design and optimization of adsorption processes for advanced technologies.
Comparative Analysis: Physisorption vs. Chemisorption
A clear understanding of the distinguishing characteristics of each adsorption type is a prerequisite for informed decision-making. The following table provides a direct comparison of their core properties.
Table 1: Key Characteristics of Physical and Chemical Adsorption
| Property | Physical Adsorption (Physisorption) | Chemical Adsorption (Chemisorption) |
|---|---|---|
| Binding Force | Weak van der Waals forces [27] [5] | Strong chemical bonds (covalent, ionic) [27] [5] |
| Enthalpy (ΔH) | Low (20 – 40 kJ/mol) [5] | High (80 – 600+ kJ/mol) [27] [5] |
| Reversibility | Highly reversible [27] [5] | Often irreversible or difficult to reverse [27] [5] |
| Temperature Dependence | Favored at low temperatures [5] | Favored at high temperatures; rate increases with temperature [5] |
| Specificity | Non-specific; occurs on all surfaces [5] | Highly specific; requires compatible adsorbent-adsorbate pairs [5] |
| Layer Formation | Multilayer formation possible [27] | Typically limited to a monolayer [27] |
| Kinetics | Usually rapid due to low energy barrier [27] | Can be slow, requiring activation energy [27] |
The practical implications of these characteristics are profound. Physisorption is ideal for applications requiring easy loading and release, such as gas storage (e.g., hydrogen or natural gas) and the removal of non-specific contaminants from water [64] [65]. Chemisorption is essential where a strong, permanent bond is needed, such as in heterogeneous catalysis, where reactant molecules must be activated on a metal surface, or in the irreversible capture of specific pharmaceutical pollutants [27] [58]. For instance, the adsorption of the cancer drug tamoxifen onto calcined bone char was found to follow a chemisorption mechanism, as determined by its conformity to the pseudo-second-order kinetic model [58].
Quantitative Data Framework for Adsorbent Performance
Selecting a process also involves evaluating the performance of potential adsorbent materials. The following table summarizes performance data for various adsorbents in different applications, highlighting how the nature of the adsorbent and the adsorbate dictates the operative mechanism and outcome.
Table 2: Performance Metrics of Selected Adsorbents in Different Applications
| Adsorbent | Adsorbate | Key Performance Metric | Identified Mechanism | Reference |
|---|---|---|---|---|
| Charged Graphene | Hydrogen (H) | Improved diffusion kinetics & limited desorption on positively charged surfaces | Chemisorption (tuned C-H bond energy via charge) [64] | [64] |
| Calcined Bone Char | Tamoxifen | Monolayer capacity: 98.30 mg/g; best fit: Langmuir isotherm & Pseudo-second-order kinetics | Chemisorption (dominant) [58] | [58] |
| Cu-doped Mil-101(Fe) | Ibuprofen (IBU) | High adsorption capacity: 497.3 mg/g | Physisorption/Chemisorption mix (e.g., π-π interactions, H-bonding) [65] | [65] |
| Albizia lebbeck Seed Pods AC | Ibuprofen (IBU) | Low adsorption capacity: 0.220 mg/g | Physisorption/Chemisorption mix [65] | [65] |
| pH/ROS-responsive Mg Scaffold | Doxorubicin | Drug loading enhanced from 508.4 ng (physical adsorption) to 793.5 ng (chemical adsorption) | Chemical Adsorption (via hydrazone bonds) [66] | [66] |
This quantitative framework reveals critical trends. First, surface modification, such as electronic doping of graphene or metal doping in MOFs, can dramatically enhance adsorbent performance and alter the adsorption mechanism [64] [65]. Second, the conformity of experimental data to established models like Langmuir isotherm and pseudo-second-order kinetics is a strong indicator of a chemisorption-dominated process, as seen with tamoxifen on bone char [58]. Finally, a direct comparison, as in the case of the magnesium scaffold, quantitatively demonstrates the superior loading capacity achievable through covalent (chemisorption) attachment compared to simple physisorption [66].
Experimental Protocols for Adsorption Analysis
A robust selection framework must be grounded in reliable experimental data. Below are detailed protocols for key experiments used to characterize adsorption processes.
Batch Adsorption Experiments for Liquid-Phase Systems
This protocol is widely used for screening adsorbents for water treatment or drug loading, as seen in the study of tamoxifen removal [58].
- Adsorbent Preparation: Synthesize and characterize the adsorbent. Key characterization includes:
- Surface Area and Porosity: Determine via Brunauer-Emmett-Teller (BET) method using N₂ as the adsorbate gas [58].
- Surface Morphology: Analyze using Scanning Electron Microscopy (SEM) [58].
- Point of Zero Charge (pHpzc): Identify the pH at which the adsorbent surface has a net neutral charge. This is critical for understanding electrostatic interactions [58].
- Solution Preparation: Prepare a stock solution of the adsorbate (e.g., a pharmaceutical). Create a series of standard solutions with varying concentrations for calibration.
- Experimental Parameter Optimization: Conduct a series of batch experiments in an orbital shaker to determine the optimal conditions. Variables include:
- pH: Adjust using 0.1 M HCl or NaOH to evaluate its effect on adsorption efficiency [58] [65].
- Adsorbent Dose: Test different masses of adsorbent per fixed volume of solution [58].
- Initial Adsorbate Concentration: Use a range of concentrations to generate adsorption isotherms [58].
- Contact Time and Temperature: Agitate at a constant speed (e.g., 180 rpm) for varying times and at different temperatures to study kinetics and thermodynamics [58].
- Sample Analysis: After the set contact time, filter the mixture to separate the adsorbent. Analyze the filtrate to determine the equilibrium concentration (Ce) of the adsorbate using a technique like High-Performance Liquid Chromatography (HPLC) [58].
- Data Modeling: Calculate the adsorption capacity at equilibrium (qe). Fit the kinetic data to models like pseudo-first-order and pseudo-second-order. Fit the isotherm data to models like Langmuir (monolayer, homogeneous) and Freundlich (heterogeneous surface) to infer the adsorption mechanism [58] [65].
Gas Chemisorption Analysis for Catalytic Surface Characterization
This protocol is essential for characterizing solid catalysts and gas storage materials, utilizing specialized instrumentation [27].
- Sample Pretreatment (Activation): Clean the catalyst surface to remove contaminants. This typically involves heating the sample under a flowing gas (e.g., helium, hydrogen, or vacuum) to a high temperature [27].
- Static Volumetric Method:
- The cleaned sample is placed in a known volume and cooled to the analysis temperature.
- Small, precise doses of the probe gas (e.g., H₂, CO, O₂) are introduced into the sample cell.
- The system pressure is monitored after each dose until equilibrium is reached.
- The quantity of gas adsorbed is calculated from the pressure drop using the ideal gas law. This process is repeated to build a high-resolution adsorption isotherm [27].
- Dynamic (Pulse) Chemisorption Method:
- After pretreatment, the sample is exposed to a carrier gas (e.g., helium) at ambient pressure.
- Small, calibrated pulses of the probe gas are injected into the carrier gas stream flowing over the sample.
- A downstream Thermal Conductivity Detector (TCD) measures the quantity of gas not adsorbed by the sample.
- The adsorbed quantity from each pulse is calculated by difference. Injections continue until the sample is saturated, revealing the total gas uptake capacity [27].
- Temperature-Programmed Desorption (TPD):
- After the sample is saturated with the probe gas, the physically adsorbed layer may be removed by flushing with an inert gas.
- The temperature of the sample is then increased linearly according to a controlled program.
- The desorption of the chemically adsorbed species is monitored, often using a mass spectrometer or TCD.
- The temperature and area of the desorption peaks provide information on the strength of adsorption (bond energy) and the quantity of active sites [27].
Diagram: Batch Adsorption Experimental Workflow
The Scientist's Toolkit: Key Reagents and Analytical Solutions
Successful adsorption research relies on a suite of specialized materials and instruments. The following table details essential components of the researcher's toolkit.
Table 3: Essential Research Reagents and Tools for Adsorption Studies
| Tool/Reagent | Function/Description | Application Example |
|---|---|---|
| Brunauer-Emmett-Teller (BET) Analyzer | Measures the specific surface area, pore volume, and pore size distribution of an adsorbent via physical adsorption of N₂ at 77 K [58] [27]. | Characterizing the high surface area of activated carbons or MOFs [65]. |
| Chemisorption Analyzer | Determines the active metal surface area, metal dispersion, and active site energy distribution via chemical adsorption of probe gases (H₂, CO, O₂) [27]. | Evaluating a supported nickel catalyst for hydrogenation reactions. |
| Temperature-Programmed Desorption (TPD) | Probes the strength and distribution of chemisorption bonds by monitoring desorption during a controlled temperature ramp [27]. | Studying the strength of hydrogen binding on charged graphene surfaces [64]. |
| Density Functional Theory (DFT) Calculations | First-principles computational method to model adsorption energies, electronic structure changes, and reaction pathways on surfaces [64] [67]. | Predicting how electronic doping weakens the C-H bond on graphene to improve hydrogen diffusion [64]. |
| Probe Molecules (H₂, CO, CO₂, N₂) | Gases used to selectively titrate specific types of active sites on a catalyst or sorbent surface during chemisorption analysis [27] [67]. | Using CO to titrate exposed surface Pt atoms on a Pt/Al₂O₃ catalyst. |
| High-Performance Liquid Chromatography (HPLC) | An analytical technique used to separate, identify, and quantify each component in a mixture. | Measuring the equilibrium concentration of tamoxifen in solution after adsorption experiments [58]. |
A Practical Decision Framework for Process Selection
Integrating the principles and data above leads to a practical, step-by-step framework for selecting between physisorption and chemisorption.
Diagram: Adsorption Process Selection Framework
This decision tree can be applied to real-world scenarios:
Scenario: Designing a Hydrogen Storage Material
- If the goal is high-capacity, reversible storage at moderate conditions, physisorption on high-surface-area materials like MOFs is preferred, but the weak binding is a limitation [64].
- If the goal is strong binding to favor ambient-temperature storage, with release managed by an external trigger, chemisorption is needed. For example, applying a positive charge to graphene can enable reversible H chemisorption by weakening the C-H bond, though the required charge levels are currently a practical challenge [64]. This falls under the "Evaluate for Chemisorption" path.
Scenario: Developing a Drug-Delivery Scaffold
- If high drug loading and rapid, passive release are sufficient, physisorption through simple adsorption may be adequate.
- If controlled, stimulus-responsive release is required to minimize systemic toxicity, chemisorption is superior. The pH-responsive magnesium scaffold, where doxorubicin was covalently attached via hydrazone bonds, demonstrated dramatically reduced premature release under physiological conditions compared to physisorption [66]. This aligns with the "Yes" path from the first question in the framework.
The selection between physical adsorption and chemisorption is a fundamental determinant of success in applications ranging from drug delivery to environmental technology. This guide has presented a comprehensive decision framework, grounded in the distinct characteristics of each process, supported by quantitative performance data, detailed experimental protocols, and a practical selection workflow. The critical insight is that there is no universally superior process; the optimal choice is dictated by the specific operational requirements of the application—specifically, the need for strong versus weak binding, reversibility, and operational temperature. By applying this structured framework, researchers and engineers can make informed, rational decisions to select and optimize the right adsorption process for their specific needs, thereby accelerating the development of more efficient and effective materials and systems.
Adsorption, the process where molecules accumulate on a solid surface, is a critical phenomenon in fields ranging from industrial catalysis to environmental remediation and pharmaceutical development. This process is broadly categorized into physisorption, driven by weak van der Waals forces, and chemisorption, characterized by the formation of stronger chemical bonds [27]. The distinction is crucial: physisorption is typically reversible, non-specific, can form multilayers, involves lower energies (usually below 80 kJ/mol), and occurs readily at lower temperatures. In contrast, chemisorption is often irreversible, highly specific, limited to a monolayer, involves higher energies (up to 800 kJ/mol), and requires higher activation temperatures [30] [27]. Understanding the factors that govern adsorption efficiency and behavior is fundamental for researchers designing catalysts, purification systems, or drug delivery mechanisms. Among these factors, temperature, pressure, and surface area play particularly influential and interconnected roles, directly impacting the kinetics, capacity, and practical feasibility of adsorption processes.
The Critical Role of Surface Area
The specific surface area (SSA) of a material is a paramount parameter, as it directly determines the number of available sites for adsorbate molecules to attach. A higher SSA generally correlates with a greater potential adsorption capacity. The most widely used technique for SSA determination is gas adsorption analysis coupled with the Brunauer-Emmett-Teller (BET) model, which calculates the area based on the quantity of adsorbate gas required to form a monolayer on the surface [68] [69].
However, accurate SSA measurement is not always straightforward. The BET method relies on the adsorbate forming a complete monolayer, which presupposes a stronger adsorbent-adsorbate interaction than the adsorbate-adsorbate interaction. This condition is not always met; for materials like iron disulfide (FeS₂), the interaction with nitrogen is so weak that it results in a Type III isotherm, making BET analysis unsuitable and yielding inaccurate SSA values [68]. In such cases, alternative methods like methylene blue (MB) liquid dye adsorption can provide more reliable SSA data, as the liquid probe molecule has a stronger affinity for the solid surface [68].
Furthermore, the choice of adsorbate itself can dramatically influence the measured surface area, especially for complex materials like biochars. Biochars often display significantly higher SSA values when measured with water vapor compared to nitrogen. This is because their surfaces contain polar functional groups (e.g., carboxylic acids) that strongly interact with water molecules, while the non-polar nitrogen molecules cannot access all adsorption sites or very small micropores [69]. Table 1 summarizes the comparative surface areas of biochars from different feedstocks, illustrating this discrepancy.
Table 1: Surface Areas of Biochars Estimated from Nitrogen and Water Vapor Adsorption
| Material | Pyrolysis Temperature (°C) | BET Surface Area (N₂) (m²/g) | BET Surface Area (H₂O) (m²/g) | Notes |
|---|---|---|---|---|
| Dairy Sludge Biochar | 450 | Not Applicable | ~200 | Negative C constant for N₂, BET model invalid [69] |
| Dairy Sludge Biochar | 600 | Not Applicable | ~120 | Negative C constant for N₂, BET model invalid [69] |
| Fruit Sludge Biochar | 300 | ~10 | ~380 | N₂ surface area much lower than H₂O surface area [69] |
| Biogas Waste Biochar | 600 | ~20 | ~150 | N₂ surface area much lower than H₂O surface area [69] |
Experimental Protocol: Surface Area Determination via BET Analysis
Objective: To determine the specific surface area of a solid adsorbent using low-temperature nitrogen adsorption and the BET method.
Materials and Equipment:
- Micromeritics 3-Flex or similar automated gas sorption analyzer [69]
- Sample tube
- High-purity nitrogen gas (adsorptive) and helium gas (for free space measurement)
- Vacuum pump and high-temperature degassing oven
Procedure:
- Sample Preparation: Weigh an appropriate mass of the sample (e.g., ~1 g for biochars) into a clean, dry sample tube [69].
- Degassing: Place the sample tube in a degassing station and subject it to high temperature (e.g., 378.15 K or 105°C) and low pressure overnight to remove any pre-adsorbed contaminants and moisture [69].
- Free Space Measurement: After degassing, cool the sample to the analysis temperature (77 K for N₂). Introduce a known amount of helium into the sample tube to measure the void volume, which is essential for accurate quantification of adsorbed gas [68].
- Isotherm Measurement: Immerse the sample tube in a liquid nitrogen bath (77 K). Introduce incremental doses of high-purity nitrogen into the sample tube and record the equilibrium pressure after each dose. The amount of gas adsorbed at each relative pressure (p/p₀) is calculated from the pressure drop [69].
- Data Analysis: Apply the collected (p/p₀, volume adsorbed) data to the linear form of the BET equation (Eq. 1) for the relative pressure range typically between 0.05 and 0.35 [69].
( \frac{p/p0}{a(1 - p/p0)} = \frac{1}{am C} + \frac{C - 1}{am C} (p/p_0) ) ... (1)
where
ais the adsorbed amount,a_mis the monolayer capacity, andCis the BET constant related to adsorption energy. - The monolayer capacity (
a_m) is obtained from the slope and intercept of the linear plot. The specific surface area (S) is then calculated using Eq. 2: ( S = \frac{am NA \omega}{m} ) ... (2) whereN_Ais Avogadro's number,ωis the cross-sectional area of one adsorbate molecule (0.162 nm² for N₂), andmis the sample mass [69].
Temperature and its Energetic Consequences
Temperature is a pivotal factor that influences both the equilibrium capacity and the kinetics of adsorption. Its effect is intrinsically linked to the energy changes during the process, which are quantified by key thermodynamic parameters: enthalpy (ΔH), entropy (ΔS), and Gibbs free energy (ΔG). These parameters are typically determined by conducting adsorption experiments at different temperatures and analyzing the data with the van't Hoff equation [30] [70].
For a process to be spontaneous, the change in Gibbs free energy (ΔG) must be negative. A negative ΔH indicates an exothermic process, which is common for most adsorption phenomena, while a negative ΔS often reflects a decrease in freedom as molecules become confined to the surface [32]. The magnitude of these parameters also provides insight into the nature of the adsorption mechanism. The activation energy (Eₐ), determined from kinetic data using the Arrhenius equation, is a key discriminator: a value between 5–40 kJ/mol suggests physisorption, governed by weak forces, while a value in the range of 40–800 kJ/mol indicates chemisorption, involving strong chemical bonds [30].
The exothermic nature of adsorption means that capacity typically decreases with increasing temperature for physisorption and many chemisorption processes. For instance, the adsorption capacity of hydroquinone on carbonate rocks decreased from 45.2 mg/g at 25°C to 34.2 mg/g at 90°C, as confirmed by its negative ΔH of -6494 J/mol [32]. However, in some cases where the adsorption rate is controlled by pore diffusion, which is accelerated by temperature, an increase in capacity with temperature may be observed. Table 2 summarizes thermodynamic parameters for various adsorption systems.
Table 2: Thermodynamic Parameters for Different Adsorption Systems
| Adsorbate | Adsorbent | Temperature Range | ΔG (kJ/mol) | ΔH (kJ/mol) | ΔS (J/mol·K) | Implied Mechanism |
|---|---|---|---|---|---|---|
| Hydroquinone | Carbonate Rock | 25–90°C | -8.3 to -8.7 | -6.5 | 6.47 | Spontaneous, Exothermic [32] |
| Palladium | Poly(m-aminobenzoic acid) | 25–55°C | - | - | - | Chemisorption (Eₐ = 61.71 kJ/mol) [30] |
| Lanaset Grey G dye | Olive-waste cake | 15–37°C | - | - | - | Physisorption (Eₐ = 32.1 kJ/mol) [30] |
| Cadmium | β-cyclodextrin polymer/chitosan | 298–323 K | - | - | - | Chemisorption (Eₐ = 65.62 kJ/mol) [30] |
Diagram 1: Thermodynamic parameter determination workflow from experimental data.
Experimental Protocol: Determining Thermodynamic Parameters
Objective: To calculate the standard Gibbs free energy (ΔG°), enthalpy (ΔH°), and entropy (ΔS°) changes for an adsorption process.
Materials and Equipment:
- Temperature-controlled shaker incubator
- Analytical instruments (e.g., UV-Vis Spectrophotometer, AAS, ICP) for concentration measurement
- Centrifuge
Procedure:
- Batch Equilibrium Experiments: Prepare a series of solutions with identical initial concentrations of the adsorbate. Add a fixed mass of adsorbent to each solution.
- Temperature Variation: Place the samples in a temperature-controlled shaker incubator and agitate at different temperatures (e.g., 298 K, 308 K, 318 K) until equilibrium is reached.
- Analysis: Separate the adsorbent from the solution (e.g., by centrifugation). Analyze the equilibrium concentration of the adsorbate in the supernatant.
- Isotherm and Constant Calculation: Fit the equilibrium data (equilibrium concentration
Cₑvs. quantity adsorbedqₑ) at each temperature to an appropriate isotherm model (e.g., Langmuir) to obtain the equilibrium constant (K). For the Langmuir model,Kis the Langmuir constant (L/mol) [32]. - Thermodynamic Calculation:
- Enthalpy (ΔH°) and Entropy (ΔS°): Use the van't Hoff equation (Eq. 3):
( \ln(K) = -\frac{\Delta H^\circ}{R} \cdot \frac{1}{T} + \frac{\Delta S^\circ}{R} ) ... (3)
Plot
ln(K)versus1/T. The slope of the linear plot is-ΔH°/Rand the intercept isΔS°/R. - Gibbs Free Energy (ΔG°): Calculate at each temperature using Eq. 4: ( \Delta G^\circ = \Delta H^\circ - T \Delta S^\circ ) ... (4) A negative ΔG° confirms spontaneity, a negative ΔH° indicates an exothermic process, and a positive ΔS° suggests an increase in disorder at the solid-solution interface [30] [32].
- Enthalpy (ΔH°) and Entropy (ΔS°): Use the van't Hoff equation (Eq. 3):
( \ln(K) = -\frac{\Delta H^\circ}{R} \cdot \frac{1}{T} + \frac{\Delta S^\circ}{R} ) ... (3)
Plot
Pressure and the Local Environment
The effect of pressure (for gases) or concentration (for liquids) on adsorption capacity is described by an adsorption isotherm. While classical models like Langmuir assume ideal gas behavior and non-interacting adsorbate molecules, real-world industrial processes often occur at high pressures where these assumptions break down.
At high pressures, the local density of gas molecules near a catalyst surface can become hundreds of times greater than in the bulk gas phase [71]. This strong accumulation means that conventional modeling methods, like Kohn-Sham density functional theory (KS-DFT), which neglect these environmental effects, can suffer from a significant "pressure gap," leading to inaccurate predictions of surface coverage and reaction kinetics [71]. For example, in CO₂ hydrogenation on copper catalysts, the inhibitory effect of CO coverage and its behavior under ultra-high pressure cannot be accurately predicted without accounting for these dense local environments [71].
To address this, advanced multiscale modeling approaches integrate quantum mechanical calculations (for bond formation) with classical density functional theory (cDFT) to evaluate gas distribution and the grand potential of the entire system. This integrated approach shows that surface composition is determined not only by chemisorption strength but also by the accessibility of surface sites and their interactions with the surrounding gas molecules, which are heavily pressure-dependent [71].
In subsurface applications like coalbed methane (CBM) recovery, accurately describing high-pressure adsorption requires distinguishing between excess adsorption (the measured amount) and absolute adsorption (the true amount adsorbed). The difference becomes pronounced at high pressures, as the volume occupied by the adsorbed phase itself becomes significant. Traditional methods that assume a constant adsorbed phase density (e.g., equal to liquid density) are often inadequate. Newer methods that account for a constant adsorbed phase volume and a pressure-dependent adsorbed phase density provide more accurate characterizations of absolute adsorption isotherms, which are crucial for resource assessment [72].
The Scientist's Toolkit: Essential Reagents and Materials
Table 3: Key Research Reagent Solutions and Materials for Adsorption Studies
| Item Name | Function/Application | Technical Notes |
|---|---|---|
| High-Purity Probe Gases (N₂, CO₂, Kr) | BET surface area and pore structure analysis. | N₂ at 77 K is standard; CO₂ at 273 K is better for ultramicropores; Kr is for very low surface area materials [72] [68] [69]. |
| Methylene Blue (MB) | Liquid-phase surface area determination. | Used for materials where N₂-BET fails (e.g., FeS₂). Correlates well with accessible surface area in aqueous environments [68]. |
| Temperature-Programmed Desorption (TPD) System | Characterizing surface energy and active site strength. | Measures temperature required to desorb a probe molecule, providing data on site heterogeneity and adsorption strength [27]. |
| Activated Carbon | A versatile, high-surface-area benchmark adsorbent. | Used in control experiments and as a model material for studying adsorption of pollutants, VOCs, and gases [30] [70]. |
| Micromeritics 3-Flex / TriStar | Automated gas sorption analyzers. | Industry-standard instruments for performing high-resolution volumetric gas adsorption measurements and BET analysis [68] [69]. |
| Langmuir and Freundlich Models | Isotherm modeling software/packages. | Essential for fitting equilibrium data to understand adsorption capacity and surface heterogeneity [32] [70]. |
Diagram 2: Interplay of temperature, pressure, and surface area on adsorption.
The factors of temperature, pressure, and surface area do not act in isolation but are deeply interconnected in determining the outcome of an adsorption process. As illustrated in Diagram 2, an increase in temperature primarily increases the kinetic energy of molecules, which can accelerate diffusion and increase the rate of adsorption, particularly for processes with high activation energies. However, for the typically exothermic adsorption process, it also reduces the equilibrium capacity. An increase in pressure (or concentration) directly increases the driving force for molecules to occupy vacant sites, thereby increasing the equilibrium loading on the surface. Finally, the surface area sets the physical upper limit for this loading by defining the total number of available sites.
Navigating these factors requires a sophisticated approach. For instance, a high-surface-area material might show excellent capacity at low temperature and high pressure, but its performance could be severely hampered in a high-temperature industrial reactor. Similarly, a catalyst designed for a gas-phase reaction must be characterized under pressure conditions that mimic the actual process to avoid the "pressure gap" identified in multiscale modeling studies [71]. The choice of analytical technique, whether BET with N₂ or H₂O, pulse chemisorption, or liquid dye adsorption, must be aligned with the material's properties and the intended application environment [68] [69].
In conclusion, optimizing adsorption for applications in drug development, catalysis, or environmental technology demands a holistic understanding of these influential factors. Researchers must move beyond simplistic models and embrace integrated experimental and computational methods that account for the complex, interdependent effects of temperature, pressure, and surface area under realistic operating conditions.
Adsorption processes are fundamental to numerous applications, from environmental remediation to drug development. However, two persistent limitations have challenged researchers and practitioners: the irreversibility of chemical adsorption and the low capacity of physical adsorption. These constraints significantly impact the efficiency, cost-effectiveness, and reusability of adsorbent materials across industrial and scientific applications. Irreversibility in chemisorption arises from the formation of strong chemical bonds, making adsorbent regeneration difficult and costly [5]. Conversely, the low capacity of physisorption stems from weak van der Waals forces that limit the amount of contaminant that can be captured per unit of adsorbent [73]. This technical guide examines these fundamental challenges within the broader context of physical versus chemical adsorption research, presenting advanced strategies and methodologies to overcome these limitations through material engineering, process optimization, and innovative hybrid approaches. By addressing these core constraints, researchers can develop more efficient, sustainable, and economically viable adsorption systems for diverse applications from water treatment to catalytic processes.
Theoretical Foundations: Physical versus Chemical Adsorption
The strategies for overcoming adsorption limitations must be grounded in a thorough understanding of the fundamental differences between physical and chemical adsorption processes. These mechanisms differ significantly in their bond strength, reversibility, temperature dependence, and specificity, which directly informs approaches to mitigating their respective limitations.
Physical adsorption (physisorption) results from relatively weak van der Waals forces between adsorbate molecules and the adsorbent surface. These nonspecific interactions typically produce adsorption energies not exceeding 80 kJ/mol, with most systems exhibiting even lower values [27] [5]. This process is characterized by its reversibility, with equilibrium quickly established between adsorption and desorption phases. Physical adsorption occurs readily at low temperatures and decreases as temperature increases, according to Le Chatelier's principle [5]. A key advantage is that physisorption is not selective, allowing all gases to be adsorbed on all solid surfaces, though gases with higher critical temperatures that liquefy more easily are generally adsorbed more readily [5]. Critically, physical adsorption can form multiple molecular layers, potentially increasing capacity, but the weak interaction forces often result in limited adsorption strength and susceptibility to environmental conditions.
Chemical adsorption (chemisorption) involves the formation of much stronger chemical bonds between adsorbate molecules and the adsorbent surface, with bond strengths ranging from 80 to 800 kJ/mol [27]. This process typically results in the formation of a surface compound through electron sharing between the adsorbate and adsorbent, creating a monomolecular layer that is difficult to reverse [5]. Unlike physisorption, chemisorption is highly specific, occurring only between certain adsorptive and adsorbent species with cleaned, chemically active surfaces [27]. The temperature dependence of chemisorption differs markedly from physisorption—adsorption capacity initially increases with temperature until reaching an optimum, after which it decreases [5]. The strong bonding in chemisorption provides excellent adsorption strength but creates significant challenges for regenerating adsorbents, as the process is largely irreversible under normal conditions.
Table 1: Fundamental Properties of Physical and Chemical Adsorption
| Property | Physical Adsorption | Chemical Adsorption |
|---|---|---|
| Bond Type | Weak van der Waals forces | Strong chemical bonds |
| Enthalpy Range | Low (20-40 kJ/mol) [5] | High (80-240 kJ/mol, up to 800 kJ/mol for C-N bonds) [27] [5] |
| Reversibility | Highly reversible [5] | Largely irreversible [5] |
| Temperature Effect | Decreases with increasing temperature [5] | Increases initially with temperature, then decreases after optimum [5] |
| Specificity | Non-selective [5] | Highly specific [27] |
| Adsorbate State | No change in state [5] | May change state due to chemical reaction [5] |
| Layers Formed | Multiple layers possible [27] | Typically monomolecular layer [27] |
Strategic Approaches to Overcoming Irreversibility in Chemisorption
The irreversibility of chemical adsorption presents a significant challenge for catalyst regeneration and adsorbent reuse in industrial processes. Several advanced strategies have emerged to address this limitation, focusing on material design, process optimization, and operational parameters.
Temperature-Programmed Desorption and Regeneration
Temperature-programmed desorption (TPD) has proven to be an indispensable analytical technique for characterizing chemisorption bonds and facilitating desorption of strongly bound molecules [27]. By carefully controlling temperature ramps in an inert gas stream, chemisorbed species can be removed from catalyst surfaces, effectively regenerating active sites. The temperature required for desorption provides valuable information about the bond strength, while the quantity desorbed reveals the number of active sites [27]. This approach enables the design of tailored regeneration protocols that balance complete contaminant removal with preservation of the adsorbent's structural integrity. For instance, in catalytic converter systems, periodic high-temperature operation facilitates the desorption of strongly bound species that would otherwise poison the catalyst surface [24].
Surface Engineering and Functionalization
Strategic modification of adsorbent surfaces provides a powerful approach to modulating chemisorption strength. By introducing specific functional groups or doping with promoter elements, researchers can tune the electron density at active sites, thereby reducing bond strength without completely sacrificing selectivity. Recent studies on metal-organic frameworks (MOFs) for catalytic hydrogenation demonstrate how careful design of metal clusters and organic linkers can optimize the binding energy of intermediates, facilitating both adsorption and subsequent release of products [74]. Similarly, in water treatment applications, surface treatment of adsorbents through various functional groups can significantly influence the strength of metal ion binding, allowing for more efficient regeneration through chemical treatments [73].
Hybrid Physical-Chemical Adsorption Systems
Developing sequential or integrated systems that leverage both physisorption and chemisorption can effectively mitigate irreversibility challenges. In such systems, an initial physical adsorption step concentrates contaminants from the bulk phase, followed by controlled transfer to specialized chemisorption sites designed for specific capture. This approach is particularly valuable in complex matrices where multiple contaminants compete for adsorption sites. The physical adsorption component can be easily regenerated through pressure swings or mild temperature increases, while the chemical adsorption component requires more intensive regeneration but handles a smaller contaminant load [74]. Research on rare-earth MOFs has demonstrated how the physical adsorption capacity for substrate molecules like DCPD and furfural significantly influences the kinetics of subsequent chemical adsorption, enabling more efficient overall process design [74].
Strategic Approaches to Enhancing Low Capacity in Physisorption
The limited capacity of physical adsorption systems represents a significant constraint in applications requiring high contaminant removal efficiencies. Enhancing capacity requires strategic approaches focused on increasing accessible surface area, optimizing pore structures, and improving adsorbent-adsorbate interactions.
Surface Area Maximization and Porosity Engineering
Creating high-surface-area materials with optimized pore architectures represents the most direct approach to enhancing physisorption capacity. Advances in material synthesis have enabled the development of adsorbents with exceptionally high specific surface areas, particularly through the creation of hierarchical pore structures containing micropores (<2 nm), mesopores (2-50 nm), and macropores (>50 nm) [73]. The quantitative relationship between pore structure and physical adsorption performance has been clearly demonstrated in metal-organic frameworks, where pore-limiting diameter (PLD), largest cavity diameter (LCD), void fraction (VF), and accessible surface area directly determine adsorption capacity [74]. Research on 1538 rare-earth MOFs revealed that LCD, PLD, and VF collectively explain over 84% of variance in physical adsorption performance, with the first principal component alone accounting for 64.657% of variance [74]. These findings provide crucial guidance for the rational design of high-capacity adsorbents.
Chemical Activation and Thermal Treatment
Chemical and thermal treatments can dramatically enhance the adsorption capacity of natural and synthetic adsorbents. A 2025 study demonstrated that combining basic activation with thermal treatment of natural clay at 750°C increased its adsorption capacity for crystal violet dye to an remarkable 1199.93 mg/g based on the Langmuir isotherm model [75]. The modification process involved initial activation with sodium carbonate solution at 75°C, followed by thermal treatment at various temperatures (350-750°C) for 4 hours [75]. This combined approach improves morphological characteristics and cation exchange capacity, creating more favorable sites for physical adsorption while potentially introducing some specific chemical interactions. Similar enhancement has been demonstrated for heavy metal removal, with cadmium adsorption capacity increasing from 43.10 to 61.81 mg/g after Na₂CO₃ activation and thermal treatment at 350°C [75].
Surface Functionalization for Enhanced Interactions
While physical adsorption primarily involves nonspecific van der Waals forces, strategic surface functionalization can enhance these interactions without creating fully irreversible chemical bonds. Introducing oxygen-containing functional groups, nitrogen functionalities, or other mildly interactive sites can strengthen physical adsorption forces while maintaining reasonable regenerability. In water treatment applications, surface functionalization of carbon-based materials, clay minerals, and agricultural waste byproducts has shown significant improvements in adsorption capacity for pharmaceutical compounds and heavy metals while allowing regeneration under appropriate conditions [73] [76]. The development of composite and magnetic biochars represents a particularly promising approach, combining enhanced surface chemistry with improved separation and recovery characteristics [76].
Table 2: Enhanced Adsorption Capacities Through Material Modification
| Adsorbent Material | Modification Method | Target Adsorbate | Capacity Enhancement | Reference |
|---|---|---|---|---|
| Natural clay | Basic activation + thermal treatment (750°C) | Crystal violet dye | 1199.93 mg/g (Langmuir model) [75] | [75] |
| Bentonite clay | Na₂CO₃ activation + calcination (450°C) | Nickel | Increased from 5.6 to 10.7 mg/g [75] | [75] |
| Bentonite clay | Na₂CO₃ activation + thermal treatment (350°C) | Cadmium | Increased from 43.10 to 61.81 mg/g [75] | [75] |
| Activated charcoal | Fixed-bed column optimization | Chromium(VI) | 66.32% removal (37.71-66.32% range) [77] | [77] |
| Rare-earth MOFs | Pore structure optimization | DCPD/Furfural | Varies by structure; 10 top performers identified [74] | [74] |
Experimental Methodologies and Protocols
Robust experimental protocols are essential for developing and validating enhanced adsorption materials. The following methodologies provide frameworks for evaluating adsorption capacity, reversibility, and regeneration potential.
Batch Adsorption Optimization Using Response Surface Methodology
The Response Surface Methodology (RSM) with Doehlert matrix design provides a systematic approach for optimizing adsorption conditions to maximize capacity while considering potential reversibility. A representative protocol for dye adsorption studies involves:
Adsorbent Preparation: Natural clay is ground, sieved to <50 μm, then activated by stirring with sodium carbonate (1.5 g in 300 mL distilled water per 30 g clay) at 75°C for 1 hour [75]. The material is filtered, washed, dried at 70°C, then thermally treated at 350-750°C for 4 hours at 5°C/min heating rate [75].
Experimental Design: Using Doehlert matrix design with three key factors: adsorbent dose (0.4-2 g/L), contact time (10-180 min), and initial concentration (20-150 mg/L) at natural pH (5.29) and room temperature (23±2°C) [75].
Batch Experiments: Conduct adsorption by adding specified adsorbent mass to 25 mL of contaminant solution in flasks agitated at 200 rpm [75].
Analysis: Measure residual contaminant concentration spectrophotometrically after predetermined contact times.
Model Validation: Assess model significance using Analysis of Variance (ANOVA) and verify optimal conditions for maximum removal efficiency [75].
This approach identified optimum conditions for crystal violet removal as adsorbent dose = 0.5 g/L, contact time = 95 min, and initial concentration = 118.8 mg/L [75].
Fixed-Bed Column Studies for Capacity and Breakthrough Analysis
Fixed-bed column studies provide critical data on adsorption performance under dynamic conditions more representative of real-world applications:
Column Setup: Pack adsorbent in PVC pipe (e.g., 24" length, 4" diameter) to specified bed heights (15 cm and 30 cm), with glass wool (2.5 cm) at both ends to ensure flow distribution and prevent adsorbent loss [77].
Operational Parameters: Evaluate effect of flow rate (30 and 40 mL/min) and initial contaminant concentration (30 and 60 mg/L for Cr(VI)) on breakthrough behavior [77].
Breakthrough Monitoring: Collect effluent samples at regular intervals and analyze contaminant concentration using Atomic Absorption Spectrophotometry at appropriate wavelengths (357.9 nm for Cr(VI)) [77].
Model Fitting: Analyze breakthrough curves using appropriate models (Yoon-Nelson, Thomas, Adam-Bohart) to predict column behavior under different operational conditions [77].
This methodology revealed that lower inflow metal concentration, reduced inflow rate, and greater bed height resulted in longer breakthrough times, indicating ability to treat larger volumes before saturation [77].
Advanced Characterization Techniques
Comprehensive adsorbent characterization provides insights into mechanisms of enhanced performance:
Structural Analysis: X-ray diffraction (XRD) to identify crystalline phases and structural changes after modification [75].
Surface Morphology: Scanning electron microscopy (SEM) with energy-dispersive X-ray spectrometry (EDX) for microstructural analysis and elemental composition [75].
Surface Chemistry: Fourier transform infrared spectroscopy (FTIR) to identify functional groups involved in adsorption mechanisms [75].
Texture Properties: N₂ sorption at 77 K to determine specific surface area (BET method), pore volume, and pore size distribution [75].
Thermal Properties: Thermogravimetric analysis (TGA) to evaluate thermal stability and decomposition patterns [75].
Surface Charge: Point of zero charge (pHpzc) determination to understand pH-dependent adsorption behavior [75].
The Scientist's Toolkit: Essential Research Reagents and Materials
Table 3: Key Research Reagents and Materials for Adsorption Studies
| Material/Reagent | Function in Adsorption Research | Application Examples |
|---|---|---|
| Natural Clay | Low-cost, abundant adsorbent support with modifiable structure and cation exchange capacity [75] | Crystal violet dye removal after basic activation and thermal treatment [75] |
| Sodium Carbonate (Na₂CO₃) | Basic activation agent for enhancing cation exchange capacity in clay materials [75] | Ion exchange in clay interlayers (Ca²⁺ by Na⁺) to improve adsorption properties [75] |
| Activated Charcoal | High-surface-area reference adsorbent for comparative performance studies [77] | Chromium(VI) removal in fixed-bed column systems [77] |
| Agricultural Waste Materials | Low-cost, sustainable adsorbents (sawdust, rice husk) with natural porosity and functional groups [77] | Heavy metal removal in fixed-bed columns; sawdust and rice husk showed 31.19-56.56% Cr(VI) removal [77] |
| Metal-Organic Frameworks (MOFs) | Tunable porous materials with high surface area and designable functionality [74] | Hydrogenation catalysis; physical adsorption of DCPD/furfural precedes chemical adsorption of H₂ [74] |
| Rare-Earth MOFs | Specialized MOF class with unique catalytic and adsorption properties [74] | Screening of 1538 structures identified top performers for DCPD/furfural adsorption [74] |
Visualization of Strategic Approaches and Experimental Workflows
Diagram 1: Integrated strategies to address irreversibility in chemisorption and low capacity in physisorption through parallel material and process optimization approaches.
Diagram 2: Comprehensive workflow for developing enhanced adsorption materials, integrating preparation, characterization, testing, and modeling stages.
The complementary challenges of irreversibility in chemisorption and low capacity in physisorption represent significant but addressable limitations in adsorption science. Through strategic material design, process optimization, and hybrid approaches, researchers can develop next-generation adsorption systems that balance capacity, regenerability, and selectivity. The integration of advanced characterization techniques with computational modeling enables rational design of adsorbents tailored to specific applications, from environmental remediation to pharmaceutical development. Future progress will likely involve increasingly sophisticated multi-functional materials that combine the advantages of physical and chemical adsorption while minimizing their respective limitations, ultimately enabling more sustainable and efficient separation processes across scientific and industrial domains.
The fundamental principle governing adsorbent performance lies in the optimization of surface properties and porosity, which are engineered based on the intended adsorption mechanism. Adsorption processes are broadly classified into physical adsorption (physisorption) and chemical adsorption (chemisorption), each with distinct characteristics and applications [27]. Physisorption arises from relatively weak, nonspecific van der Waals forces, with adsorption energies typically not exceeding 80 kJ/mole, making the process easily reversible [27]. In contrast, chemisorption involves the formation of strong chemical bonds—a surface complex—with bond strengths comparable to chemical compounds, featuring heats of adsorption that can reach 600-800 kJ/mole, rendering the process difficult to reverse [27].
This technical guide provides a comprehensive framework for optimizing adsorbents by systematically engineering their surface characteristics and porous architecture. The selection between physisorption and chemisorption principles dictates the design strategy, as physisorption depends primarily on maximizing surface area and pore volume, while chemisorption requires precise engineering of active surface sites with specific chemical reactivity [27]. The ensuing sections detail the synthesis protocols, characterization methodologies, and computational approaches necessary for advancing adsorbent materials for applications ranging from environmental remediation to drug development.
Fundamental Differences: Physisorption vs. Chemisorption
Table 1: Comparative Analysis of Physisorption and Chemisorption
| Characteristic | Physisorption | Chemisorption |
|---|---|---|
| Bonding Mechanism | Non-specific van der Waals forces [27] | Specific chemical bonds forming surface complexes [27] |
| Adsorption Energy | Typically < 80 kJ/mole [27] | 80 - 800 kJ/mole [27] |
| Reversibility | Easily reversible [27] | Difficult to reverse (often irreversible) [27] |
| Layer Formation | Multi-layer formation possible [27] | Typically limited to a single monolayer [27] |
| Selectivity | Low selectivity; occurs on all surfaces under favorable conditions [27] | High selectivity; occurs only between specific adsorptive-adsorbent pairs [27] |
| Temperature Dependence | Occurs at lower temperatures [27] | Requires higher temperatures [27] |
| Application in Analysis | Characterizes total surface area, pore volume, and pore size distribution [27] | Probes active surface sites and surface energy distribution [27] |
The operational temperature regime often serves as a practical differentiator between these mechanisms. A given surface may exhibit physisorption at lower temperatures (e.g., nitrogen at 77 K) and chemisorption at elevated temperatures (e.g., nitrogen on iron at 800 K) [27]. In catalytic applications, chemisorption represents an essential step wherein adsorbed molecules form intermediate surface complexes that demonstrate enhanced receptivity to chemical reactions [27]. The strength of this chemisorption bond critically influences catalytic efficiency; if too weak, the molecule may desorb before reacting, while excessively strong bonds can retard product release and site regeneration [27].
Engineering Surface Properties for Enhanced Adsorption
Surface Chemistry and Energy
Surface energy distribution represents a critical parameter determining adsorbent performance. The chemical composition of the surface dictates its interaction with various adsorbates through mechanisms including hydrophobic effects, electrostatic interactions, and hydrogen bonding. In protein adsorption, for instance, the process can be interpreted as a partitioning between bulk solution and a three-dimensional interphase region, where proteins are expelled from aqueous solution to the interphase by what amounts to be the hydrophobic effect [78]. The energetics of interphase dehydration substantially control adsorption because it requires more energy to displace water from the interphase of relatively hydrophilic surfaces than from the interphase of more hydrophobic counterparts [78].
Surface functionalization techniques enable precise control over these chemical interactions. For carbon-based adsorbents, introduction of oxygen-containing groups (carboxyl, hydroxyl, carbonyl) enhances hydrophilicity and cation-exchange capacity, while nitrogen-functionalization improves interactions with organic contaminants. For silica-based materials, silylation with organosilane agents creates hydrophobic surfaces favorable for organic pollutant removal. The selection of functionalization methods must align with the target adsorbate properties and the intended adsorption mechanism—physisorption versus chemisorption.
Porosity Optimization and Hierarchical Structures
Table 2: Optimization of Mesoporous Carbon Synthesis Parameters and Performance [79]
| Optimization Stage | Parameters | Optimal Conditions | Resulting Adsorption Capacity (Crystal Violet Dye) | Textural Properties |
|---|---|---|---|---|
| CCD1: Thermal Parameters | Temperature (T), Heating Rate (R), Time (t) | T = 800°C, R = 18.41°C/min, t = 60 min | 155.4 mg g⁻¹ | Not specified |
| CCD2: Chemical Composition | Sucrose Concentration (Cₛ), Silica Template Concentration (Cₜ) | Cₛ = 23% m/V, Cₜ = 17.07% m/V | 223.5 mg g⁻¹ | Surface Area: 607.8 m² g⁻¹, Pore Volume: 1.458 cm³ g⁻¹, Average Pore Size: 9.6 nm |
According to the IUPAC classification, mesoporous materials feature pores ranging from 2 to 50 nm, with pore networks being either ordered or disordered depending on the synthesis method and template employed [79]. The optimization data in Table 2 demonstrates that hierarchical mesoporous structures with high surface area and pore volume significantly enhance adsorption performance for target compounds. The template method provides superior control over pore size, carbon morphology, and reproducible porous properties compared to traditional activation methods [79]. Hard templating using rigid solids such as silica offers precisely tunable and highly defined pore networks with greater thermal stability compared to organic carbon precursors [79].
The synthesis of mesoporous carbon via hard templating involves impregnating the template with a carbon source (e.g., sucrose), followed by carbonization to create a rigid carbon matrix with an inverted pore structure, and subsequent template removal through chemical leaching [79]. This approach enables the creation of tailored porous architectures optimized for specific applications, where pore size distribution can be engineered to match the kinetic diameter of target molecules while maintaining adequate diffusion pathways.
Experimental Protocols and Methodologies
Statistically-Guided Optimization of Mesoporous Carbons
The optimization of mesoporous carbon synthesis employs a statistically-guided approach based on Response Surface Methodology (RSM) with Central Composite Design (CCD) to correlate synthesis parameters with material performance [79]. This methodology proceeds through two successive stages:
Stage 1 (CCD1) evaluates the impact of thermochemical parameters in the carbonization step: temperature (T), heating rate (R), and time (t). The experimental matrix typically includes 17 runs with variations in these parameters, conducted in duplicate to ensure statistical reliability [79]. The resulting adsorption capacities (Qe) for a model contaminant (e.g., crystal violet dye) are measured, and the data is analyzed using Analysis of Variance (ANOVA) to identify significant effects and interaction terms. A quadratic model (Equation 1) is then fitted to determine the influence of carbonization conditions on adsorption capacity [79]:
Equation 1: Quadratic Model for Adsorption Capacity [79] Qe (mg g⁻¹) = 179.596 - 0.364T - 0.457R + 1.682t - 9.858×10⁻⁶TR - 0.00142Tt - 0.209Rt + 0.000262T² + 0.7558R² + 0.0112t²
Stage 2 (CCD2) examines the effects of template concentration (Cₜ) and carbon precursor (sucrose) concentration (Cₛ) based on the optimal thermal parameters identified in CCD1 [79]. This sequential optimization approach enables identification of the most suitable conditions to produce mesoporous carbons with enhanced structural performance, ultimately leading to significantly higher adsorption capacity.
Characterization Techniques for Adsorbent Evaluation
Comprehensive characterization of optimized adsorbents requires multiple analytical techniques to elucidate structural, chemical, and morphological properties:
- Physical Adsorption Analysis: Nitrogen physisorption at 77 K reveals textural properties including specific surface area (BET method), pore volume, and pore size distribution (NLDFT or BJH methods) [79] [27].
- Chemical Adsorption Analysis: Selective chemisorption of probe molecules (e.g., CO, H₂, NH₃) characterizes active surface sites, acid-base properties, and metal dispersion [27]. Temperature-Programmed techniques (TPD, TPR, TPO) provide information on surface energy distribution and strength of adsorbate-adsorbent interactions [27].
- Structural Characterization: X-ray diffraction (XRD) identifies crystallographic phases and confirms amorphous structure formation [79]. Thermogravimetric analysis (TGA) determines thermal stability and decomposition profiles [79].
- Morphological Analysis: Scanning electron microscopy (SEM) and high-resolution transmission electron microscopy (HRTEM) reveal disordered mesoporous structures with turbostratic carbon layers and hierarchical architecture [79]. Energy-dispersive X-ray spectroscopy (EDS) and laser-induced breakdown spectroscopy (LIBS) confirm effective template removal [79].
The Scientist's Toolkit: Essential Research Reagents and Materials
Table 3: Key Research Reagents and Materials for Adsorbent Synthesis and Evaluation
| Material/Reagent | Function/Purpose | Application Notes |
|---|---|---|
| Sucrose | Carbon precursor | Wide availability and affordability; allows formation of various morphologies and textural properties [79] |
| Hydrophilic Fumed Silica (Aerosil 380) | Hard template for mesoporous structure | Provides precisely tunable pore networks; offers thermal stability and controlled porosity [79] |
| Crystal Violet Dye | Model contaminant for adsorption evaluation | Enables quantification of adsorption capacity and performance benchmarking [79] |
| Octyl Sepharose Particles | Hydrophobic adsorbent for protein studies | Used in competitive adsorption studies; models hydrophobic interaction chromatography [78] |
| Probe Molecules (CO, H₂, NH₃) | Chemisorption analysis | Characterize active surface sites, acid-base properties, and metal dispersion [27] |
Computational Approaches in Adsorption Optimization
Recent advances in computational methods have significantly enhanced the evaluation and optimization of adsorption processes. Artificial intelligence (AI) and computational fluid dynamics (CFD) provide powerful tools for modeling complex adsorption phenomena and predicting system performance [80]. A comparative examination of three AI-based regression models—Gaussian Process Regression (GPR), Multi-layer Perceptron (MLP), and Polynomial Regression (PR)—demonstrates their utility in predicting chemical concentrations of solute in datasets with multiple input variables [80].
Research findings indicate that MLP outperforms GPR and PR with significantly higher R² score (MLP: 0.999, GPR: 0.966, PR: 0.980) and lower RMSE (MLP: 0.583, GPR: 3.022, PR: 2.370) [80]. Moreover, MLP demonstrates the lowest Average Absolute Relative Deviation (AARD%) at 2.564%, compared to GPR's 18.733% and PR's 11.327% [80]. These machine learning approaches are particularly valuable for analyzing complex datasets with substantial numbers of data points (exceeding 19,000 in recent studies), enabling robust statistical analysis and predictive modeling of adsorption processes [80].
The integration of mass transfer insights, artificial intelligence techniques, and computational modeling tools represents a multidisciplinary approach that enhances prediction accuracy and modeling efficiency, offering a practical pathway to optimize separation processes beyond the capabilities of traditional experimental approaches alone [80].
Applications and Future Perspectives
Optimized adsorbents find applications across diverse fields including environmental remediation, catalytic processes, gas storage, and drug delivery systems [79]. In water treatment, mesoporous carbons with hierarchical structures demonstrate strong potential for micropollutant adsorption applications, with optimized materials exhibiting exceptional capacity for organic contaminants [79]. In the biomedical field, protein adsorption behavior on optimized surfaces critically influences biological responses to artificial materials, with applications in blood-contacting devices and implantable materials [78].
Future developments in adsorbent optimization will likely focus on multi-functional materials capable of simultaneous adsorption of multiple contaminants, regenerable adsorbents with extended operational lifetimes, and bio-inspired designs mimicking natural selective adsorption processes. The integration of high-throughput synthesis methodologies with machine learning prediction models represents a particularly promising direction, enabling rapid screening and optimization of adsorbent materials for specific applications. Additionally, advances in nano-scale engineering will facilitate the development of next-generation adsorbents with precisely controlled surface chemistry and pore architecture at the molecular level.
The continuous refinement of characterization techniques, particularly in situ and operando methods, will provide deeper insights into adsorption mechanisms and kinetics, further guiding the rational design of advanced adsorbent materials. As computational power increases and algorithms become more sophisticated, the integration of multi-scale modeling approaches—spanning from molecular simulations to process-level optimization—will accelerate the development of tailored adsorbent solutions for emerging challenges in separation science and environmental technology.
Adsorption, the process by which molecules of a fluid (adsorptive) accumulate on the surface of a solid (adsorbent), is a fundamental separation mechanism central to numerous industrial applications. The efficiency and selectivity of this process are governed by the underlying mechanism—either physisorption (physical adsorption) or chemisorption (chemical adsorption). Physisorption is characterized by weak, nonspecific van der Waals forces, with adsorption energies typically not exceeding 80 kJ/mol and is easily reversed. In contrast, chemisorption involves the formation of strong chemical bonds, effectively creating a surface compound, with heats of adsorption ranging up to 600-800 kJ/mol and being difficult to reverse [4] [27]. This foundational distinction is critical for selecting appropriate adsorbent materials and designing intensified separation processes like swing adsorption.
Process Intensification aims to dramatically improve process efficiency, reduce equipment size, and lower energy consumption. Within separation technologies, swing adsorption represents a key intensification strategy, leveraging cyclic changes in process conditions to regenerate adsorbents and achieve continuous separation. The core principle involves selectively adsorbing target components from a gas mixture under specific conditions, then systematically altering the process environment to desorb the concentrated product. The choice between physisorption and chemisorption mechanisms directly dictates the selection of adsorbent materials, the energy requirements for regeneration, and the overall process design for Pressure Swing Adsorption (PSA), Temperature Swing Adsorption (TSA), and their hybrid, Temperature-Vacuum Swing Adsorption (TVSA).
Theoretical Foundations: Physisorption vs. Chemisorption
Fundamental Mechanisms and Energetics
The interaction between an adsorbate and an adsorbent surface can be understood through its potential energy diagram, which charts the energy of the system as a function of the molecule's distance from the surface [4].
- Physisorption (Case I): This interaction is governed solely by weak, attractive van der Waals forces. The potential energy curve displays a shallow minimum at a relatively large distance from the surface (typically >0.3 nm). Crucially, there is no energy barrier to adsorption, making the kinetics inherently fast and non-activated. However, the shallow well depth also means that physisorbed molecules can be easily desorbed by minor changes in pressure or temperature [4].
- Chemisorption (Case II): This process involves the formation of a chemical bond, resulting in a deep, narrow energy minimum at a much shorter distance from the surface. The combined potential energy curve for a molecule capable of both physisorption and chemisorption often exhibits an activation energy barrier at the point where the physisorption and chemisorption curves cross. This barrier can slow the adsorption kinetics. The depth of the chemisorption well is a direct measure of the adsorption energy, reflecting a strong, specific interaction that often requires significant energy input to reverse [4].
Table 1: Comparative Analysis of Physisorption and Chemisorption
| Characteristic | Physisorption | Chemisorption |
|---|---|---|
| Binding Forces | Van der Waals forces | Chemical bonding (covalent/ionic) |
| Energy of Adsorption | Low (≤ 80 kJ/mol) | High (up to 600-800 kJ/mol) |
| Equilibrium Distance | Large (>0.3 nm) | Short (chemical bond distance) |
| Specificity | Non-specific | Highly specific |
| Kinetics | Fast, non-activated | Can be slow, may be activated |
| Temperature Dependence | Occurs at lower temperatures | Often requires higher temperatures |
| Layer Formation | Multi-layer formation possible | Typically limited to a single monolayer |
| Reversibility | Highly reversible | Often difficult to reverse |
Implications for Swing Adsorption Process Design
The fundamental differences between these mechanisms have direct consequences for designing and operating swing adsorption processes.
- Adsorbent Material Selection: Physisorption-based processes typically use high-surface-area materials like activated carbons, zeolites, and metal-organic frameworks (MOFs), which rely on pore structure and weak surface forces for capacity. Chemisorption-based processes employ functionalized materials, most commonly amine-supported adsorbents, where amine groups (e.g., -NH₂) chemically react with CO₂ to form carbamates or bicarbonates [81] [82].
- Energy Requirements for Regeneration: The energy needed for the desorption step is directly tied to the adsorption strength. Reversing weak physisorption, as in PSA, requires relatively little energy, often achieved through modest pressure drops. In contrast, breaking the strong chemical bonds in chemisorption, as in TSA, demands a significant thermal energy input to elevate the adsorbent temperature [81] [82].
- Process Kinetics and Cyclic Capacity: The fast kinetics of physisorption enable rapid cycle times, particularly in PSA. Chemisorption kinetics can be slower due to the reaction rate and potential activation barriers, potentially leading to longer cycle times. However, chemisorption can offer higher selectivity and capacity for specific target molecules, like CO₂ in low-concentration streams [82].
Swing Adsorption Variants: Mechanisms and Applications
Temperature Swing Adsorption (TSA)
TSA leverages the temperature dependence of adsorption equilibria, typically exploiting chemisorption for highly selective capture.
- Core Mechanism: The process operates in two main stages. During the adsorption step, the feed gas is contacted with the adsorbent at a lower temperature, which favors the exothermic adsorption (or chemisorption) of the target component. Once the adsorbent approaches saturation, the desorption/regeneration step begins by increasing the bed temperature, typically through the direct injection of hot steam or an electric heater. This temperature increase shifts the equilibrium, driving the desorption of the concentrated target component [81] [83].
- Typical Application - Direct Air Capture (DAC): TSA is widely used in adsorption-based DAC, where amine-functionalized solid sorbents chemisorb CO₂ from ambient air at near-ambient temperatures. The regeneration is then achieved by heating the bed to temperatures in the range of 80-100 °C to release a high-purity CO₂ stream [83].
- Key Limitation: A major drawback of pure TSA is the slow cycle times caused by the thermal inertia of the solid adsorbent bed. Heating and cooling a large mass of solid and associated equipment is energy-intensive and time-consuming, limiting the number of cycles per day and thus the productivity of the process [81].
Pressure Swing Adsorption (PSA)
PSA operates by exploiting the pressure dependence of physisorption equilibria, enabling rapid cycles.
- Core Mechanism: The adsorption step is conducted at a higher pressure, where the physisorption capacity of the solid for the target component is greatest. For regeneration, the pressure is rapidly reduced, either to atmospheric pressure (blowdown) or to a vacuum (see VSA). This pressure reduction lowers the equilibrium loading, releasing the adsorbed gas. The bed is then typically purged with a portion of the product gas before being repressurized to start a new cycle [81].
- Typical Applications: PSA is exceptionally well-suited for bulk gas separation where components have different physisorption affinities. Common applications include the production of high-purity nitrogen from air (using carbon molecular sieves) and hydrogen purification in refineries and ammonia plants [81].
- Key Limitation: For capturing trace components from a dilute stream, such as CO₂ in air (~400 ppm), the working capacity of a physisorbent between atmospheric pressure and a practical vacuum level is often too low to be economical. The weak van der Waals forces are insufficient to selectively capture and retain the target molecule against its very low partial pressure [81] [82].
Temperature-Vacuum Swing Adsorption (TVSA)
TVSA is a hybrid process that intensifies regeneration by combining the benefits of TSA and VSA, making it particularly effective for chemisorption-based applications like DAC.
- Core Mechanism: The adsorption step occurs at ambient or near-ambient temperature and pressure. For regeneration, the system simultaneously applies a vacuum and elevates the temperature. The vacuum lowers the partial pressure of the adsorbed component, creating a driving force for desorption. The elevated temperature provides the necessary energy to break the chemical bonds formed during chemisorption. This synergistic combination allows for effective desorption at lower temperatures than TSA alone or with a less deep vacuum than VSA alone [81] [82].
- Typical Application - Direct Air Capture (DAC): TVSA is considered the state-of-the-art regeneration strategy for amine-functionalized DAC sorbents. For example, studies using the benchmark sorbent Lewatit VP OC 1065 or the MOF mmen-Mg₂(dobpdc) typically employ desorption temperatures around 100 °C and vacuum pressures below 0.15 bar [81] [82].
- Advantages: TVSA offers a superior balance between energy consumption and productivity. It avoids the extreme vacuum requirements of pure VSA for chemisorbents and mitigates the high thermal energy and slow cycles of pure TSA by using a moderate temperature swing. This leads to higher CO₂ purity, recovery, and lower specific energy consumption [82].
Table 2: Operational Characteristics of Swing Adsorption Processes
| Process | Primary Swing | Primary Mechanism | Typical Cycle Time | Key Advantage | Key Disadvantage |
|---|---|---|---|---|---|
| PSA | Pressure | Physisorption | Minutes (Fast) | Rapid cycles, high productivity | Limited for ultra-dilute feeds |
| TSA | Temperature | Chemisorption | Hours (Slow) | High selectivity, suitable for dilute feeds | High energy, slow cycles |
| VSA | Vacuum | Physisorption | Minutes (Fast) | Effective for weakly adsorbed gases | High energy for compression/vacuum |
| TVSA | Temperature & Vacuum | Chemisorption | Minutes to Hours | Optimized energy, high purity product | Complex system control |
Advanced Analysis: TVSA for Direct Air Capture (A Case Study)
Experimental Protocol for TVSA Cycle Optimization
The following methodology outlines a standard approach for evaluating and optimizing a TVSA cycle for CO₂ capture from air, as derived from recent high-fidelity modeling studies [81].
- Adsorbent Packing: A fixed-bed adsorption column is uniformly packed with a specified mass of a solid amine sorbent, such as Lewatit VP OC 1065.
- Cycle Definition: The TVSA cycle is defined by five sequential steps:
- Adsorption: Humid ambient air is fed through the bed at a controlled flow rate, temperature, and relative humidity. CO₂ and H₂O are co-adsorbed.
- Vacuum: The bed is isolated and rapidly evacuated to a predetermined low pressure.
- Desorption: While under vacuum, the bed is heated to the target desorption temperature using an internal or external heater.
- Cooling: After desorption, the bed is cooled to near ambient temperature to prepare for the next adsorption step and prevent adsorbent degradation.
- Pressurization: The bed is brought back to atmospheric pressure with air.
- Parameter Sensitivity Analysis: A multi-dimensional parametric study is conducted by varying key operational parameters across a defined range:
- Adsorption Parameters: Inlet gas velocity (e.g., 0.3 - 2.4 m/s), adsorption temperature (e.g., 298.15 K), relative humidity (e.g., 0.4), and adsorption time.
- Desorption Parameters: Vacuum pressure (e.g., 30 - 200 mbar), desorption temperature (e.g., 373.15 K), and desorption time.
- Performance Metric Evaluation: For each set of conditions, the following key performance indicators (KPIs) are calculated:
- CO₂ Purity (%) and Recovery (%): Measured from the product stream during desorption.
- Daily CO₂ Productivity (kg CO₂ / m³ adsorbent / day): A measure of process throughput.
- Specific Energy Consumption (MJ / kg CO₂): The total energy input (thermal for heating, electrical for vacuum) per unit of CO₂ captured.
Key Research Reagent Solutions and Materials
Table 3: Essential Materials for Adsorption-Based DAC Research
| Item | Function/Description | Example Materials |
|---|---|---|
| Solid Amine Adsorbent | Chemisorbs CO₂ from low-concentration streams; the core reactive material. | Lewatit VP OC 1065, Amine-functionalized Silica, mmen-Mg₂(dobpdc) (MOF) |
| MOF Adsorbent | Tunable physisorbent with extremely high surface area; can be functionalized. | mmen-Mg₂(dobpdc), CALF-20, UTSA-16 |
| Zeolite & Carbon Adsorbents | High-surface-area physisorbents for bulk separations or pre-drying. | 13X Zeolite, Activated Carbon (AC) |
| Process Modeling Software | Simulates transient adsorption-desorption cycles for process design and optimization. | Aspen Adsorption, COMSOL Multiphysics |
| Volumetric Chemisorption Analyzer | Automates high-resolution measurement of chemisorption isotherms and surface properties. | Micromeritics ASAP series, Pulse Chemisorption systems |
Quantitative Performance Data and Process Optimization
Recent parametric studies of TVSA cycles provide critical insights into the relationship between operating conditions and system performance [81] [82].
Table 4: TVSA Performance Metrics Under Varied Operational Parameters
| Parameter Variation | Impact on CO₂ Purity | Impact on Productivity | Impact on Specific Energy | Optimal Range/Value |
|---|---|---|---|---|
| Inlet Gas Velocity (to 2.4 m/s) | Minor decrease | Significant increase | Decrease | ~2.4 m/s (upper limit for equilibrium) |
| Adsorption Time (to t₉₅) | Minor decrease | Reaches maximum at t₉₅ | Decrease | Time to 95% saturation (t₉₅) |
| Vacuum Pressure (e.g., <0.15 bar) | Increase | Increase | Increase | Lower is better, balance with energy |
| Desorption Temperature (e.g., 100 °C) | Increase | Increase | Increase | ~100 °C (balance energy vs. capacity) |
| Relative Humidity (0.4) | Complex effect | Increase at optimal RH | Increase (H₂O co-desorption) | ~0.3 (optimal for cost) [81] |
Studies on mmen-Mg₂(dobpdc) demonstrate that under optimal TVSA conditions (vacuum pressure < 0.15 bar and feed temperature < 15 °C), the process can achieve CO₂ purity of ~98%, recovery over 70%, and a specific energy consumption of about 3.5 MJ/kgCO₂ [82]. Furthermore, two-dimensional modeling has revealed critical phenomena like CO₂ and H₂O re-adsorption in the reactor center during desorption, a effect that one-dimensional models fail to capture but which is crucial for scaling up DAC systems [81].
Visualization of Process Workflows and Relationships
TVSA Cycle Process Diagram
The following diagram illustrates the sequential steps of a Temperature-Vacuum Swing Adsorption (TVSA) cycle, highlighting the changes in pressure and temperature that drive the adsorption and desorption processes.
Physisorption vs. Chemisorption Energy Diagram
This potential energy diagram contrasts the fundamental energetic pathways of physisorption and chemisorption, showing the key differences in equilibrium distance, well depth, and the presence of an activation barrier.
Process Intensification through swing adsorption technologies offers a powerful pathway to more efficient and sustainable chemical separations. The strategic selection of PSA, TSA, or TVSA is fundamentally guided by the choice between physisorption and chemisorption mechanisms, which in turn dictates adsorbent selection, energy management, and ultimate process economics. The current trend, particularly in challenging applications like direct air capture, leans towards hybrid approaches like TVSA, which successfully balance the high selectivity of chemisorption with intensified regeneration through combined thermal and vacuum swings.
Future development will focus on pushing the boundaries of process intensification. This includes the discovery and synthesis of next-generation adsorbents with higher capacity, faster kinetics, and greater stability, such as advanced amine-functionalized MOFs. Intensified reactor designs, such as rotary bed contactors, are being explored to overcome the thermal inertia limitations of traditional fixed-bed TSA. Furthermore, the deep integration of swing adsorption systems with low-grade or renewable energy sources is critical for improving net efficiency and economic viability, especially for carbon-negative technologies like DAC. As modeling capabilities advance from one-dimensional to multi-dimensional, high-fidelity simulations, our ability to predict and optimize these complex cyclic processes at scale will be crucial for their successful industrial implementation.
Validation Metrics and Comparative Analysis for Informed Decision-Making
Within the study of surface science, the differentiation between physical adsorption (physisorption) and chemical adsorption (chemisorption) is foundational for researchers in catalysis, material science, and drug development. This differentiation hinges on quantitative energetic descriptors, primarily the activation energy and heat of adsorption. These parameters provide unambiguous criteria to characterize the nature, strength, and kinetics of adsorbate-adsorbent interactions [84].
This technical guide provides an in-depth examination of these quantitative metrics. It is framed within a broader thesis on the distinctions between physisorption and chemisorption, offering researchers a rigorous framework for experimental characterization and analysis. The content is structured to serve scientists and drug development professionals who require precise methodologies to elucidate adsorption mechanisms for applications in catalyst design or drug delivery system optimization.
Theoretical Foundation: Physisorption vs. Chemisorption
Adsorption, the adhesion of atoms, ions, or molecules from a gas or liquid to a surface, is a process that occurs through two distinct mechanisms. Their fundamental differences are rooted in the nature of the electronic interaction at the surface.
Physical Adsorption (Physisorption) is characterized by weak, non-specific forces, primarily van der Waals interactions. These are electrostatic interactions between fluctuating dipoles and induced dipoles. As such, physisorption involves no significant electron transfer or chemical bond formation between the adsorbate and the adsorbent surface. The resulting adsorption energies are low, typically in the range of 5–50 kJ/mol, which are comparable to the energies of condensation. Consequently, physisorption is reversible and can occur in multilayers. It is significant at relatively low temperatures and plays a dominant role in processes such as gas separation and the characterization of porous materials via surface area and pore size analysis.
Chemical Adsorption (Chemisorption), in contrast, involves the formation of a genuine chemical bond—either ionic or covalent—between the adsorbate and the adsorbent. This process often involves a significant electronic rearrangement and an activation energy barrier. The bond strengths in chemisorption are much higher, with heats of adsorption typically ranging from 50–800 kJ/mol, values that are characteristic of chemical bond energies. Chemisorption is a localized phenomenon, specific to certain surface sites and functional groups, and is limited to a monolayer. Due to the high energy of the interaction and the potential for an activation barrier, chemisorption is often irreversible or requires significant energy input to reverse. It is the crucial first step in most heterogeneous catalytic reactions [84].
Table 1: Fundamental Characteristics of Physisorption and Chemisorption
| Characteristic | Physisorption | Chemisorption |
|---|---|---|
| Nature of Interaction | Van der Waals forces | Chemical bond (ionic/covalent) |
| Activation Energy | Typically negligible | Often significant |
| Heat of Adsorption | Low (5–50 kJ/mol) | High (50–800 kJ/mol) |
| Specificity | Non-specific | Highly specific |
| Reversibility | Highly reversible | Often irreversible |
| Temperature Range | Low temperatures (near boiling point) | Higher temperatures |
| Layer Formation | Multilayer possible | Monolayer only |
The following diagram illustrates the energetic pathways for physisorption and chemisorption, highlighting the key differences in activation energy and adsorption energy.
Diagram 1: Energetic pathways of physisorption and chemisorption.
Quantitative Descriptors for Differentiation
The theoretical distinction between physisorption and chemisorption is operationalized through the precise measurement of two key thermodynamic and kinetic parameters.
Heat of Adsorption (ΔHₐds)
The heat of adsorption is the definitive thermodynamic quantity for characterizing the strength of the adsorbate-adsorbent interaction. It is the enthalpy change released when adsorption occurs. The magnitude of ΔHₐds provides the most direct evidence for distinguishing the adsorption type [84].
- For Physisorption: The heat of adsorption is low, typically 5–50 kJ/mol, as it arises from weak van der Waals forces. Its value is often close to, but greater than, the latent heat of condensation of the adsorbate.
- For Chemisorption: The heat of adsorption is high, typically 50–800 kJ/mol, reflecting the energy of a chemical bond. Its value can vary significantly depending on the surface coverage due to the heterogeneity of surface sites; the heat of adsorption is often highest on a clean surface and decreases as more sites are occupied.
The heat of adsorption can be measured directly using calorimetry or calculated indirectly from adsorption isotherms measured at different temperatures using the Clausius-Clapeyron equation.
Activation Energy (Eₐ)
The activation energy is the minimum energy required for the adsorption process to occur. It is a kinetic parameter that reveals the presence of an energy barrier between the gas-phase molecule and the chemisorbed state.
- For Physisorption: The activation energy is typically negligible or very small. The process is non-activated and can occur readily at low temperatures.
- For Chemisorption: The activation energy can be significant, as the process often involves bond breaking and rearrangement (e.g., the dissociation of H₂ on a metal surface). The presence of a substantial Eₐ is a strong indicator of a chemisorptive process.
Activation energy is typically determined by analyzing the temperature dependence of the adsorption rate or by using Temperature-Programmed Desorption (TPD).
Table 2: Quantitative Ranges for Key Adsorption Descriptors
| Parameter | Physisorption | Chemisorption | Preferred Measurement Technique |
|---|---|---|---|
| Heat of Adsorption (ΔHₐds) | 5 – 50 kJ/mol | 50 – 800 kJ/mol | Calorimetry, Isosteric Method (Clausius-Clapeyron) |
| Activation Energy (Eₐ) | Negligible (Non-activated) | Can be significant (Activated process) | Analysis of Adsorption Kinetics, TPD |
| Typical Bond Distance | >3 Å | 1 – 3 Å | X-ray Photoelectron Spectroscopy (XPS), LEED |
| Vibrational Frequency Shift | Small shift (<100 cm⁻¹) | Large shift (>100 cm⁻¹) or new peaks | Fourier-Transform Infrared Spectroscopy (FTIR) |
Experimental Protocols for Quantitative Analysis
This section details established methodologies for determining the key parameters that enable quantitative differentiation.
Determining Heat of Adsorption via Calorimetry
Objective: To directly measure the heat evolved during the adsorption process, providing a direct and accurate value for ΔHₐds.
Methodology:
- Setup: The adsorbent sample is placed in a high-precision microcalorimeter, evacuated, and heated to remove all contaminants. The system is held at a constant temperature.
- Dosing: Small, known doses of the adsorbate gas are introduced to the sample cell.
- Measurement: The heat flow resulting from each gas dose adsorption is measured by the calorimeter with high sensitivity. The amount of gas adsorbed is simultaneously determined manometrically or volumetrically.
- Data Analysis: The differential heat of adsorption is calculated for each dose from the measured heat flow and the quantity adsorbed. This allows for the construction of a plot of heat of adsorption versus surface coverage, revealing the energetic heterogeneity of the surface [84].
Determining Heat of Adsorption via the Isosteric Method
Objective: To calculate the isosteric heat of adsorption (ΔHₐds) indirectly from a series of adsorption isotherms.
Methodology:
- Data Collection: Measure a series of adsorption isotherms (quantity adsorbed vs. pressure) for the adsorbate on the adsorbent at multiple, closely spaced temperatures.
- Isosteric Selection: At a fixed amount of gas adsorbed (an isosteric condition), note the equilibrium pressures (P) at the different temperatures (T).
- Clausius-Clapeyron Application: For each isosteric amount, the data is fitted to the Clausius-Clapeyron equation: ( \ln(P) = -\frac{\Delta H_{ads}}{R} \cdot \frac{1}{T} + C ) where R is the gas constant.
- Calculation: The slope of the plot of
ln(P)versus1/Tis-ΔHₐds/R. The isosteric heat of adsorption is thus calculated asΔHₐds = -slope * R[84].
Determining Activation Energy via Temperature-Programmed Desorption (TPD)
Objective: To probe the energy distribution of binding states and determine the activation energy for desorption (E_d), which is approximately equal to the heat of adsorption for non-dissociative chemisorption.
Methodology:
- Saturation: The clean adsorbent surface is saturated with the adsorbate at a low temperature.
- Purging: The gas phase is evacuated to remove any physisorbed multilayer.
- Linear Ramp: The temperature of the sample is increased linearly over time while the composition of the gas phase is monitored with a mass spectrometer.
- Peak Analysis: Desorption peaks appear at characteristic temperatures. The activation energy for desorption (Ed) can be extracted from the peak temperature (Tp) and the shape of the desorption spectrum using analysis methods such as the Redhead equation (for first-order desorption) or more complex fitting procedures.
The following workflow diagram outlines the key steps for a combined TPD and Isosteric Heat analysis experiment.
Diagram 2: TPD experimental workflow.
The Scientist's Toolkit: Research Reagent Solutions
Successful execution of the described protocols requires specific materials and instrumentation. The following table details key reagents and their functions in adsorption experiments.
Table 3: Essential Materials and Reagents for Adsorption Characterization
| Item / Reagent | Function / Role | Technical Specification & Notes |
|---|---|---|
| High-Purity Adsorbent | The material under study (e.g., catalyst, porous solid). | Zeolites, Metal-Organic Frameworks (MOFs), activated carbon, metal catalysts on supports (e.g., Pt/Al₂O₃). Must be pre-treated to clean the surface. |
| Ultra-High Purity (UHP) Probe Gases | Adsorbate molecules used to characterize the surface. | N₂ (for surface area), CO/CO₂/H₂ (for chemisorption), Ar/Kr (for low-surface-area materials). Purity >99.999% to prevent contamination. |
| Reference Material (e.g., SiO₂, Al₂O₃) | Standardized material for calibrating instruments and validating experimental protocols. | Non-porous or well-defined porous standard with certified surface area. |
| Calibration Gas Mixture | For quantitative calibration of mass spectrometers and gas analyzers. | Known mixtures of the adsorbate in an inert gas (e.g., 1% H₂ in Ar). |
| Inert Purge Gas | For system evacuation and purging between experiments. | UHP Helium or Argon, dried and purified to remove trace O₂ and H₂O. |
Data Integration and Interpretation Framework
The ultimate goal is to synthesize data from multiple experiments to conclusively identify the adsorption mechanism. The following workflow provides a logical framework for this integration.
Diagram 3: Data integration for adsorption mechanism identification.
Case Study Interpretation: Consider the characterization of hydrogen adsorption on a platinum catalyst.
- TPD Analysis reveals a desorption peak at high temperature (~500 K), indicating strong bonding.
- Calorimetry measures a heat of adsorption of ~80 kJ/mol, which is far greater than the heat of condensation of H₂ (~1 kJ/mol).
- FTIR Spectroscopy shows the appearance of Pt-H stretching vibrations.
Conclusion: The quantitative data (high ΔHₐds, high desorption T) integrated with spectral evidence unequivocally confirms that hydrogen undergoes chemisorption on platinum, involving dissociation to form Pt-H bonds [84]. This systematic, multi-technique approach provides the robust evidence required for conclusive differentiation.
The analysis of surface processes, particularly adsorption, is foundational to understanding and optimizing heterogeneous catalysis, a critical component in pharmaceutical manufacturing and chemical synthesis. Kinetic profiling serves as a powerful methodological framework for deconvoluting these complex processes, with a primary objective of identifying the rate-limiting step—the slowest elementary step that governs the overall reaction velocity. Determining this step is paramount for the rational design of efficient catalysts and chemical processes. The entire endeavor of kinetic profiling is predicated on a clear mechanistic understanding of the reaction pathway, which begins with differentiating between the two primary modes of adsorption: physical adsorption and chemical adsorption.
The distinction between these adsorption types is not merely academic; it has profound implications for reaction kinetics and mechanism. The following table summarizes the core differences, which directly influence how kinetic profiles are interpreted and which steps may become rate-limiting.
Table 1: Fundamental Differences Between Physical and Chemical Adsorption
| Property | Physical Adsorption (Physisorption) | Chemical Adsorption (Chemisorption) |
|---|---|---|
| Interaction Force | Weak Van der Waals forces [5] | Strong chemical bond formation [5] |
| Enthalpy of Adsorption | Low (typically 20 – 40 kJ/mol) [5] | High (typically 80 – 240 kJ/mol) [5] |
| Reversibility | Highly reversible [5] | Often irreversible [5] |
| Temperature Dependence | Favored at low temperatures [5] | Favored at higher temperatures [5] |
| Specificity | Non-specific; occurs on all surfaces [5] | Highly specific; requires compatible adsorbent/adsorbate pairs [5] |
| State of Adsorbate | Remains unchanged [5] | May change state due to chemical reaction [5] |
| Layer Formation | Multi-layer formation possible [27] | Typically limited to a single monolayer [27] |
In a typical heterogeneous catalytic cycle, the initial chemisorption of a reactant molecule onto an active site is a prerequisite for reaction. If this step is significantly slower than subsequent surface diffusion, surface reaction, or desorption steps, it becomes the rate-limiting step for the entire process. Accurate identification of this bottleneck allows researchers to focus efforts on modifying catalyst properties—such as surface energy or active site distribution—to specifically enhance the limiting process.
Methodologies for Kinetic Profiling and Identifying Rate-Limiting Steps
A diverse arsenal of experimental and computational techniques is available for constructing kinetic profiles and pinpointing rate-limiting steps. The choice of method depends on the system's complexity, the available data, and the desired depth of mechanistic insight.
Experimental and Analytical Techniques
Temperature-Programmed Desorption (TPD) is a cornerstone technique in catalytic kinetics. In a TPD experiment, a catalyst surface is first saturated with an adsorbate. The temperature is then increased in a controlled, linear fashion while the desorption of molecules is monitored, typically with a mass spectrometer or thermal conductivity detector. The resulting spectrum (desorption rate vs. temperature) provides direct information on the binding energy and the number of distinct binding sites. A desorption peak appearing at a higher temperature indicates a stronger adsorbate-catalyst bond. The shape and position of these peaks are critical for estimating kinetic parameters like activation energy for desorption, which can be the rate-limiting step in catalytic cycles.
Static Volometric and Dynamic Pulse Chemisorption are two principal isothermal methods for quantifying the number of active sites on a catalyst, a key parameter in kinetic modeling. The static volumetric method involves exposing a cleaned catalyst sample to precise doses of an adsorptive gas (e.g., H₂, CO) at a constant temperature and measuring the pressure drop at equilibrium to construct a high-resolution chemisorption isotherm. This method is highly automated and provides detailed information on gas uptake as a function of pressure. In contrast, the dynamic pulse chemisorption technique operates at ambient pressure. Small, known quantities of the adsorptive are injected in a carrier gas stream over the catalyst. A downstream thermal conductivity detector (TCD) measures the amount of gas not adsorbed by the catalyst. The process continues until the catalyst surface is saturated, and the total uptake is calculated from the sum of the adsorbed pulses. This method is often faster and simpler, ideal for determining total active surface area and dispersion.
In Vitro Enzyme Kinetics with Kinetic Modeling is a powerful bio-centric approach for metabolic pathways. As demonstrated in a study of E. coli glycolysis, the Vmax (maximum enzyme activity) for multiple enzymes in a pathway can be determined simultaneously. This is achieved by combining an in vitro experiment, where a reaction mixture containing substrates and a cell extract is monitored over time, with a computational kinetic model. The model's Vmax parameters are optimized to fit the experimental time-course data of intermediate concentrations. Subsequent Metabolic Control Analysis using this parameterized model can then quantitatively identify the enzyme exerting the greatest control over the pathway flux, i.e., the rate-limiting step. This was validated by the finding that fructose bisphosphate aldolase (FBA) was rate-limiting in stationary phase E. coli, and its overexpression led to a 1.4-fold increase in the specific glucose consumption rate.
Computational and Modeling Approaches
Isoconversional Kinetic Analysis is an advanced model-free method used to elucidate complex reaction mechanisms. It involves performing multiple experiments under different temperature programs (e.g., different heating rates) and analyzing the dependence of the activation energy on the extent of conversion. A change in the calculated activation energy as the reaction progresses is a strong indicator of a shift in the rate-limiting step, revealing multi-step mechanisms that might be obscured in a single experiment.
Density Functional Theory (DFT) Calculations provide an atomic-level window into reaction mechanisms. Using quantum mechanical methods, scientists can calculate the structures and energies of reactants, intermediates, transition states, and products along a proposed reaction pathway. By mapping the potential energy surface, the step with the highest energy transition state relative to its predecessor is identified as the rate-limiting step. The DFT-B3LYP method, for example, with basis sets like 6-31G(d) for geometry optimization and 6-311++G(2d,2p) for single-point energy calculations, is a standard approach for studying catalytic rearrangement reactions.
Automated Kinetic Modeling and Model Discrimination represents a cutting-edge, high-throughput approach. One methodology involves using an automated flow chemistry platform to perform transient flow-ramp experiments, rapidly generating rich reaction profile data. A library of all plausible candidate reaction models is generated. A mixed-integer linear programming (MILP) approach is then used to computationally discriminate between these models and identify the optimal kinetic parameters for each process, all with minimal user input. This autonomous framework can significantly accelerate process understanding and optimization.
Table 2: Summary of Key Experimental Protocols for Kinetic Profiling
| Technique | Core Principle | Key Measured Outputs | Primary Application in Kinetic Profiling |
|---|---|---|---|
| Temperature-Programmed Desorption (TPD) | Monitor desorption rate during controlled temperature increase [27]. | Desorption spectrum (Rate vs. Temperature). | Identify binding strengths and number of active sites; estimate desorption kinetic parameters [27]. |
| Static Volumetric Chemisorption | Measure gas uptake at equilibrium under precise pressure dosing [27]. | High-resolution chemisorption isotherm (Gas Uptake vs. Pressure). | Quantify active site density and surface energy distribution; generate data for isotherm modeling [27]. |
| In Vitro Pathway Kinetics | Fit a kinetic model to time-course data of metabolite concentrations [85]. | Optimized Vmax values for all pathway enzymes. | Identify the enzyme with the highest flux control coefficient (rate-limiting enzyme) via Metabolic Control Analysis [85]. |
| Automated Flow Ramp Experiments | Use an automated platform to rapidly map reaction space under transient conditions [86]. | Concentration profiles of reactants, intermediates, and products over time. | Generate high-quality, data-rich datasets for autonomous model identification and parameter estimation [86]. |
Workflow and Pathway Visualization
The following diagram illustrates the generalized logical workflow for determining a rate-limiting step, integrating both experimental and computational approaches as discussed in the methodologies.
General Workflow for Rate-Limiting Step Identification
The specific experimental workflow for a technique like Temperature-Programmed Desorption (TPD), which is crucial for characterizing surface processes, is detailed below.
TPD Experimental Protocol
The Scientist's Toolkit: Essential Research Reagents and Materials
Successful kinetic profiling relies on a suite of specialized reagents, materials, and instrumentation. The following table details key items and their functions in the context of the experiments and techniques described in this guide.
Table 3: Essential Research Reagent Solutions and Materials for Kinetic Profiling
| Item | Function/Description | Key Application Context |
|---|---|---|
| Supported Metal Catalysts | Active metal (e.g., Pt, Pd, Ni) dispersed on a high-surface-area support (e.g., TiO₂, ZrO₂, Al₂O₃, SiO₂). | Model systems for studying chemisorption and heterogeneous catalytic kinetics [27]. |
| Probe Gases (e.g., H₂, CO, NH₃, O₂) | Highly pure gases selected for their specific chemical interactions with catalyst active sites. | Used in chemisorption (H₂, CO) and TPD/TPR/TPO experiments to quantify sites and probe acidity/reducibility [27]. |
| Crude Cell Extract | A preparation containing the full complement of soluble enzymes from lysed cells. | Serves as the enzyme source for in vitro metabolic pathway kinetics, preserving native enzyme ratios [85]. |
| Cofactor/Nucleotide Mixtures | Prepared solutions of essential cofactors (e.g., NADH, ATP, Mg²⁺). | Required for maintaining activity in in vitro enzyme assays for pathways like glycolysis [85]. |
| Zeolitic & Solid Acid Catalysts | Crystalline or amorphous materials with acidic sites (e.g., Zeolites, amorphous silica-alumina). | Used for studying reaction kinetics in acid-catalyzed processes like cracking; acidity is tunable via Si/Al ratio [27]. |
| Raney Metal Catalysts | Unsupported, highly porous active metal sponges (e.g., Raney Nickel) created by leaching an alloy. | Provide high density of surface atoms for studying intrinsic metal catalysis without support effects [27]. |
| Calibrated Thermal Conductivity Detector (TCD) | A detector that measures the thermal conductivity of a gas stream relative to a reference. | Quantifies the amount of gas not adsorbed in pulse chemisorption or desorbing in TPD experiments [27]. |
| Automated Flow Chemistry Platform | A system that precisely controls reagent mixing, flow rates, and residence times in microreactors. | Enables rapid, automated collection of kinetic data under transient conditions for model generation [86]. |
The processes of adsorption, the accumulation of molecular species on a solid or liquid surface, are fundamentally classified into two types: physisorption and chemisorption. Physisorption (physical adsorption) is characterized by weak intermolecular van der Waals forces, resulting in a non-specific, reversible, and often multi-layered adsorption process with low enthalpy changes (typically 20–40 kJ/mol) [21] [87]. In contrast, Chemisorption (chemical adsorption) involves the formation of stronger chemical bonds between the adsorbate and adsorbent. It is a highly specific, typically irreversible, and unimolecular layer process with a substantially higher enthalpy of adsorption (80–240 kJ/mol) [21] [4].
In real-world applications, from environmental remediation to drug discovery, surfaces are invariably exposed to mixtures of substances. This gives rise to competitive adsorption, a phenomenon where multiple components in a fluid phase vie for adsorption sites on a solid surface [44]. The outcome of this competition—which component is preferentially adsorbed—is known as adsorption selectivity. Understanding and analyzing this selectivity is critical for optimizing processes such as catalytic reactions, gas separation, drug delivery systems, and water purification [88] [89] [90]. This guide provides an in-depth technical examination of the principles, analysis methods, and factors governing competitive adsorption and selectivity within the broader context of physical and chemical adsorption mechanisms.
Fundamental Principles of Adsorption Selectivity
Selectivity in a multi-component system is determined by the relative affinity of each component for the adsorbent surface. This affinity is influenced by the nature of the adsorption forces (physisorption vs. chemisorption) and the properties of both the adsorbates and the adsorbent.
The Energetic Landscape: Physisorption and Chemisorption
The interaction between a molecule and a surface can be understood through its potential energy curve. In pure physisorption, the potential energy diagram shows a shallow minimum at a relatively large distance (typically >0.3 nm) from the surface, representing the weak van der Waals attraction. There is no energy barrier to adsorption, making the kinetics fast [4].
For molecules capable of chemisorption, the potential energy curve is dominated by a much deeper well at a shorter distance, corresponding to the energy of chemical bond formation. The path to chemisorption often involves an activation energy barrier, leading to slower kinetics. Crucially, the overall potential energy curve for a molecule that can chemisorb is a combination of the physisorption and chemisorption curves, where the weak physisorption forces initially attract the molecule to the surface before chemical bond formation can occur [4]. The table below summarizes the key differences between these two fundamental processes.
Table 1: Fundamental Differences between Physisorption and Chemisorption [21] [87]
| Characteristic | Physisorption | Chemisorption |
|---|---|---|
| Forces Involved | van der Waals forces | Chemical bonds |
| Nature | Reversible | Irreversible |
| Specificity | Non-specific | Highly specific |
| Enthalpy of Adsorption | Low (20–40 kJ/mol) | High (80–240 kJ/mol) |
| Temperature Dependence | Favors low temperature; decreases with increasing temperature | Favors high temperature; often increases with temperature |
| Layer Formation | Multimolecular layers possible | Unimolecular layer only |
| Activation Energy | Low | Often high |
Mechanisms Driving Selectivity in Multi-Component Systems
In a mixture, the component with the higher affinity will dominate the adsorption sites. The mechanisms behind this preference can be physical, chemical, or steric.
- Electronegativity and Ionic Interactions: In aqueous systems, metal ions with higher electronegativity often exhibit stronger attraction to electron-donating functional groups on adsorbents. For instance, during the competitive adsorption of Cu²⁺ and Zn²⁺ onto biochar, copper's higher electronegativity gave it a selective advantage [88].
- Hydration Effects: The size of an ion's hydration shell impacts its ability to approach the adsorbent surface. Ions with a smaller hydration radius, like Cu²⁺, can access adsorption sites more easily than those with a larger one, like Zn²⁺ [88].
- Molecular Size and Porosity: The pore size distribution of the adsorbent and the molecular dimensions of the adsorbates lead to steric effects and molecular sieving. Components that better "fit" into the available pores will be preferentially adsorbed [91].
- Functional Group Specificity: In chemisorption, selectivity is profoundly influenced by the specific chemical functional groups present on both the adsorbent and adsorbate. For example, on a complex adsorbent, functional groups may follow a distinct priority order when interacting with metal ions (e.g., C-H > C=O > C≡C > C-C) [88].
Experimental Methodologies for Analyzing Competitive Adsorption
Accurately measuring adsorption behavior in multi-component systems requires robust experimental and computational techniques. Below are detailed protocols for key methodologies.
Experimental Batch Adsorption with Characterization
This is a foundational method for quantifying adsorption capacity and selectivity in liquid-phase systems.
Table 2: Key Research Reagents and Materials for Competitive Adsorption Studies
| Reagent/Material | Function in Experiment | Example & Specifics |
|---|---|---|
| Porous Adsorbent | Provides surface area and active sites for adsorption. | Biochar from willow leaves (LBC) [88]; Activated carbon [44]; Coal samples [90]. |
| Multi-Component Solution/Gas | The competitive environment for adsorption. | Cu²⁺ and Zn²⁺ in water [88]; CH₄ and CO₂ gas mixture [90]. |
| Analytical Instrumentation | Quantifies concentration of adsorbates before and after adsorption. | ICP-MS for metal ions; Gas Chromatograph for gas mixtures. |
| 2D-COS (2D Correlation Spectroscopy) | Elucidates the sequence and priority of interactions between adsorbent functional groups and adsorbates. | Identifies interaction order: e.g., C-H > C=O > C≡C > C-C for metals on biochar [88]. |
| Density Functional Theory (DFT) Calculations | Computational method to model adsorption energy and electron cloud overlap. | Calculates adsorption energy (e.g., -1.07 eV for Cu vs. -0.49 eV for Zn) [88]. |
Protocol: Competitive Adsorption of Heavy Metals on Biochar [88]
- Adsorbent Preparation: Synthesize biochar from your precursor (e.g., willow leaves) via pyrolysis. Characterize the resulting material using techniques like BET surface area analysis, SEM, and FTIR to determine its physical and chemical properties.
- Solution Preparation: Prepare single-component and multi-component solutions of the target adsorbates (e.g., Cu(NO₃)₂ and Zn(NO₃)₂) in deionized water across a range of relevant concentrations (e.g., 0-200 mg/L) and pH levels (e.g., pH 3–6).
- Batch Adsorption Experiment:
- Place a fixed mass of the biochar (e.g., 0.1 g) into a series of vials.
- Add a fixed volume (e.g., 50 mL) of the single or mixed metal solutions to each vial.
- Seal the vials and agitate in a constant-temperature shaker until adsorption equilibrium is reached (e.g., 24 hours).
- Analysis:
- Filter the solution to remove the biochar.
- Analyze the filtrate using Inductively Coupled Plasma Mass Spectrometry (ICP-MS) or Atomic Absorption Spectroscopy (AAS) to determine the equilibrium concentration of each metal ion.
- Calculate the adsorption capacity for each metal in both single and mixed systems using the mass balance equation:
q_e = (C_0 - C_e) * V / m, whereq_eis the equilibrium adsorption capacity (mg/g),C_0andC_eare the initial and equilibrium concentrations (mg/L),Vis the solution volume (L), andmis the adsorbent mass (g).
- Selectivity Analysis: Compare the uptake capacities in the binary system to determine the preferential adsorption. A selectivity coefficient (S) can be defined as
S_(A/B) = (q_e,A / C_e,A) / (q_e,B / C_e,B).
Molecular Simulation using GCMC Methods
Molecular simulations provide a microscopic view of competitive adsorption, complementing experimental data.
Protocol: Simulating Gas Competition in Coal [90]
- Model Construction:
- Build a molecular model of the adsorbent. For example, a coal molecule can be represented as C₂₀₆H₁₂₈O₃₆N₂ [90].
- Use software like Materials Studio's Amorphous Cell module to pack multiple molecules into a simulation box with periodic boundary conditions, setting the correct density (e.g., 1.253 g/cm³ for coal).
- Energy Minimization: Optimize the geometry of the constructed model using a Forcite module to find a low-energy, stable configuration.
- Adsorption Simulation:
- Use the Sorption module with the "Fix pressure" task item to simulate adsorption.
- Set the pressure range (e.g., 0–10 MPa) and temperature(s) for the simulation.
- Use the Giant Canonical Monte Carlo (GCMC) method, which is well-suited for simulating systems at equilibrium with a reservoir of particles.
- Define the adsorbates as a gas mixture (e.g., CH₄ and CO₂) at the desired molar ratios.
- Data Analysis:
- The simulation outputs adsorption isotherms for each component in the mixture.
- Extract key parameters like the Langmuir constants and the adsorption selectivity coefficient.
- Analyze the spatial distribution of the adsorbed molecules within the pore structure.
Chromatographic Methods for Lipophilicity and Affinity
Liquid chromatography can simulate the partitioning of compounds between a mobile phase (like blood) and a stationary phase (like a biological membrane), which is analogous to competitive adsorption.
Protocol: Determining Lipophilicity (logP) via RP-HPLC [89]
- System Setup: Use a Reverse-Phase High-Performance Liquid Chromatography (RP-HPLC) system with a C18 stationary phase column.
- Mobile Phase Preparation: Prepare mobile phases with varying ratios of a non-polar solvent (e.g., n-octanol) and a polar solvent (e.g., water or buffer).
- Calibration: Inject a series of standard compounds with known logP values to establish a correlation between retention time and lipophilicity.
- Sample Analysis: Inject the compound(s) of interest and record their retention times.
- Data Processing: Use the linear-solvent-strength (LSS) model to relate the retention factor to the mobile phase composition, allowing for the calculation of the compound's chromatographic hydrophobicity index (CHI), which is correlated to its logP. This lipophilicity parameter is critical for predicting a drug candidate's absorption and distribution [89].
Data Analysis and Isotherm Modeling for Multi-Component Systems
Translating raw adsorption data into predictive models is essential for design and optimization. While the Langmuir and Freundlich models are standard for single components, multi-component systems require more sophisticated approaches.
Table 3: Summary of Quantitative Data from Competitive Adsorption Studies
| System Description | Experimental Conditions | Key Quantitative Results | Implied Selectivity |
|---|---|---|---|
| Cu²⁺ vs. Zn²⁺ on Biochar (LBC) [88] | Single & binary systems in water, pH 3-6. | Single-system max capacity: Cu: 174.76 mg·g⁻¹, Zn: 129.65 mg·g⁻¹.Binary-system capacity: Cu: 105.13 mg·g⁻¹, Zn: 104.46 mg·g⁻¹.DFT Adsorption Energy: Cu: -1.07 eV, Zn: -0.49 eV. | Cu > Zn |
| CO₂ vs. CH₄ in Coal [90] | GCMC simulation; various pressures, temperatures, and water contents. | Adsorption capacity of CO₂ significantly stronger than CH₄ across all conditions. Selectivity decreases with increasing temperature or water content, but CO₂ advantage remains. | CO₂ >> CH₄ |
| Heavy Metal Mixtures [44] | Multi-component aqueous systems using activated carbon. | The JAMM isotherm model predicted multi-component behavior with an average R² of 0.86, successfully capturing competition and interactions. | Varies by mixture |
Key Multi-Component Adsorption Isotherm Models
- Extended Langmuir (EL) Model: Assumes a homogeneous surface with no interaction between adsorbed species. While simple, its assumptions are often unrealistic [44].
- Ideal Adsorbed Solution Theory (IAST): A more thermodynamically rigorous model that predicts multi-component equilibrium using only data from single-component isotherms. It assumes an ideal solution on the adsorbent surface, which can be a limitation for systems with strong adsorbate-adsorbate interactions [44].
- JAMM (Jeppu Amrutha Manipal Multicomponent) Isotherm: A recently developed model designed to overcome the limitations of earlier isotherms. Its key advantage is the incorporation of an interaction coefficient between components, a mole fraction parameter for site distribution, and a heterogeneity index to account for surface non-uniformity. It has demonstrated high accuracy (average R² = 0.86) in predicting various competitive systems [44].
Factors Influencing Competitive Adsorption and Selectivity
The outcome of competitive adsorption is governed by a complex interplay of several factors, which can be broadly categorized as operational conditions, adsorbent properties, and adsorbate characteristics.
Operational Conditions: Temperature has a divergent effect: it typically decreases physisorption but can promote chemisorption, which often requires an activation energy [21] [90]. Pressure generally increases the extent of adsorption for gases. The pH of a solution critically affects the ionization state of both the adsorbate and the adsorbent's surface functional groups, thereby altering electrostatic interactions [88]. The presence of moisture can significantly hinder gas adsorption by competitively occupying polar sites and blocking pores [90].
Adsorbent Properties: The surface area is a primary factor, as a higher area provides more sites for adsorption, affecting both physisorption and chemisorption [21]. Porosity and pore size distribution are crucial for selectivity based on molecular sieving. Surface chemistry, including the type and density of functional groups (e.g., -OH, C=O), directly determines the potential for specific chemisorptive bonds [88] [92].
Adsorbate Characteristics: The molecular size and shape of an adsorbate influence its diffusion into pores and its steric fit on active sites [91]. Polarity, electronegativity, and ionic radius dictate the strength of electrostatic interactions with the surface [88]. For drug molecules, lipophilicity (logP) is a critical descriptor, as it determines the molecule's affinity for lipid-like (hydrophobic) surfaces versus aqueous environments, directly impacting its absorption and distribution behavior [89].
The analysis of competitive adsorption is a complex but essential endeavor for advancing numerous scientific and industrial fields. A deep understanding of the competition between physisorption and chemisorption mechanisms, coupled with robust experimental and computational methodologies, allows researchers to decode the principles of adsorption selectivity. The development of comprehensive multi-component isotherm models, such as the JAMM isotherm, and the integration of advanced characterization techniques are pushing the boundaries of our predictive capabilities. As this field evolves, the ability to precisely engineer adsorbents and optimize processes for targeted separation, purification, and delivery applications will become increasingly sophisticated, driven by a fundamental grasp of the competitive interactions at the surface.
The long-term sustainability and economic viability of adsorption technologies in industrial and environmental applications are fundamentally governed by the stability and reusability of the adsorbent materials. Whether used for purifying wastewater, managing gaseous pollutants, or in catalytic processes, adsorbents inevitably experience performance decline through various deactivation mechanisms. These include pore blockage by contaminants, chemical degradation of active sites, and physical structural collapse over repeated operational cycles [93]. Understanding these pathways is crucial for developing effective regeneration protocols that can restore adsorption capacity while maintaining material integrity.
The distinction between physical adsorption (physisorption) and chemical adsorption (chemisorption) is particularly critical when evaluating lifespan and regeneration potential. Physisorption, characterized by weaker van der Waals forces, typically allows for easier regeneration through relatively mild processes such as temperature or pressure swings. In contrast, chemisorption, involving the formation of stronger chemical bonds, often requires more aggressive regeneration strategies that can potentially damage the adsorbent structure over multiple cycles [94]. This review systematically examines the fundamental mechanisms governing adsorbent deactivation, synthesizes current regeneration methodologies, provides standardized protocols for assessing stability and reusability, and offers practical guidance for researchers navigating this complex technical landscape.
Fundamental Mechanisms of Adsorbent Deactivation
Adsorbent deactivation occurs through several interrelated mechanisms that collectively diminish performance over time. The primary pathways include fouling (pore blockage by contaminants), degradation of active sites through irreversible chemical reactions, sintering (thermal-induced structural changes), and mechanical attrition leading to physical breakdown [93] [65].
In physical adsorption processes, deactivation predominantly occurs through pore blockage and surface fouling, where large contaminant molecules or particulate matter physically obstruct access to the internal porous structure. This is particularly problematic for microporous materials with narrow pore channels. For instance, activated carbons used in water treatment experience significant capacity reduction after accumulating natural organic matter that blocks pores smaller than 1-2 nanometers [65]. In contrast, chemisorption processes typically face deactivation through irreversible chemical binding where contaminants form strong covalent or ionic bonds with active sites, effectively removing them from future adsorption cycles. Materials like ion-exchange resins used for PFAS removal are particularly susceptible to this mechanism, as the perfluoroalkyl substances strongly bind to functional groups through electrostatic and complexation interactions [93].
The structural stability of an adsorbent under operational conditions fundamentally influences its deactivation trajectory. Materials with amorphous structures generally exhibit shorter lifespans due to weaker mechanical strength and greater susceptibility to structural degradation. Conversely, crystalline materials like zeolites and Metal-Organic Frameworks (MOFs) typically demonstrate superior resistance to mechanical stress but may be vulnerable to hydrothermal degradation or chemical attack in extreme pH environments [94]. Understanding these deactivation mechanisms is essential for selecting appropriate regeneration strategies and designing adsorbents with enhanced operational longevity.
Current Regeneration Methodologies and Performance
Multiple regeneration methodologies have been developed to restore adsorbent capacity, each with distinct mechanisms, advantages, and limitations suited to specific adsorption contexts. The following table summarizes the primary regeneration techniques and their documented performance across various adsorbent classes.
Table 1: Regeneration Methodologies for Different Adsorbent Classes
| Regeneration Method | Mechanism of Action | Applicable Adsorbents | Typical Efficiency | Key Limitations |
|---|---|---|---|---|
| Thermal Regeneration | High-temperature desorption/destruction of adsorbates | Activated carbon, Biochar, Zeolites | 60-95% capacity recovery after multiple cycles [93] | High energy intensity; Potential structural damage above 800°C |
| Solvent Extraction | Chemical dissolution and desorption of contaminants | Polymeric resins, MOFs, Activated carbon | 70-100% short-term recovery [93] | Secondary waste generation; Solvent disposal issues |
| Chemical Regeneration | pH adjustment or reactive chemicals to break adsorbate bonds | Ion-exchange resins, Biochar, Clay minerals | High for specific contaminants (e.g., PFAS) [93] | Chemical consumption; Potential adsorbent degradation |
| Hybrid Methods | Combination of thermal, chemical, or biological processes | Wide range of porous materials | Superior to single-method approaches [93] | Process complexity; Higher operational costs |
| Electrochemical | Electrochemical oxidation of adsorbed contaminants | Carbon-based materials, Conductive composites | Emerging method with promising results [93] | Limited to conductive adsorbents; Scale-up challenges |
Thermal Regeneration Processes
Thermal regeneration remains the most established method for carbon-based adsorbents, utilizing high temperatures (typically 500-900°C) under inert atmospheres to volatilize and pyrolyze accumulated contaminants. The process typically involves three stages: drying (up to 150°C), baking (150-650°C) where low molecular weight compounds are desorbed, and high-temperature pyrolysis (650-900°C) where heavier organic deposits are cracked and removed [93]. While thermal treatment can effectively restore 80-95% of initial capacity for activated carbons in water treatment applications, it suffers from significant drawbacks including high energy intensity, material losses of 5-15% per cycle due to burn-off and attrition, and potential alteration of surface chemistry that may affect adsorption selectivity [93]. For temperature-sensitive materials like many MOFs and functionalized polymers, thermal regeneration is often unsuitable due to structural collapse or chemical degradation at elevated temperatures.
Chemical and Solvent-Based Regeneration
Chemical regeneration encompasses both solvent extraction and reactive chemical treatments designed to desorb contaminants through solubility changes or chemical reactions. Solvent regeneration typically employs organic solvents like methanol, ethanol, or acetone to dissolve and extract organic contaminants from saturated adsorbents. This approach has demonstrated particular effectiveness for PFAS-saturated adsorbents, with methanol-based regeneration achieving up to 100% short-term recovery for ion-exchange resins [93]. However, the process generates secondary waste streams requiring careful management, and solvent residues may remain on the adsorbent surface, potentially affecting subsequent adsorption cycles.
Chemical reaction-based regeneration utilizes pH adjustment, oxidizing agents, or surfactants to break contaminant-adsorbent bonds. For instance, alkaline solutions (pH > 10) have proven effective for regenerating activated carbons saturated with acidic pharmaceuticals like ibuprofen by ionizing functional groups and enhancing contaminant solubility [65]. Advanced oxidative processes using hydrogen peroxide, ozone, or persulfate have shown promise for degrading recalcitrant contaminants directly on the adsorbent surface, though these aggressive oxidants may also damage the adsorbent structure over multiple regeneration cycles.
Emerging and Hybrid Regeneration Technologies
Electrochemical regeneration represents an emerging approach that applies electrical currents to conductive or semi-conductive adsorbents to oxidize adsorbed contaminants. This method has demonstrated potential for in situ regeneration of carbon-based adsorbents saturated with organic pollutants, with the advantages of mild operational conditions and minimal chemical requirements [93]. However, its application remains limited to electrically conductive adsorbent systems and requires further development for widespread commercial implementation.
Hybrid regeneration strategies that combine multiple approaches often achieve superior results compared to single-method treatments. For example, sequential solvent extraction followed by mild thermal treatment (200-300°C) has demonstrated enhanced regeneration efficiency for PFAS-saturated adsorbents while minimizing energy consumption and material degradation [93]. Similarly, combining chemical oxidation with biological regeneration shows promise for sustainable management of biochar and activated carbons used in wastewater treatment, though these approaches remain primarily at the research stage.
Table 2: Regeneration Performance for Specific Contaminant Classes
| Contaminant Class | Optimal Regeneration Method | Cycles Demonstrated | Capacity Retention | Key Challenges |
|---|---|---|---|---|
| Pharmaceuticals (e.g., Ibuprofen) | Thermal (300-500°C) or alkaline treatment | 3-5 cycles [65] | 60-80% after 3 cycles [65] | Declining efficiency with cycles; Byproduct formation |
| PFAS | Solvent (methanol) regeneration + thermal | 5+ cycles [93] | 70-100% initial cycles, declining thereafter [93] | Incomplete destruction; Concentrated waste streams |
| Microplastics | Chemical/mechanical washing | Limited data [95] | Varies by adsorbent | Adsorbent-specific protocols lacking |
| VOCs | Thermal swing adsorption | Dozens of cycles in industrial settings | 80-95% with periodic replacement | Energy intensive; Gradual degradation |
Experimental Protocols for Assessing Adsorbent Lifespan
Standardized experimental protocols are essential for reliably evaluating adsorbent stability and regeneration potential across different material classes and applications. This section provides detailed methodologies for conducting lifespan assessments through multiple adsorption-desorption cycles.
Batch Mode Cyclic Regeneration Studies
Objective: To evaluate the regeneration efficiency and capacity retention of adsorbents over multiple adsorption-regeneration cycles under controlled laboratory conditions.
Materials and Equipment:
- Adsorbent material (typically 0.1-1.0 g per test)
- Target contaminant solution at specified concentration
- Regeneration apparatus (thermal furnace, solvent extraction system, or chemical treatment setup)
- Analytical equipment (HPLC, GC-MS, TOC analyzer, or ICP-MS depending on contaminant)
- Surface characterization instruments (BET surface area analyzer, FTIR, SEM)
Procedure:
- Initial Characterization: Determine the adsorbent's baseline properties including specific surface area (BET method), pore volume and distribution (BJH method), surface functional groups (FTIR), and initial adsorption capacity for the target contaminant.
- Adsorption Phase: Expose the adsorbent to the contaminant solution at predetermined conditions (pH, temperature, concentration) until equilibrium is reached (typically 2-24 hours depending on kinetics).
- Capacity Measurement: Separate the adsorbent from solution, analyze residual contaminant concentration, and calculate the adsorption capacity (qe, mg/g).
- Regeneration Phase: Subject the saturated adsorbent to the selected regeneration method:
- Thermal: Heat in inert atmosphere (N2) at specified temperature (300-800°C) for 1-4 hours
- Solvent: Treat with appropriate solvent (e.g., methanol, acetone) for 2-6 hours with agitation
- Chemical: Expose to regeneration solution (e.g., NaOH, HCl, oxidants) for specified contact time
- Post-Regeneration Processing: Wash regenerated adsorbent thoroughly (if chemical/solvent method), dry at 105°C, and weigh to determine mass loss.
- Reuse Testing: Repeat adsorption phase with regenerated adsorbent using identical conditions to initial cycle.
- Multiple Cycles: Repeat steps 2-6 for a minimum of 3-5 cycles to establish degradation trends.
- Final Characterization: Analyze cycled adsorbent using same techniques as initial characterization to identify structural or chemical changes.
Data Analysis: Calculate the regeneration efficiency (RE) after each cycle using the formula: RE (%) = (qe,n / qe,1) × 100 Where qe,n is the adsorption capacity at cycle n and qe,1 is the initial adsorption capacity.
Additionally, determine the capacity retention rate by fitting the capacity data across cycles to appropriate decay models (e.g., exponential decay, linear regression) to predict long-term performance.
Continuous Flow Column Studies
Objective: To simulate industrial operation conditions and assess dynamic breakthrough behavior and regeneration efficiency under continuous flow.
Materials and Equipment:
- Glass or stainless steel adsorption column (typically 1-2 cm diameter, 10-20 cm height)
- Peristaltic or HPLC pump for controlled flow
- Effluent sampling system or online monitoring
- Regeneration solution reservoir and pumping system
Procedure:
- Column Packing: Pack the adsorption column with a known mass of adsorbent (typically 1-10 g) using wet-packing method to eliminate air bubbles.
- Initial Breakthrough: Pass contaminant solution through the column at constant flow rate (e.g., 1-10 mL/min) while collecting effluent at regular intervals for concentration analysis.
- Breakthrough Analysis: Continue until effluent concentration reaches 90-95% of influent concentration (C/C0 = 0.9-0.95), recording the total treatment volume.
- In-situ Regeneration: Pass regeneration solution (appropriate solvent, chemical, or hot water) through the saturated column in forward or reverse direction at controlled flow rate.
- Rinsing: Flush column with distilled water until effluent pH and conductivity stabilize (if chemical regeneration used).
- Reuse Testing: Repeat breakthrough analysis with regenerated column using identical flow conditions.
- Multiple Cycles: Repeat steps 2-5 for 3-5 complete adsorption-regeneration cycles.
Data Analysis: Calculate the breakthrough adsorption capacity for each cycle based on the integrated area above the breakthrough curve. Determine the dynamic regeneration efficiency similar to batch studies, and monitor changes in breakthrough curve shape (sharpening or broadening) that indicate alterations in mass transfer characteristics.
Visualization of Adsorbent Lifecycle Assessment
Adsorbent Lifecycle Assessment Workflow
The Researcher's Toolkit: Essential Materials and Reagents
Successful investigation of adsorbent stability and regeneration requires specific materials and analytical capabilities. The following table outlines essential research reagents and their applications in lifespan assessment studies.
Table 3: Essential Research Reagents for Adsorbent Lifespan Studies
| Reagent/Material | Technical Function | Application Context | Key Considerations |
|---|---|---|---|
| Model Contaminants | Standardized challenge compounds for performance testing | Ibuprofen (pharmaceuticals), PFOA/PFOS (PFAS), Methylene Blue (dyes) | Select compounds relevant to intended application; Consider environmental relevance |
| Regeneration Solvents | Desorption medium for solvent-based regeneration | Methanol, Ethanol, Acetone, Acetonitrile | Purity (>99.5%); Potential for solvent recovery and reuse; Environmental impact |
| Chemical Regenerants | pH adjustment or reactive regeneration | NaOH, HCl, H2O2, Persulfates | Concentration optimization required; Potential adsorbent degradation at extreme conditions |
| Characterization Standards | Calibration and method validation | N2 (BET analysis), Reference materials for analytical instruments | High-purity gases; Certified reference materials for accurate quantification |
| Synthetic Wastewater | Simulated complex matrices for realistic testing | Defined ionic composition with background organics | Reproducible formulation; Representative of target water chemistry |
The systematic assessment of adsorbent stability and regeneration potential represents a critical research domain that directly influences the economic and environmental sustainability of adsorption technologies. Current evidence indicates that while numerous regeneration strategies can partially restore adsorption capacity, progressive performance decline over multiple cycles remains a fundamental challenge across most material classes [93] [65]. The selection of appropriate regeneration protocols must be guided by the specific adsorption mechanisms (physisorption vs. chemisorption), contaminant characteristics, and adsorbent structural stability.
Future research priorities should address several key knowledge gaps. First, developing standardized testing protocols for adsorbent lifespan assessment would enable more meaningful cross-study comparisons and accelerate technology development. Second, advancing hybrid regeneration approaches that combine multiple mechanisms may overcome limitations of single-method strategies. Third, integrating artificial intelligence and machine learning techniques could optimize regeneration parameters based on real-time performance data, potentially extending functional adsorbent lifespans [65]. Finally, greater emphasis on lifecycle assessment and techno-economic analysis is essential to validate the environmental and economic benefits of regeneration protocols compared to adsorbent replacement.
As adsorption technologies continue to evolve for addressing increasingly complex separation challenges, the principles and methodologies outlined in this review provide a framework for rigorously evaluating and enhancing adsorbent reusability—a critical step toward more sustainable water treatment, environmental remediation, and industrial processes.
Conclusion
A clear understanding of the distinctions between physisorption and chemisorption—from the weak, reversible van der Waals forces of the former to the strong, often irreversible chemical bonds of the latter—is paramount for advancing biomedical and clinical research. The choice between these mechanisms directly influences the efficiency of drug adsorption onto carriers, the design of catalytic processes for pharmaceutical synthesis, and the removal of contaminants from process streams. Future directions should leverage advanced characterization techniques and AI-driven material design to develop next-generation smart adsorbents with tailored properties. The integration of robust validation and comparative metrics will be crucial for translating laboratory findings into reliable, scalable clinical applications, ultimately enabling more targeted therapies and efficient bioprocesses.
References
- 1. Adsorption - Wikipedia [https://en.wikipedia.org/wiki/Adsorption]
- 2. Adsorbate - an overview | ScienceDirect Topics [https://www.sciencedirect.com/topics/engineering/adsorbate]
- 3. Difference between Adsorption and Absorption [https://byjus.com/chemistry/adsorption-absorption-differences/]
- 4. 31.6: Atoms and Molecules can Physisorb or Chemisorb to ... [https://chem.libretexts.org/Bookshelves/Physical_and_Theoretical_Chemistry_Textbook_Maps/Physical_Chemistry_(LibreTexts)/31%3A_Solids_and_Surface_Chemistry/31.06%3A_Atoms_and_Molecules_can_Physisorb_or_Chemisorb_to_a_Surface]
- 5. Major Differences Between Physical & Chemical Adsorption [https://www.acttr.com/en/en-report/en-report-application-notes/455-en-app-differences-physical-chemical-adsorption.html]
- 6. Analysis of the CO2 adsorption on AC: experimentation ... [https://www.nature.com/articles/s41598-025-22526-w]
- 7. In Situ Quantitative Monitoring of Adsorption from Aqueous ... [https://pmc.ncbi.nlm.nih.gov/articles/PMC11348127/]
- 8. Understanding Adsorption: Theories, Techniques, and ... [https://www.intechopen.com/chapters/1209166]
- 9. 5 Difference Between Chemisorption And Physisorption, ... [https://www.pw.live/iit-jee/exams/difference-between-chemisorption-and-physisorption]
- 10. Physisorption and Chemisorption Mechanisms Influencing ... [https://www.frontiersin.org/journals/environmental-science/articles/10.3389/fenvs.2021.678574/full]
- 11. Advancing drug development with “Fit-for-Purpose” modeling ... [https://pmc.ncbi.nlm.nih.gov/articles/PMC12436579/]
- 12. Advances in Quantitative Analytical Methods for Solid Drugs [https://www.mdpi.com/2073-4352/15/1/38]
- 13. Physisorption in the Real World: 5 Uses You'll Actually See ... [https://www.linkedin.com/pulse/physisorption-real-world-5-uses-youll-actually-see-nkhsf/]
- 14. Stabilization of small organic molecules on V 2 C and V 2 CO ... [https://pubs.rsc.org/en/content/articlehtml/2025/ra/d4ra06676f]
- 15. A graph-based computational approach for modeling ... [https://www.nature.com/articles/s41598-025-06624-3]
- 16. Recognizing Physisorption and Chemisorption in Carbon ... [https://www.mdpi.com/1424-8220/16/5/731]
- 17. Chemisorption [https://micromeritics.com/chemisorption/]
- 18. CHEMISORPTION Definition & Meaning [https://www.merriam-webster.com/medical/chemisorption]
- 19. Chemisorption [https://en.wikipedia.org/wiki/Chemisorption]
- 20. Catalysis 101: Understanding Chemisorption [https://www.hidenanalytical.com/blog/catalysis-101-understanding-chemisorption/]
- 21. Physisorption and Chemisorption [https://byjus.com/jee/physisorption-and-chemisorption/]
- 22. Chemisorption - an overview | ScienceDirect Topics [https://www.sciencedirect.com/topics/materials-science/chemisorption]
- 23. Chemisorption – Knowledge and References [https://taylorandfrancis.com/knowledge/Engineering_and_technology/Chemical_engineering/Chemisorption/]
- 24. Surface chemistry | Research Starters [https://www.ebsco.com/research-starters/chemistry/surface-chemistry]
- 25. Chemisorption - an overview [https://www.sciencedirect.com/topics/immunology-and-microbiology/chemisorption]
- 26. Physisorption [https://en.wikipedia.org/wiki/Physisorption]
- 27. Introduction to Chemical Adsorption Analytical Techniques ... [https://micromeritics.com/resources/introduction-to-chemical-adsorption-analytical-techniques-and-their-applications-to-catalysis/]
- 28. 2.4: PE Curves and Energetics of Adsorption [https://chem.libretexts.org/Bookshelves/Physical_and_Theoretical_Chemistry_Textbook_Maps/Surface_Science_(Nix)/02%3A_Adsorption_of_Molecules_on_Surfaces/2.04%3A_PE_Curves_and_Energetics_of_Adsorption]
- 29. Molecular simulation-based insights into dye pollutant ... [https://www.sciencedirect.com/science/article/pii/S0001868624002045]
- 30. Determination of thermodynamic parameters in adsorption ... [https://link.springer.com/article/10.1007/s11696-025-04218-x]
- 31. Thermodynamic modeling adsorption behavior of a well- ... [https://www.nature.com/articles/s41598-025-06005-w]
- 32. Experimental study and modeling adsorption behavior of a ... [https://www.nature.com/articles/s41598-025-05564-2]
- 33. Modeling Urotropine adsorption thermodynamic on ... [https://www.nature.com/articles/s41598-025-19112-5]
- 34. Adsorption Capacity, Reaction Kinetics and ... [https://www.mdpi.com/2073-4360/17/15/2141]
- 35. The Difference Between Sorption - C & R - C&R Magazine [https://www.candrmagazine.com/the-difference-between-sorption/]
- 36. SEM, XRD and FTIR analyses of both ultrasonic and heat ... [https://pmc.ncbi.nlm.nih.gov/articles/PMC7068104/]
- 37. SEM, XRD and FTIR analyses of both ultrasonic and heat ... [https://www.sciencedirect.com/science/article/pii/S2405844020303911]
- 38. Adsorption Isotherms Applications [https://byjus.com/chemistry/adsorption-isotherms-applications/]
- 39. Comparison of the experimental results with the Langmuir ... [https://link.springer.com/article/10.1007/s13201-019-1061-2]
- 40. Langmuir-Freundlich Isotherm - an overview [https://www.sciencedirect.com/topics/engineering/langmuir-freundlich-isotherm]
- 41. Investigation of the CO2 adsorption isotherms on activated ... [https://www.nature.com/articles/s41598-025-16088-0]
- 42. Model-based design of experiments for adsorption isotherms [https://link.springer.com/article/10.1007/s10450-025-00653-0]
- 43. Modeling of a Hybrid Langmuir Adsorption Isotherm for ... [https://www.sciencedirect.com/science/article/abs/pii/S0022354917309073]
- 44. Development of a Multicomponent Adsorption Isotherm ... [https://pmc.ncbi.nlm.nih.gov/articles/PMC10720473/]
- 45. Physisorption - an overview | ScienceDirect Topics [https://www.sciencedirect.com/topics/engineering/physisorption]
- 46. Unveiling pore size contributions and host-guest ... [https://www.nature.com/articles/s41427-025-00609-4]
- 47. Flexible humidity sensors for diverse applications [https://www.nature.com/articles/s41378-025-01086-z]
- 48. A novel methodology for assessing the hygroscopicity ... - AMT [https://amt.copernicus.org/articles/18/603/2025/]
- 49. Fundamentals of Vacuum Technology en Part 25 | PDF [https://www.scribd.com/document/917278562/Fundamentals-of-Vacuum-Technology-en-Part-25]
- 50. Effect of Humidity on Microwave-based Direct Air Capture ... [https://www.sciencedirect.com/science/article/abs/pii/S0013935125024351]
- 51. Advances in the Application of Graphene and Its ... [https://www.mdpi.com/1424-8247/18/9/1245]
- 52. Heterogeneous catalysis [https://en.wikipedia.org/wiki/Heterogeneous_catalysis]
- 53. Heterogeneous Catalysts: Mechanism, Examples & Uses [https://allen.in/jee/chemistry/heterogeneous-catalysts]
- 54. Understanding Catalyst Poisoning in Precious Metal ... [https://www.samaterials.com/content/catalyst-poisoning-in-precious-metal-catalysts-causes-problems-and-solutions.html]
- 55. and silica-supported (10 %Со+0.5 %Pd) catalyst surfaces ... [https://www.sciencedirect.com/science/article/pii/S0920586125002494]
- 56. Catalyst poisoning [https://en.wikipedia.org/wiki/Catalyst_poisoning]
- 57. Catalyst Poisoning - an overview [https://www.sciencedirect.com/topics/engineering/catalyst-poisoning]
- 58. Adsorption properties of the pharmaceutical contaminant ... [https://www.nature.com/articles/s41598-025-22875-6]
- 59. Adsorption – Physisorption and Chemisorption Explained [https://www.gcea.de/en/artikel/adsorption]
- 60. Recent advancements in carbon capture materials research [https://pubs.rsc.org/en/content/articlelanding/2025/ta/d5ta01304f]
- 61. Nanomaterials for Direct Air Capture of CO2: Current State ... [https://www.mdpi.com/1420-3049/30/14/3048]
- 62. Carbon capture could become practical with these scalable ... [https://news.northwestern.edu/stories/2025/04/carbon-capture-affordable-materials]
- 63. An overview of technologies for capturing, storing, and ... [https://www.sciencedirect.com/science/article/abs/pii/S1385894724034855]
- 64. Enabling hydrogen chemisorption on charged graphene [https://pubs.rsc.org/en/content/articlehtml/2025/cp/d5cp00150a]
- 65. A review of the developments in adsorbents for the efficient ... [https://pubs.rsc.org/en/content/articlehtml/2025/ra/d5ra02007g]
- 66. pH/ROS-responsive magnesium scaffold functionalized via ... [https://pubmed.ncbi.nlm.nih.gov/41270300/]
- 67. The Open DAC 2025 Dataset for Sorbent Discovery in ... [https://arxiv.org/html/2508.03162v2]
- 68. Comparing Methods for Pyrite Surface Area Measurement ... [https://www.mdpi.com/2413-4155/7/1/8]
- 69. Surface areas and adsorption energies of biochars ... [https://www.nature.com/articles/s41598-024-81030-9]
- 70. A novel framework for Adsorption Thermodynamics [https://www.sciencedirect.com/science/article/abs/pii/S0360544225024880]
- 71. Multiscale modeling of gas adsorption and surface coverage ... [https://pubs.rsc.org/en/content/articlehtml/2025/sc/d5sc03726c]
- 72. A new quantitative characterization method of absolute ... [https://www.sciencedirect.com/science/article/abs/pii/S1385894725083901]
- 73. Mechanistic breakthroughs in affordable adsorbents for ... [https://www.sciencedirect.com/science/article/pii/S277241662500258X]
- 74. Investigating the Physical Adsorption of DCPD/Furfural and ... [https://pmc.ncbi.nlm.nih.gov/articles/PMC12073282/]
- 75. Improving the adsorption efficiency of a low-cost natural ... [https://pubs.rsc.org/en/content/articlehtml/2025/ma/d5ma00253b]
- 76. Low-Cost Adsorbents for the Removal of Pharmaceuticals ... [https://www.mdpi.com/2073-4441/17/17/2619]
- 77. Comparative chromium adsorptive capacity of different low ... [https://www.nature.com/articles/s41598-025-12076-6]
- 78. Volumetric Interpretation of Protein Adsorption: Kinetics ... [https://pmc.ncbi.nlm.nih.gov/articles/PMC2762548/]
- 79. Optimization of Mesoporous Carbon Adsorbents from Sucrose ... [https://pmc.ncbi.nlm.nih.gov/articles/PMC12409577/]
- 80. Advancing computational evaluation of adsorption via ... [https://www.nature.com/articles/s41598-025-15538-z]
- 81. Multi-dimensional process optimization of temperature ... [https://www.sciencedirect.com/science/article/abs/pii/S0360544225033754]
- 82. Dynamic Temperature–Vacuum Swing Adsorption for ... [https://www.mdpi.com/2071-1050/17/15/6796]
- 83. 吸附式直接空气捕集与可再生能源耦合技术研究进展 [https://www.jjmjs.com.cn/article/doi/10.13226/j.issn.1006-6772.CR25063002]
- 84. Classical and new insights into the methodology for ... [https://www.sciencedirect.com/science/article/pii/S0920586123000238]
- 85. Identification of a rate-limiting step in a metabolic pathway ... [https://pubmed.ncbi.nlm.nih.gov/33168471/]
- 86. Rapid, automated determination of reaction models and ... [https://www.sciencedirect.com/science/article/pii/S1385894720331454]
- 87. What are Chemisorption and Physisorption Differences [https://www.goldapp.com.cn/techs?article_id=114]
- 88. Competitive adsorption of Cu and Zn in water by pyrolysis ... [https://www.sciencedirect.com/science/article/pii/S2352186425005905]
- 89. Liquid chromatography in determination of ... [https://www.sciencedirect.com/science/article/abs/pii/S1570023225001266]
- 90. Characterisation of competitive adsorption of CH 4 and CO ... [https://www.nature.com/articles/s41598-025-15809-9]
- 91. Competitive adsorption-penetration characteristics of multi ... [https://www.sciencedirect.com/science/article/abs/pii/S1385894725007648]
- 92. A Comparative Analysis Of Adsorption Chromatography ... [https://www.alwsci.com/news/a-comparative-analysis-of-adsorption-chromatog-85222666.html]
- 93. Life After Adsorption: Regeneration, Management, and ... [https://www.mdpi.com/2073-4441/17/19/2813]
- 94. Application of Physical Adsorption and Chemisorption ... [https://link.springer.com/article/10.1134/S0023158424602596]
- 95. Utilizing nature-based adsorbents for removal of ... [https://www.sciencedirect.com/science/article/pii/S2949823625000224]