Surface Analysis Terminology: A Foundational Guide for Drug Development and Biomedical Research
This guide provides researchers, scientists, and drug development professionals with a comprehensive foundation in surface analysis terminology.
Surface Analysis Terminology: A Foundational Guide for Drug Development and Biomedical Research
Abstract
This guide provides researchers, scientists, and drug development professionals with a comprehensive foundation in surface analysis terminology. It bridges the gap between fundamental concepts and practical application, exploring key spectroscopic and microscopic methods, their role in solving real-world R&D challenges like contamination and reproducibility, and their critical application in target validation and biomaterials characterization. The content is structured to enhance the robustness and efficiency of translational research, facilitating better academia-industry collaboration.
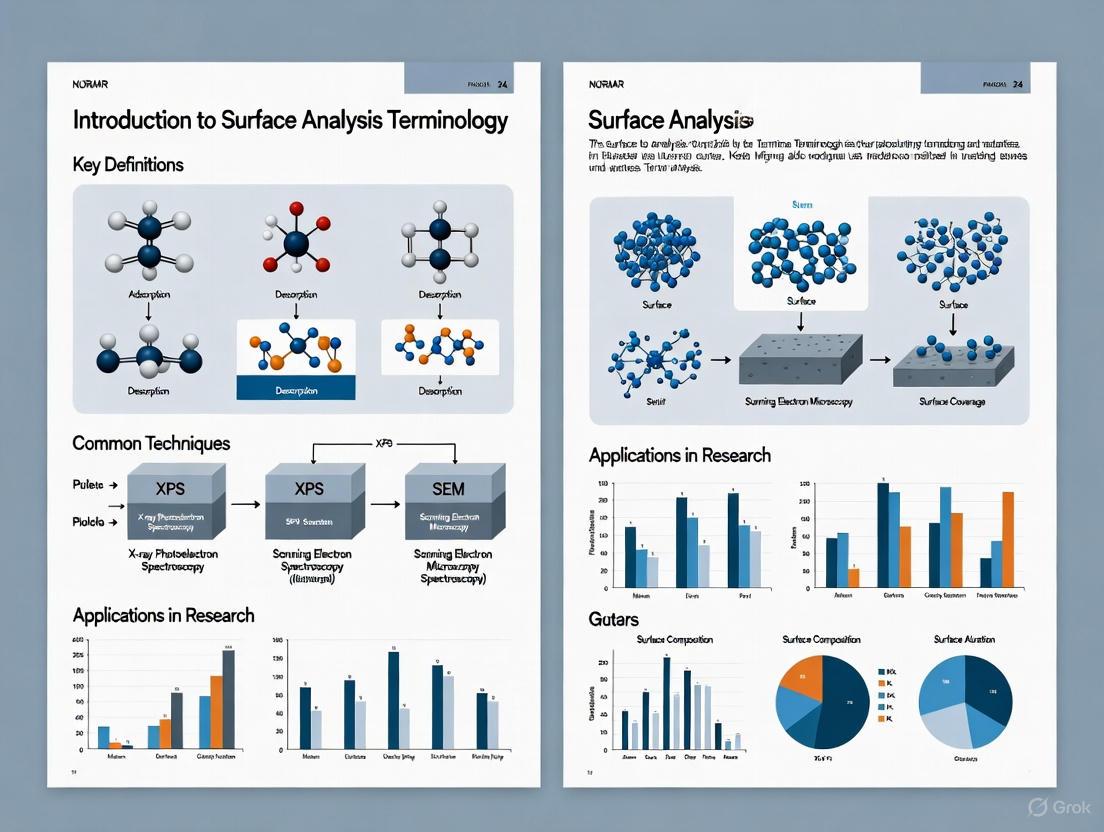
What is Surface Analysis? Core Concepts and Terminology for Scientists
In the realm of materials science and biomaterials, the surface is a unique state of matter that represents the interface between a material and its environment, possessing significantly different compositions and structures from the bulk material [1]. This surface region, often only a minute portion of the entire material, is the first plane of access to another phase and plays a disproportionately critical role in determining material performance. It is the site where essential processes occur, from protein adsorption and cell attachment on biomedical implants to catalytic reactions and corrosion resistance [1]. The primary aims of surface analysis are the quantitative description of surface compositions and microstructures, understanding surface interactions with adjacent phases, and controlling processes to manufacture materials with reproducible surface properties [2].
Defining the surface operationally depends on the analytical context—it can range from the outermost atomic layer in fundamental studies to several micrometers in coatings or even millimeters in metallic artefacts [2]. This article provides a comprehensive framework for understanding surface terminology and analysis, specifically tailored for researchers, scientists, and drug development professionals engaged in characterizing biological and synthetic materials.
Quantitative Dimensions of Surface Analytical Techniques
A wide array of techniques exists for surface characterization, each with specific principles, analytical depths, and spatial resolutions. The selection of an appropriate technique depends on the required information, the nature of the sample, and the specific surface region of interest. The table below summarizes the key characteristics of common surface analysis methods.
Table 1: Comparison of Common Surface Analysis Techniques [2]
| Method | Acronym | Principle | Depth Analyzed | Lateral Resolution |
|---|---|---|---|---|
| X-ray Photoelectron Spectroscopy | XPS | X-rays cause emission of electrons with characteristic energy | 1–25 nm | 10–150 μm |
| Secondary Ion Mass Spectrometry | SIMS | Ion bombardment causes emission of surface secondary ions | 1 nm - 1 μm | 10 nm |
| Auger Electron Spectroscopy | AES | Electron beam causes emission of Auger electrons | 1–25 nm | 10 nm - 1 μm |
| Contact Angle Analysis | CA | Liquid wetting of surfaces estimates surface energy | 0.3–2 nm | ~1 mm |
| Scanning Probe Microscopy | SPM | Measures tunneling current (STM) or van der Waals forces (AFM) | 0.5 nm | 0.1 nm |
| Fourier Transform Infra-red Spectroscopy, Attenuated Total Reflectance | FTIR-ATR | IR radiation adsorption excites molecular vibrations | 1–5 μm | 10 μm |
| Scanning Electron Microscopy | SEM | Focused electron beam causes secondary electron emission | 0.5 nm (info depth) | 4 nm |
| Surface Plasmon Resonance | SPR | Measures refractive index change in an evanescent field | 0.3 μm | 2 μm |
For biological materials, a multi-technique approach is essential, as no single method provides a complete surface characterization [1]. The information from various techniques must be consistent, though measured values (e.g., C/O atomic ratios) may differ due to varying sampling depths. When corrected for these experimental conditions, the results should collectively describe the surface chemistry accurately [1].
Methodological Workflows in Surface Analysis
Effective surface analysis requires carefully designed experimental protocols. The workflows below outline the logical progression for a generalized surface analysis project and the specific steps for sample preparation, which is particularly critical for biological specimens.
Generalized Surface Analysis Workflow
Diagram 1: Surface Analysis Project Workflow
Sample Preparation Protocol
Sample preparation is a critical step, especially for complex biological materials. Contamination control is paramount, as surface atoms are typically more reactive than bulk atoms.
Table 2: Essential Reagents and Materials for Surface Analysis [1]
| Item/Category | Function/Description | Critical Considerations |
|---|---|---|
| Solvent Cleaning | Removes adventitious contaminants | Can deposit residues or alter surface composition; use high-purity solvents. |
| Tweezers | Handling samples | Must be carefully solvent-cleaned; contact only non-analysis regions (e.g., edges). |
| Sample Holders | Securing samples during analysis | Must be contamination-free; can introduce plasticizers or other contaminants. |
| Storage Containers | Storing and shipping samples | Tissue culture polystyrene dishes are often suitable; must be analyzed for contaminants. |
| UHV-Compatible Materials | For XPS, ToF-SIMS analysis | Must maintain integrity under ultra-high vacuum conditions. |
Diagram 2: Sample Handling and Contamination Control
Key contamination sources include hydrocarbons from air exposure, poly(dimethyl siloxane) (PDMS) from various sources, salts from buffer solutions, and oils from hand contact [1]. Different techniques have varying sensitivities to contamination; for example, ToF-SIMS is significantly more sensitive to PDMS than XPS [1].
Practical Considerations for Technical Implementation
Technique Selection and Data Correlation
The first step in surface analysis is clearly defining objectives [1]. XPS is often an excellent starting point as it detects and quantifies all elements except hydrogen and helium, analyzes a wide range of materials, and provides information about chemical states [1]. For biological surfaces, consider the experimental conditions required. Techniques like XPS and ToF-SIMS require ultra-high vacuum (UHV), which can cause surface rearrangement (e.g., hydrophobic enrichment) or denaturation of biological molecules [1]. Whenever possible, use a multi-technique approach and ensure data consistency across methods, accounting for different sampling depths and selection rules.
Visualization and Accessibility Standards
For scientific diagrams and interfaces, ensure sufficient color contrast. The Web Content Accessibility Guidelines (WCAG) recommend:
Table 3: WCAG Color Contrast Requirements [3]
| Content Type | Minimum Ratio (AA) | Enhanced Ratio (AAA) |
|---|---|---|
| Body Text | 4.5:1 | 7:1 |
| Large-Scale Text | 3:1 | 4.5:1 |
| UI Components & Graphics | 3:1 | Not Defined |
These guidelines ensure legibility for users with low vision or color vision deficiencies [4] [5]. The color palette used in this document's diagrams (#4285F4, #EA4335, #FBBC05, #34A853, #FFFFFF, #F1F3F4, #202124, #5F6368) provides sufficient contrast when carefully paired.
The 'surface' is a complex, dynamic region whose definition depends on both the material system and the analytical technique being employed. A rigorous approach to surface analysis—incorporating careful technique selection, meticulous sample preparation, and a multi-technique methodology—is essential for researchers, particularly in drug development and biomaterials science. This ensures reproducible results, reliable device performance, and a fundamental understanding of how surfaces drive biological interactions. As surface analysis instrumentation advances, these methodologies will continue to provide invaluable data for monitoring contamination, ensuring surface reproducibility, and exploring the fundamental interactions between biological systems and engineered materials.
Surface analysis is a critical discipline in materials science and chemistry, providing the means to quantitatively describe surface compositions and microstructures. This understanding is fundamental for controlling manufacturing processes and tailoring product properties, especially in fields like biomaterials and drug development [2]. The surface of a material, typically defined as the layer where composition and properties differ from the bulk, governs essential characteristics including chemical activity, adhesion, wettability, and biocompatibility [2] [6]. However, discussing these concepts requires a precise and standardized vocabulary. This glossary serves as a foundational resource for researchers, offering clear definitions of essential terms and methodologies in surface chemical analysis, framed within the broader context of scientific reproducibility and interdisciplinary communication. Consistent terminology, as maintained by standards organizations like IUPAC and ISO, is crucial for ensuring that research findings are accurately interpreted and replicated across different laboratories and scientific disciplines [7] [8].
Key Concepts and Definitions in Surface Analysis
Fundamental Terms
Surface Chemical Analysis: The use of spectroscopic techniques in which beams of electrons, ions, or photons are incident on a material surface, and scattered or emitted electrons, ions, or photons from within about 10 nm of the surface are detected and analyzed [7]. The primary aim is the quantitative description of surface composition and microstructure [2].
Surface Sensitivity: A characteristic of an analytical technique describing its ability to probe the outermost atomic layers of a material. Many surface-specific techniques analyze signals from a depth of approximately 1-10 nm below the surface [2] [6].
Adventitious Carbon: An unavoidable, contaminating layer of organic carbon and oxygen present on almost all surfaces exposed to the atmosphere. This layer must often be considered or removed for accurate analysis [2].
Depth Profiling: A technique used to examine the composition of a material as a function of depth beneath the surface. This is often accomplished by using ion sputtering (e.g., Ar⁺ ions) to progressively remove surface layers while simultaneously performing analysis on the newly exposed material [6].
Ultra-High Vacuum (UHV): A necessary environment for many surface analysis techniques, with pressures typically at or below 10⁻⁸ Pa. UHV ensures that surfaces remain free from contamination for a time sufficient to perform the analysis by reducing the rate of adsorption of gas molecules onto the sample surface [2] [6].
Quantifiable Surface Properties
Contact Angle: The angle formed between a liquid-solid interface and a liquid-vapor interface. It is a direct measure of the wettability of a solid surface by a liquid and is used to estimate the surface energy [2]. A small contact angle indicates high wettability, while a large angle indicates low wettability. The analysis depth for contact angle measurements is typically 0.3–2 nm [2].
Surface Energy: The excess energy at the surface of a material compared to its bulk. It quantifies the disruption of intermolecular bonds that occurs when a surface is created and is a critical factor in phenomena like adhesion, adsorption, and reactivity.
Major Surface Analysis Techniques
Spectroscopic Methods
The following table summarizes the core characteristics of the primary surface analysis techniques.
Table 1: Core Surface Analysis Techniques and Characteristics
| Technique | Acronym | Principle | Depth Analyzed | Lateral Resolution | Key Information |
|---|---|---|---|---|---|
| X-ray Photoelectron Spectroscopy | XPS | X-rays cause the emission of electrons of characteristic energy via the photoelectric effect. | 1–25 nm [2] | 10–150 μm [2] | Elemental composition, chemical bonding states [6] |
| Auger Electron Spectroscopy | AES | Electron beams generate Auger electrons, which are analyzed for energy. | ~5 nm [2] | < 1 μm (high spatial resolution) [6] | Elemental composition, high-resolution mapping of surfaces and micro-contaminants [6] |
| Secondary Ion Mass Spectrometry | SIMS | Ion bombardment leads to the emission of surface secondary ions. | 1 nm - 1 μm [2] | Down to 10 nm [2] | Trace elemental and molecular identification, high-sensitivity inorganic and organic analysis [2] [6] |
| Time-of-Flight Secondary Ion Mass Spectrometry | TOF-SIMS | A variant of SIMS that uses a pulsed primary ion beam and measures the time-of-flight of secondary ions for mass determination. | ~1 nm (extreme surface sensitivity) [6] | Sub-micron | Molecular mass information from organic compounds, high-sensitivity inorganic element analysis, imaging of organic matter distribution [6] |
| Fourier Transform Infrared Spectroscopy-Attenuated Total Reflectance | FTIR-ATR | IR radiation is adsorbed, exciting molecular vibrations at a surface in contact with an internal reflection element. | 1–5 μm [2] | ~10 μm [2] | Molecular bonding and functional group identification. |
Microscopic and Other Methods
- Scanning Probe Microscopy (SPM): A family of techniques that measure physical interactions between a sharp probe and a surface to map topography and properties. This includes:
- Scanning Electron Microscopy (SEM): Uses a focused electron beam to generate secondary electrons from a surface, providing high-resolution topographical images with a depth of analysis around 0.5 nm and spatial resolution down to 4 nm [2].
- 3D Contact Angle Method: An advanced optical method for measuring wettability. Unlike conventional 2D shadow-image methods, it reconstructs a digital 3D model of a sessile drop from a top-view perspective, eliminating the need for manual baseline adjustment and providing robust, automated results suitable for quality control [9].
The relationships between these primary techniques, their probes, and the signals they detect can be visualized through the following experimental workflow.
The Researcher's Toolkit: Essential Reagents and Materials
Successful surface analysis requires not only sophisticated instrumentation but also a suite of specialized reagents and materials for sample preparation, calibration, and analysis.
Table 2: Essential Research Reagents and Materials for Surface Analysis
| Item/Solution | Function in Surface Analysis |
|---|---|
| Standard Reference Materials | Calibrate instrument intensity and energy scales, verify spatial resolution, and validate analytical protocols. Crucial for quantitative analysis and inter-laboratory reproducibility. |
| Ultra-Pure Solvents | Used for sample cleaning and preparation to remove adventitious carbon and other contaminants without leaving residues that could interfere with analysis. |
| Sputter Ion Source (e.g., Ar⁺) | The core component for depth profiling, used to erode the surface atom-by-atom to reveal sub-surface composition. Cesium (Cs⁺) or cluster ion sources are often used for organic materials [6]. |
| Conductive Adhesive Tapes/Coatings | Used to mount non-conductive samples to prevent charging effects during analysis with electron or ion beams. Coatings (e.g., thin carbon or gold films) may be applied for the same purpose. |
| Certified Calibration Gases | Used in specialized surface analysis chambers to introduce specific reactive gases for in-situ experiments studying surface reactions, oxidation, or corrosion. |
Detailed Experimental Protocols in Surface Analysis
Protocol: X-ray Photoelectron Spectroscopy (XPS) Analysis
Objective: To determine the elemental composition and chemical bonding states of the top 1-10 nm of a solid sample surface.
Methodology:
- Sample Preparation: The solid sample is introduced into the ultra-high vacuum (UHV) chamber of the XPS instrument. Samples must be stable under vacuum. Non-conductive samples may require charge neutralization using a low-energy electron flood gun.
- Instrument Calibration: The spectrometer work function and binding energy scale are calibrated using a standard reference material, typically clean gold (Au) or copper (Cu) foil. The Au 4f₇/₂ peak is set to a binding energy of 84.0 eV.
- Data Acquisition:
- The sample is irradiated with a monochromatic or non-monochromatic X-ray beam (e.g., Al Kα or Mg Kα).
- Emitted photoelectrons are collected by an electron energy analyzer, which measures their kinetic energy. This is converted to binding energy using the equation: Binding Energy = Photon Energy - Kinetic Energy - Work Function.
- A wide (or survey) scan is first acquired to identify all elements present.
- High-resolution regional scans are then performed for each element of interest to determine its chemical state (e.g., oxidation state, functional group).
- Data Analysis: Elemental identification is performed from the survey scan. Chemical state information is derived from the precise binding energy and peak shape in the high-resolution spectra. Quantification is based on the integrated peak areas and relative sensitivity factors.
Protocol: 3D Contact Angle Measurement
Objective: To robustly and automatically measure the wettability of a surface via the contact angle without manual baseline adjustment.
Methodology:
- Sample Preparation: The solid surface is cleaned and mounted horizontally. The method is particularly suitable for quality control of pretreated, cleaned, or coated surfaces [9].
- Instrument Setup: A compact handheld device with an integrated dosing unit and a spherical hood-shaped measuring head containing 90 LEDs and two cameras is used [9].
- Data Acquisition:
- A drop of water (or other test liquid) is dosed onto the sample surface.
- The LEDs in the measuring head generate different light patterns in rapid succession. The reflections from the droplet's surface are captured by the two cameras.
- Two laser distance detectors simultaneously collect height information.
- Data Analysis:
- An algorithm reconstructs a digital spatial image of the droplet, including its height and curvature, from the reflection patterns and laser data.
- The contact angle is determined directly from this 3D model, eliminating the need to manually find the baseline between the droplet and the solid surface [9].
- The result is checked for plausibility and consistency, and a pass/fail message is displayed based on pre-set limits for the sample type [9].
The Critical Role of Surface Analysis in Biomedical Applications and Drug Discovery
Surface analysis encompasses a suite of analytical techniques specifically designed to characterize the outermost layers of a material, typically the top 1-100 nanometers [1]. This region, the interface between a material and its environment, plays a disproportionately large role in determining biological responses. In the context of biomaterials and drug discovery, the surface is the primary site for protein adsorption, cell attachment, and molecular recognition events [1]. Since the surface region constitutes only a minute portion of the entire material, specialized techniques are required to selectively probe its composition and structure, separating the weak surface signal from the overwhelming bulk background [1].
The fundamental challenge in biomedical surface analysis lies in the complexity and fragility of biological interfaces. These surfaces are often dynamic, with components that can migrate and reorganize in response to their environment [2]. Furthermore, samples require meticulous preparation and handling to avoid contamination from ubiquitous sources such as hydrocarbons, poly(dimethyl siloxane) (PDMS), salts, and oils, which can readily adsorb to surfaces and obscure true surface characteristics [1]. A multi-technique approach is invariably necessary, as no single method can provide a complete characterization of a biological surface [1].
Essential Surface Analysis Techniques
A range of techniques is available for surface characterization, each with unique principles, information outputs, and depth sensitivities. The selection of an appropriate technique or suite of techniques depends on the specific information required, such as elemental composition, chemical state, or molecular structure.
Table 1: Common Surface Analysis Techniques in Biomedical Research
| Technique | Acronym | Principle | Information Provided | Depth Analyzed |
|---|---|---|---|---|
| X-ray Photoelectron Spectroscopy [2] [1] | XPS | X-rays cause emission of electrons with characteristic kinetic energy. | Elemental composition, chemical state, empirical formula. | 1-25 nm [2] |
| Time-of-Flight Secondary Ion Mass Spectrometry [1] | ToF-SIMS | Ion bombardment leads to emission of secondary ions from the surface. | Elemental and molecular structure, identification of contaminants. | ~1 nm [2] |
| Surface-Enhanced Raman Spectroscopy [10] [11] | SERS | Inelastic scattering of light enhanced by plasmonic nanostructures. | Molecular fingerprint, chemical bonding, structural information. | Single molecule sensitivity [10] |
| Scanning Probe Microscopy [2] | SPM | Measures quantum tunneling current or van der Waals forces between tip and surface. | Surface topography, morphology, and nanoscale structure. | 0.5 nm [2] |
| Contact Angle Analysis [2] | - | Measures liquid wetting of a surface. | Surface energy, hydrophilicity/hydrophobicity. | 0.3-2 nm [2] |
Advanced and Integrated Techniques
Recent advancements have seen the integration of multiple techniques to overcome individual limitations. Notably, the combination of Surface-Enhanced Raman Spectroscopy (SERS) with artificial intelligence (AI) and microfluidic technologies represents a transformative approach for biomedical applications [11]. SERS provides unparalleled sensitivity for molecular detection, while AI-driven spectral analysis can discern intricate patterns in complex data for disease classification [10] [11]. Microfluidics enables precise sample handling and analysis with minimal volumes, facilitating the development of portable, cost-effective diagnostic platforms for point-of-care settings [11].
Experimental Protocols for Surface Analysis
Robust experimental protocols are critical for generating reliable and reproducible surface analysis data. The following methodologies outline general best practices and a specific protocol for SERS-based analysis.
General Sample Preparation and Handling Protocol
- Objective Definition: Clearly define the surface analysis objectives (e.g., "quantify the elemental surface composition of a polymer coating" or "identify protein contaminants on a medical device") [1].
- Technique Selection: Based on the objective, select the appropriate technique(s). XPS is often a good starting point for determining general surface elemental composition [1].
- Sample Handling:
- Never touch the surface to be analyzed with bare hands or any unverified tool [1].
- Use only carefully solvent-cleaned tweezers, and only contact regions that will not be analyzed (e.g., sample edges) [1].
- Avoid exposure to solvents unless it is part of a controlled experiment, as rinsing can deposit contaminants or alter surface composition [1].
- Sample Storage and Shipping: Store and ship samples in clean containers, such as tissue culture polystyrene dishes, after first verifying the containers are free of contaminants like plasticizers [1].
- Data Acquisition and Validation: Perform analysis with the selected techniques. Use a multi-technique approach to confirm findings, ensuring all information from various methods provides a consistent interpretation of the sample's surface properties [1].
Protocol for SERS-Based Biomarker Detection Integrated with Microfluidics and AI
This protocol highlights a cutting-edge application for ultrasensitive diagnostic detection [11].
- Substrate Fabrication: Fabricate a plasmonic SERS substrate (e.g., gold or silver nanoparticles) with controlled "hotspots"—nanogaps between 0.5-1.0 nm—to achieve maximum Raman enhancement [10] [12].
- Functionalization: Immobilize specific capture probes (e.g., antibodies, aptamers) onto the SERS substrate to selectively bind the target biomarker (e.g., proteins, nucleic acids) [10].
- Microfluidic Integration and Sample Introduction: Load the functionalized substrate into a microfluidic chip. Introduce the liquid biopsy sample (e.g., blood, saliva) into the chip. The microfluidic channels precisely control the flow, directing the sample over the SERS-active surface and concentrating analytes near the plasmonic hotspots [11].
- Washing and Signal Acquisition: Flush the chip with a buffer solution to remove unbound molecules. Illuminate the detection area with a laser and collect the SERS spectra from the captured biomarkers [11].
- AI-Enhanced Data Analysis:
- Preprocessing: Digitize the raw spectral data and apply denoising algorithms [12].
- Model Training and Classification: Input the preprocessed spectra into a pre-trained deep learning model (e.g., a convolutional neural network). The AI algorithm classifies the spectral data, identifying specific molecular fingerprints associated with a disease state (e.g., cancer vs. non-cancer) with high accuracy [10] [11].
The following workflow diagram illustrates the integrated SERS-based detection process:
The Scientist's Toolkit: Key Research Reagent Solutions
Successful surface analysis relies on a suite of specialized materials and reagents. The following table details essential components for experiments, particularly those involving SERS and general surface characterization.
Table 2: Essential Research Reagents and Materials for Surface Analysis
| Item | Function/Description | Key Application |
|---|---|---|
| Plasmonic Nanoparticles [10] | Gold or silver nanoparticles that create localized surface plasmon resonances to enhance Raman signals. | Core material for constructing SERS substrates and nanotags. |
| SERS Nanotags [12] | Engineered nanoparticles with an interior gap, a Raman reporter molecule, and a biomimetic coating. | Highly sensitive and specific labeling for in vivo imaging and multiplexed detection. |
| Capture Probes [10] | Antibodies, aptamers, or oligonucleotides immobilized on a surface to bind specific target analytes. | Functionalization of SERS substrates and biosensors for selective biomarker capture. |
| Microfluidic Chip [11] | A lab-on-a-chip device with micron-scale channels for precise fluid manipulation and analysis. | Enables automated, high-throughput SERS analysis with minimal sample volume. |
| AI/ML Analysis Software [10] [11] | Software packages implementing machine learning (e.g., deep learning) algorithms for spectral analysis. | Pattern recognition and classification of complex SERS spectral data for diagnostics. |
Applications in Drug Discovery and Biomedical Research
Surface analysis techniques are indispensable at multiple stages of drug discovery and development, from initial material characterization to final diagnostic application.
Biomaterial Compatibility and Performance: Surface analysis is critical for predicting the performance of implantable biomaterials and drug delivery systems. Techniques like XPS and ToF-SIMS verify surface modifications, monitor contamination, and ensure reproducibility. Understanding surface composition helps explain phenomena such as protein adsorption, cell attachment, and the rate of enzymatic reactions at a biomaterial interface [2] [1].
Ultrasensitive Diagnostic Assays: The integration of SERS with microfluidics and AI is revolutionizing diagnostic assays. These platforms are being developed for liquid biopsy applications, including the detection of circulating tumor cells, extracellular vesicles, and specific nucleic acid sequences for cancer diagnosis [11] [12]. The unparalleled sensitivity of SERS allows for the detection of disease biomarkers at ultra-low concentrations, enabling early diagnosis [11].
Antibiotic Susceptibility Testing: SERS-based platforms, combined with machine learning, enable rapid antibiotic susceptibility testing. This allows for the quick identification of resistant bacterial strains like Staphylococcus aureus, guiding effective treatment decisions and combating antimicrobial resistance [11].
Future Directions and Challenges
The field of surface analysis continues to evolve, driven by technological convergence and unmet clinical needs. Key future trends include the development of multimodal sensing platforms that combine SERS with other analytical techniques, the use of sustainable and biocompatible materials for substrate fabrication, and the implementation of embedded AI for real-time, point-of-care diagnostics [11].
Despite the significant progress, challenges remain. Reproducibility in substrate fabrication, comprehensive clinical validation of new platforms, and the full integration of systems for seamless operation are significant hurdles to widespread clinical adoption [11] [12]. Furthermore, the inherent complexity of biological samples and the potential for surface contamination demand rigorous sample handling protocols and a multi-technique analytical approach to ensure data accuracy and reliability [1]. As these challenges are addressed, surface analysis will undoubtedly deepen its critical role in advancing biomedical research and drug discovery.
Key Surface Analysis Techniques: Principles, Applications, and Methodologies
Surface analysis is a critical discipline in materials science, chemistry, and biology, aiming to determine the structure and properties of surfaces with resolution at the atomic or molecular level. The fundamental goal is to identify all atoms and molecules present on a surface at concentrations above approximately 0.1–1% and understand their spatial arrangement. For nanoscale objects, surface properties become particularly significant because these structures are essentially "all surface," with surface forces dominating their interactions and behavior. Most surface properties are determined by atoms located within the top few atomic layers (within a few nanometers of the surface), making precise characterization techniques essential for advanced research and development [13].
Scanning probe microscopy (SPM) represents a family of techniques that revolutionized surface science by enabling researchers to image and manipulate individual atoms and molecules on surfaces. The development of these techniques began with the scanning tunneling microscope (STM) in the early 1980s, followed shortly by the atomic force microscope (AFM). These instruments, along with established electron microscopy techniques like scanning electron microscopy (SEM), provide complementary approaches for nanoscale structural imaging. Each technique offers unique capabilities, limitations, and application domains, making the selection of the appropriate method crucial for addressing specific research questions in surface science [14] [13].
This technical guide provides an in-depth examination of three principal techniques for structural imaging: STM, AFM, and SEM. We explore their fundamental principles, operational methodologies, key applications, and technical specifications to enable researchers to select the most appropriate technique for their specific surface analysis requirements.
Fundamental Principles and Instrumentation
Scanning Tunneling Microscopy (STM)
STM operates based on the quantum mechanical phenomenon of electron tunneling. When a sharp metallic tip is brought into very close proximity (typically less than 1 nm) to a conducting surface, and a bias voltage is applied between them, electrons can tunnel through the vacuum barrier separating the two. This tunneling current is extraordinarily sensitive to the tip-sample separation, with an exponential dependence on the distance. This sensitivity enables the detection of vertical variations of less than 0.1 Å, facilitating atomic-scale resolution imaging [14] [15].
The STM instrument consists of several key components: a sharp metallic tip, precise piezoelectric positioning elements that enable sub-atomic precision movement in x, y, and z directions, vibration isolation systems, electronic controls for applying bias voltage, and a sensitive current amplifier for detecting the tiny tunneling currents (typically in the nanoampere range). The tip preparation is crucial for achieving atomic resolution; ideally, the tip should terminate in a single atom at its closest point of approach to the surface [14] [15].
STM can operate in two primary imaging modes. In constant-height mode, the tip is scanned at a fixed height above the surface while variations in tunneling current are recorded. This mode enables faster scanning but risks tip or sample damage due to potential collisions with surface features. In constant-current mode, a feedback loop continuously adjusts the tip height to maintain a constant tunneling current during scanning. The recorded z-position of the tip creates a topographic map of the surface. This mode is more commonly used as it provides direct topographic information and minimizes contact forces [14].
Atomic Force Microscopy (AFM)
AFM expands upon the SPM concept by measuring forces between a sharp probe and the sample surface, rather than relying on tunneling current. This fundamental difference allows AFM to image both conducting and non-conducting samples. The core component of an AFM is a flexible cantilever with a sharp tip (probe) at its end, typically fabricated from silicon or silicon nitride with a tip radius of curvature on the nanometer scale. As the tip approaches the surface, forces between the tip and sample cause cantilever deflection according to Hooke's law. These forces can include mechanical contact force, van der Waals forces, capillary forces, chemical bonding, electrostatic forces, and magnetic forces [16].
The detection system measures cantilever deflection using various methods, with optical lever systems (a laser beam reflected from the cantilever onto a position-sensitive photodetector) being most common. Other detection methods include interferometry, piezoelectric sensing, and STM-based detectors. The sample or tip is mounted on a piezoelectric scanner that enables precise three-dimensional positioning. Sophisticated electronic feedback systems maintain constant imaging parameters during operation [16].
AFM offers multiple operational modes, primarily categorized into:
- Contact mode: The tip scans in physical contact with the sample surface, sensing repulsive forces.
- Non-contact mode: The tip oscillates close to the surface without touching it, sensing attractive van der Waals forces.
- Tapping mode: The cantilever oscillates at or near its resonance frequency, lightly tapping the surface during scanning, which reduces lateral forces and minimizes sample damage [16].
Scanning Electron Microscopy (SEM)
SEM utilizes a focused beam of high-energy electrons to scan across a sample surface, generating various signals from electron-sample interactions. When the primary electron beam strikes the sample, it produces secondary electrons, backscattered electrons, and characteristic X-rays. Detectors capture these signals to form images or provide compositional information. Secondary electrons are most commonly used for topographic imaging as their intensity depends strongly on surface orientation relative to the detector. Backscattered electrons provide compositional contrast since their yield increases with atomic number, while characteristic X-rays enable elemental analysis through energy-dispersive X-ray spectroscopy (EDS) [17] [18].
Key components of an SEM include an electron source (thermionic or field emission gun), electromagnetic lenses for focusing the electron beam, scanning coils for rastering the beam across the sample, various detectors for different signal types, a vacuum system to prevent electron scattering by gas molecules, and specialized electronics for signal processing and image display. Modern SEMs can achieve resolution down to 1-10 nanometers, depending on the instrument design and operating conditions [17] [18].
Unlike SPM techniques, SEM requires samples to be conductive or coated with a thin conductive layer to prevent charging effects under electron bombardment. Biological samples often require dehydration and fixation to maintain structural integrity under vacuum conditions, though environmental SEM (ESEM) allows imaging of hydrated samples under lower vacuum conditions [18].
Technical Comparison and Operational Guidelines
Comparative Performance Analysis
Table 1: Technical comparison of STM, AFM, and SEM for structural imaging
| Criterion | STM | AFM | SEM |
|---|---|---|---|
| Resolution | Atomic lateral (0.1-0.2 nm) | Sub-nanometer vertical, lateral <1-10 nm | Lateral: 1-10 nm; no quantitative vertical data |
| Sample Requirements | Electrically conductive | Any solid material; minimal preparation | Conductive or coated; moderate preparation |
| Operating Environment | UHV, liquid, or controlled atmosphere | Air, vacuum, liquids, controlled atmospheres | High vacuum typically (ESEM allows lower vacuum) |
| Primary Applications | Atomic-scale topography of conductors, electronic structure | Topography, mechanical, electrical properties | Surface morphology, elemental composition |
| Imaging Speed | Slow | Slow to moderate | Fast (high throughput) |
| Key Limitations | Conducting samples only; atomic cleanliness often required | Limited scan area; tip convolution effects | Vacuum requirement; sample charging issues |
Decision Framework for Technique Selection
Choosing the appropriate nanoscale imaging technique requires careful consideration of multiple factors aligned with research objectives:
Define Research Goals: Identify whether the primary need is surface topography, internal structure, material properties, or compositional analysis. STM provides unparalleled electronic structure information for conductors, AFM excels in topographical and mechanical property mapping, while SEM offers efficient surface morphology imaging with elemental analysis capabilities [18].
Evaluate Sample Characteristics: Determine if the sample is conductive (compatible with STM and SEM) or non-conductive (requires AFM or coating for SEM). Consider sensitivity to vacuum conditions – AFM operates in various environments including liquids, while conventional SEM and TEM require vacuum. Assess whether the sample can withstand preparation processes without alteration [18].
Resolution Requirements: Establish necessary resolution scale. Atomic resolution is achievable with STM and AFM under optimal conditions, while SEM typically provides nanometer-scale resolution. For quantitative topographical information with sub-nanometer vertical resolution, AFM is superior [18].
Environmental Conditions: Select techniques compatible with required experimental conditions. AFM offers maximum flexibility for imaging in air, controlled atmospheres, or liquid environments. STM can operate in various environments but typically requires clean surfaces. SEM generally requires vacuum, with ESEM providing limited environmental capability [18].
Data Acquisition Needs: Balance detailed analysis requirements with throughput efficiency. SEM provides rapid imaging over large areas, making it suitable for screening multiple samples. AFM and STM offer higher resolution but slower scanning speeds, ideal for detailed analysis of specific regions [18].
Experimental Protocols and Methodologies
STM Experimental Protocol
Sample Preparation: For atomic-resolution imaging, conducting samples must be atomically clean. Preparation methods include argon ion sputtering followed by annealing in ultra-high vacuum (UHV), cleavage in UHV, or molecular beam epitaxy growth. The sample is then transferred to the STM stage without breaking vacuum [14] [15].
Tip Preparation: Electrochemically etched tungsten or platinum-iridium tips are commonly used. Tips are often cleaned in UVA via electron bombardment or ion sputtering to remove contaminants. A truly atomic tip is often achieved through serendipity during initial approach [14].
Approach Procedure: The tip is carefully approached toward the sample surface using coarse motor controls until tunneling range is established (typically indicated by a tunneling current of 0.1-10 nA at bias voltages of 10 mV-2 V). This process must be controlled to avoid tip-sample collisions [15].
Imaging Parameters: Set appropriate bias voltage (determines which electronic states contribute to imaging) and tunneling current setpoint (controls tip-sample separation). For spectroscopy measurements, bias voltage is typically ramped while recording current at fixed height [15].
Data Acquisition: Select scan size and speed commensurate with desired resolution and stability. Slow scan speeds are necessary for atomic resolution. The feedback loop parameters (proportional and integral gains) must be optimized for stable imaging without oscillations [15].
AFM Experimental Protocol
Sample Preparation: AFM requires minimal sample preparation. Samples can be imaged in their native state, though smooth, flat surfaces yield better resolution. For biological samples in liquid, appropriate buffers are used to maintain physiological conditions [16] [18].
Cantilever Selection: Choose appropriate cantilever based on operational mode and sample properties. Soft cantilevers (low spring constant) are used for contact mode on soft samples, while stiffer cantilevers are preferred for tapping mode. Cantilevers with reflective gold coating are necessary for optical lever detection [16].
Engagement Procedure: Approach the tip to the surface while monitoring the deflection signal. Set appropriate deflection setpoint for contact mode or oscillation amplitude for dynamic modes to establish stable tip-sample interaction [16].
Optimization: Adjust feedback parameters (gains, setpoints) for optimal imaging performance. Excessive gains cause oscillation, while insufficient gains result in poor surface tracking. Scan speed must be adjusted based on feature size and complexity [16].
Data Collection: Acquire images typically of 256×256 to 512×512 pixels. Multiple areas should be imaged to ensure representative sampling. Simultaneous channels (height, deflection, phase) provide complementary information [16].
SEM Experimental Protocol
Sample Preparation: Non-conductive samples require coating with a thin (5-20 nm) conductive layer (gold, platinum, or carbon) using sputter coating or evaporation. Biological samples often require fixation, dehydration, and critical point drying to preserve structure under vacuum [18].
Loading and Alignment: Mount sample on appropriate stub using conductive adhesive. Insert into SEM chamber and establish high vacuum. Align electron column following manufacturer protocols to optimize beam alignment and stigmation [17].
Imaging Parameters Selection: Choose appropriate accelerating voltage (typically 1-30 kV) – lower voltages reduce penetration depth and charging effects but may reduce resolution. Select probe current suitable for desired signal-to-noise ratio and resolution [17].
Image Acquisition: Adjust working distance (sample to final lens distance) to optimize resolution and depth of field. Use appropriate scan speed and frame averaging to reduce noise. Capture images from multiple areas and at various magnifications to fully characterize samples [17].
Elemental Analysis: For EDS analysis, increase accelerating voltage to excite characteristic X-rays from elements of interest. Collect spectra from multiple points or areas to ensure representative sampling. Use standardless or standards-based quantification for compositional analysis [17].
Advanced Applications and Integration in Research
Research Applications Across Disciplines
Each imaging technique finds specialized applications across various scientific disciplines:
STM Applications:
- Surface reconstruction studies of semiconductors and metals
- Molecular adsorption and self-assembly on conductive substrates
- Nanoscale manipulation of atoms and molecules
- Electronic property mapping through scanning tunneling spectroscopy (STS)
- Defect characterization in conducting materials
- Electrode surface characterization in electrochemistry
AFM Applications:
- Biomolecular imaging (proteins, DNA, membranes) in near-physiological conditions
- Polymer surface characterization and phase imaging
- Nanomechanical property mapping (elasticity, adhesion, hardness)
- Semiconductor metrology (step height, roughness measurements)
- Chemical force mapping with functionalized tips
- Live cell imaging and mechanical property assessment
SEM Applications:
- Microstructural characterization of materials
- Fracture surface analysis in failure analysis
- Particle size and morphology studies
- Elemental composition mapping via EDS
- Microfabrication process control in semiconductor industry
- Biological ultrastructure imaging (after appropriate preparation)
The Scientist's Toolkit: Essential Research Reagents and Materials
Table 2: Key research reagents and materials for microscopic and probe methods
| Item | Function | Application Context |
|---|---|---|
| Conductive Adhesive Tapes/Carbon Paints | Mounting samples to SEM stubs; ensuring electrical conductivity | SEM sample preparation |
| Sputter Coater with Gold/Palladium Targets | Applying thin conductive coatings to non-conductive samples | Preventing charging in SEM imaging |
| Critical Point Dryer | Removing solvent from biological samples without structural collapse | SEM preparation of biological specimens |
| Silicon/Silicon Nitride Cantilevers | AFM probes for sensing tip-sample interactions | AFM imaging across various modes |
| Electrochemically Etched Tungsten Tips | STM probes for tunneling current detection | STM imaging of conductive surfaces |
| Precision Piezoelectric Positioners | Sub-nanometer precision positioning of probe or sample | All SPM techniques (STM, AFM) |
| Vibration Isolation Systems | Minimizing environmental vibrational noise | High-resolution SPM and SEM |
| Ultra-High Vacuum Systems | Creating necessary operating environment | STM and high-resolution SEM |
Integrated Characterization Approaches
Modern materials research increasingly employs multiple complementary techniques to obtain comprehensive understanding of sample properties. For example:
Correlative Microscopy: Combining AFM with optical microscopy or SEM enables correlation of nanoscale mechanical properties with structural features identified through other modalities.
SPM-Spectroscopy Combinations: Integrating STM with spectroscopy methods (STS) provides simultaneous topographic and electronic structure information. Similarly, AFM can be combined with infrared spectroscopy (AFM-IR) for nanoscale chemical identification [19].
In-situ and Operando Studies: AFM and SEM can be equipped with specialized stages for studying materials under controlled environments (temperature, gas atmosphere, liquid cells), enabling real-time observation of dynamic processes such as catalysis, corrosion, or biological interactions [19] [15].
These integrated approaches are particularly powerful for studying complex functional materials such as metal-organic frameworks (MOFs), coordination networks, and hybrid organic-inorganic systems, where structure-property relationships operate across multiple length scales [19].
Operational Visualizations
STM Operational Principle
AFM Operational Principle
Technique Selection Workflow
In analytical chemistry, surface analysis is the study of the part of a solid that is in contact with a gas or a vacuum [20]. This region, or interface, is critically important because its composition and properties are often different from those of the bulk material. These differences arise from interactions with the environment and can dictate key material properties, from the corrosion resistance of stainless steel to the biocompatibility of a medical implant [2] [20]. Operationally, the "surface" is defined as the region of a solid that differs from the bulk, which can range from a single atomic layer to thicknesses of hundreds of nanometers [20].
The primary aims of surface analysis are to provide a quantitative description of surface composition and microstructure, to understand how surfaces interact with their environment, and to use this data to control manufacturing processes and tailor product properties [2]. Selecting the appropriate analytical technique is therefore crucial, as the choice depends on the specific depth of interest and the type of information required. No single technique is sufficient for all problems; often, a combination of methods providing complementary information is needed to solve complex real-world challenges [20].
Core Concepts: Sampling Depth, Resolution, and Data Output
Understanding the core terminology is essential for selecting the right analytical tool.
- Sampling Depth: This refers to the depth into the solid from which the analytical signal originates. It is determined by either the penetration depth of the incident beam, the escape depth of the exiting beam, or both. This depth varies dramatically with the type of probe particle used [20]. For instance, photons, electrons, and ions of 1 keV energy have typical sampling depths of approximately 1000 nm, 2 nm, and 1 nm, respectively [20].
- Lateral Resolution: This denotes the smallest distance between two features on the surface that the technique can distinguish. It defines the ability to create detailed spatial maps of surface composition [2].
- Data Output: This describes the nature of the information the technique provides, such as elemental composition, chemical state information, molecular structure, or topographical images [2] [20].
Comparative Analysis of Surface Analysis Techniques
The following table summarizes the key characteristics of common surface analysis techniques to facilitate comparison.
Table 1: Comparison of Common Surface Analysis Techniques
| Technique | Acronym | Principle of Operation | Sampling Depth | Lateral Resolution | Primary Data Output |
|---|---|---|---|---|---|
| X-ray Photoelectron Spectroscopy [2] [20] | XPS/ESCA | X-rays cause emission of electrons with characteristic energy [2]. | 1–25 nm [2] | 10–150 μm [2] | Elemental composition, chemical state, and empirical formula [20]. |
| Secondary Ion Mass Spectrometry [2] [20] | SIMS | Ion bombardment leads to emission of surface secondary ions [2]. | 1 nm - 1 μm [2] | ≥ 10 nm [2] | Elemental and molecular composition, isotopic ratios, depth profiling [20]. |
| Auger Electron Spectroscopy [20] | AES | A focused electron beam causes emission of Auger electrons [20]. | ~2 nm (for 1 keV electrons) [20] | ~4 nm (in SEM mode) [2] | Elemental composition, surface mapping [20]. |
| Ion Scattering Spectroscopy [20] | ISS | Ions scatter off the first atomic layer of the surface [20]. | ~1 nm (monolayer) [20] | Varies | Composition of the outermost atomic layer [20]. |
| Fourier Transform Infrared Spectroscopy [2] | FTIR-ATR | IR radiation is absorbed, exciting molecular vibrations [2]. | 1–5 μm [2] | ~10 μm [2] | Molecular functional groups and chemical bonds [2]. |
| Scanning Probe Microscopy [2] | SPM | Measures quantum tunneling current (STM) or van der Waals forces (AFM) between tip and surface [2]. | 0.5 nm [2] | 0.1 nm [2] | Surface topography and physical properties at atomic-scale resolution [2]. |
| Scanning Electron Microscopy [2] | SEM | Secondary electron emission caused by a focused electron beam is measured and imaged [2]. | 0.5 nm [2] | ~4 nm [2] | High-resolution topographical imaging of surfaces [2]. |
| Contact Angle Analysis [2] | N/A | Liquid wetting of surfaces is used to estimate surface energy [2]. | 0.3–2 nm [2] | ~1 mm [2] | Surface energy and wettability [2]. |
Experimental Protocols for Surface Analysis
Reproducible surface analysis requires careful experimental design and execution. The following workflow outlines a general protocol for characterizing a solid surface, from sample preparation to data interpretation.
Diagram 1: Surface Analysis Workflow
1. Sample Preparation
- Cleaning: Remove adventitious carbon and other contaminants using solvents, plasma cleaning, or sputtering. Surfaces readily contaminate, and a consistent cleaning protocol is critical for reproducible results [2].
- Stabilization: Ensure the sample is stable under the analysis conditions. For techniques requiring ultra-high vacuum (UHV), verify that the sample does not outgas or decompose [2].
2. Technique Selection & Calibration
- Selection: Choose the technique(s) based on the required information (elemental, chemical, molecular), necessary sampling depth, and required spatial resolution, as detailed in Table 1.
- Calibration: Calibrate the instrument's energy or mass scale using standard reference materials. For spatial resolution, use calibration gratings.
3. Data Acquisition & Processing
- Acquisition: Collect data under optimized parameters (e.g., beam energy, scan area, acquisition time). To minimize beam damage, use the lowest beam current and shortest time that provide sufficient signal.
- Processing: Apply necessary data processing steps, which may include background subtraction, noise filtering, peak fitting, and spectral deconvolution.
4. Data Interpretation
- Analysis: Interpret the processed data to determine composition, chemical states, and morphology. Compare against databases of reference spectra.
- Reporting: Report findings alongside all relevant experimental parameters to ensure the work is reproducible.
The Scientist's Toolkit: Essential Reagent Solutions
Table 2: Essential Materials and Reagents for Surface Analysis
| Item | Function / Purpose |
|---|---|
| Standard Reference Materials | Used for quantitative calibration of instruments and validation of analytical results. Examples include gold or silicon wafers with known compositions for XPS or AES [20]. |
| High-Purity Solvents | Essential for sample cleaning to remove organic contaminants without leaving residue that could interfere with analysis [2]. |
| Stable Substrates (e.g., Si, Au) | Provide a clean, flat, and well-characterized surface for mounting powder samples or for use as a baseline in comparative studies. |
| Conductive Adhesive Tapes/Coatings | Used to mount non-conductive samples to prevent charging effects in electron- and ion-beam techniques like SEM, XPS, and SIMS. |
| Sputter Ion Source (Ar⁺) | Used for cleaning surfaces and for depth profiling by selectively removing surface layers to reveal subsurface composition [2]. |
Advanced Applications and Workflow Integration
Surface analysis is not performed in isolation. The data from various techniques are often integrated to form a complete picture of a material's properties. The following diagram illustrates how multiple techniques can be combined to solve a complex problem, such as characterizing a coated biomaterial.
Diagram 2: Multi-technique Analysis Workflow
Hypothetical Case Study: Coated Biomaterial
- Initial Analysis with XPS: First, XPS is used to determine the elemental composition and chemical states (e.g., confirming the presence of a specific polymer coating and its oxidation state) across a relatively large area (10-150 μm) [2] [20].
- Molecular Detail with SIMS: SIMS is then employed for its high surface sensitivity and ability to detect trace contaminants and molecular fragments. It can also create a depth profile to verify the coating's thickness and uniformity [2].
- Topographical Mapping with SPM: SPM provides high-resolution, three-dimensional topographical data, measuring surface roughness at the nanoscale, which can influence protein adsorption and cell adhesion [2].
- Wettability with Contact Angle: Contact angle measurements provide the surface energy, a critical property predicting biological interactions [2].
- Data Integration: The combined data set from these techniques provides a comprehensive understanding of the biomaterial's surface, enabling researchers to correlate its physical and chemical properties with its performance in biological environments. This integrated approach is crucial for tailoring product properties and ensuring quality control [2].
Solving R&D Challenges: Troubleshooting Contamination, Reproducibility, and Optimization
Identifying and Controlling Surface Contamination
Surface contamination refers to the undesired introduction of impurities of a microbiological or chemical nature, or of foreign particulate matter, onto a material surface [21]. In critical environments such as pharmaceutical manufacturing, research laboratories, and healthcare settings, controlling surface contamination is paramount for ensuring product safety, experimental accuracy, and personnel protection. The fundamental categories of surface contamination include micro-organisms (bacteria, viruses, fungi), particulates (glass, fibers, dust), and chemical residues (cross-contaminants, hazardous drugs, cleaning agents) [21]. Effective management requires a systematic approach encompassing detection, analysis, and control, framed within a comprehensive Contamination Control Strategy (CCS) as mandated by regulatory bodies like the EMA and FDA [22] [21].
Detection and Analysis Techniques
A range of analytical techniques is employed to detect and identify surface contaminants, each with specific principles, applications, and detection capabilities. The choice of technique depends on the nature of the contaminant and the required sensitivity.
Core Analytical Techniques
Table 1: Core Surface Contamination Detection Techniques
| Technique | Acronym | Principle | Primary Applications | Detection Capabilities |
|---|---|---|---|---|
| X-ray Photoelectron Spectroscopy [23] | XPS/ESCA | Measures kinetic energy of electrons ejected by X-rays to determine elemental and chemical state composition. | Surface chemical composition, chemical state identification, thin film analysis. | All elements except H and He; typical detection limits ~0.1 at% [23]. |
| Auger Electron Spectroscopy [23] | AES | Measures kinetic energy of electrons emitted from Auger process induced by an electron beam. | High-spatial resolution surface mapping, micro-contamination analysis. | All elements except H and He; nanoscale spatial resolution [23]. |
| Secondary Ion Mass Spectrometry [23] | SIMS | Mass analysis of positive/negative ions sputtered from a surface by an energetic primary ion beam. | Trace elemental and molecular analysis, isotopic detection, depth profiling. | All elements and isotopes; extremely high sensitivity (ppm-ppb) [23]. |
| Fourier Transform Infrared Spectroscopy [24] | FTIR | Measures absorption of infrared light to determine molecular vibrations and functional groups. | Identification of organic contaminants, polymers, and coatings. | Molecular functional groups; identification of organic compounds. |
| Scanning Electron Microscopy with Energy-Dispersive X-Ray Spectroscopy [24] | SEM/EDX | Uses a focused electron beam to image surfaces and generate X-rays for elemental analysis. | Particulate contamination analysis, morphology, and elemental composition. | High-resolution imaging; elemental analysis for atoms heavier than boron. |
Specialized and Emerging Methods
For trace-level analysis, techniques like Hard X-ray Photoelectron Spectroscopy (HAXPES) offer greater analysis depths and reduced surface contamination effects [23]. Near Ambient Pressure XPS (NAP-XPS) enables the study of surfaces in reactive environments, which is valuable for corrosion or biological studies [23].
In pharmaceutical and healthcare settings, wipe sampling is a critical technique for monitoring hazardous drug (HD) surface contamination. A recent hospital evaluation used a commercial HD wipe sampling system to detect methotrexate, doxorubicin, and cyclophosphamide on surfaces, leading to effective decontamination and a 92.5% success rate in eliminating contamination after initial cleaning [25].
For environmental contaminants like Polychlorinated Biphenyls (PCBs), the U.S. EPA mandates specific determinative methods such as Gas Chromatography (GC) Method 8082A and Method 608.3 [26].
Innovative biosensor methods are also emerging, such as nanoparticle-based technologies that can isolate and identify foodborne and waterborne bacteria like Salmonella and E. coli in less than two hours, significantly faster than traditional culture methods [27].
Experimental Protocols and Workflows
General Workflow for Surface Contamination Analysis
The following diagram outlines a generalized experimental workflow for surface contamination analysis, from planning to data interpretation.
Detailed Protocol: Wipe Sampling for Hazardous Drugs
A study evaluating a hazardous drug surface contamination surveillance program provides a robust protocol [25]:
- Risk Stratification and Site Selection: Conduct a risk assessment to categorize areas (e.g., cleanroom suites, infusion areas) as high, medium, or low risk. This determines the frequency of testing. In the cited study, 25 sites were selected based on this assessment [25].
- Sampling: Use a standardized wipe sampling kit (e.g., BD HD Check system). Wipe a defined surface area (e.g., 10x10 cm) according to a standard operating procedure (SOP).
- Analysis: Process the wipe sample using the accompanying technology to test for specific hazardous drugs like methotrexate, doxorubicin, and cyclophosphamide [25].
- Decontamination: If a sample tests positive, execute a cleaning and decontamination SOP for the affected site.
- Re-testing: Re-sample the site after decontamination to verify effectiveness. The study achieved a 92.5% negative result rate after the first decontamination [25].
- Corrective and Preventive Action (CAPA): For persistent contamination, perform a CAPA analysis to identify the root cause and implement additional controls.
Detailed Protocol: XPS Analysis of Trace Contaminants
For spectroscopic analysis of trace elements, XPS is a primary technique. Key methodological considerations include [28]:
- Peak Area Measurement: The background-subtracted peak area (A_BS) is used to calculate peak intensity. For small peaks near the detection limit, the correlation between points used for background and peak area must be considered, as it significantly impacts statistical uncertainty.
- Background Subtraction: The choice of background subtraction method (e.g., linear, polynomial) dramatically affects the uncertainty of the peak area. The Relative Background Subtraction Variance (RBSV) metric helps quantify this uncertainty.
- Optimizing Acquisition: To minimize measurement time for a desired detection limit, optimize acquisition parameters (dwell time, energy step size) and the background-determination method based on the RBSV.
The Scientist's Toolkit: Essential Research Reagents and Materials
Table 2: Key Research Reagents and Materials for Surface Contamination Analysis
| Item | Function / Description | Example Application |
|---|---|---|
| Glycan-Coated Magnetic Nanoparticles [27] | Nanoparticles that bind to proteins on virus/bacteria surfaces, allowing magnetic separation from a sample. | Rapid concentration and isolation of microbial contaminants from food and water samples. |
| Gold Nanoparticle Biosensors [27] | DNA-embedded nanoparticles that change color (red to blue) based on the presence/absence of a target gene. | Specific identification of bacterial pathogens like Salmonella or E. coli. |
| Wipe Sampling Kits [25] | Commercial kits containing swabs and reagents designed for standardized surface sampling. | Monitoring hazardous drug contamination on work surfaces in pharmacies and clinics. |
| Certified Reference Materials | Materials with a defined and traceable composition for instrument calibration and method validation. | Ensuring accuracy and precision in quantitative techniques like ICP-MS or GC. |
| EPA SW-846 Extraction Methods [26] | Standardized methods (e.g., 3545A Pressurized Fluid Extraction, 3535A Solid-Phase Extraction) for contaminant extraction. | Preparing solid and aqueous matrices for PCB analysis prior to determinative GC methods. |
Contamination Control and Prevention Strategies
Effective contamination control extends beyond detection to encompass a holistic strategy for prevention and remediation.
The Contamination Control Strategy (CCS)
A CCS is a proactive, systematic approach mandated by regulatory bodies for sterile medicinal product manufacturers [22] [21]. It requires defining all critical control points and assessing the effectiveness of all controls—including design, procedural, and technical—across a facility [22]. The strategy is built on three inter-related pillars [22]:
Pillar 1: Prevention is the most effective means of control. Key elements include [22]:
- Personnel: As a primary contamination source, rigorous training, qualification, and adherence to aseptic technique are critical.
- Technology: Implementing advanced aseptic technologies, automation, and barrier systems to minimize human interaction with critical zones.
- Materials: Controlling the quality of all inputs through vendor management and proper qualification to prevent contamination at the source.
Pillar 2: Remediation involves the reaction to contamination events. This includes investigation, decontamination (e.g., cleaning, disinfection), and the implementation of specific corrective and preventive actions (CAPAs) to return the process to a state of control [22].
Pillar 3: Monitoring and Continuous Improvement (CI) involves tracking critical parameters (e.g., particulate levels) to evaluate the effectiveness of controls. Data trending acts as an early warning system, facilitating investigations and driving process improvements to prevent future deviations [22].
Identifying and controlling surface contamination is a critical discipline that integrates advanced analytical techniques with systematic quality risk management. The field is advancing with faster, more sensitive detection methods, such as nanoparticle-based biosensors and improved spectroscopic software analysis [27] [23]. However, the ultimate efficacy of any program relies on a holistic and documented Contamination Control Strategy that prioritizes prevention, ensures robust remediation, and commits to continuous improvement through vigilant monitoring. This structured approach is fundamental to ensuring product quality, patient safety, and research integrity across scientific and industrial domains.
Ensuring Reproducibility in Surface Modification and Preparation
Reproducibility is a foundational requirement in surface science, ensuring that research findings are reliable, valid, and applicable in both industrial and academic settings. Within the broader context of surface analysis terminology research, reproducibility guarantees that data describing surface compositions and microstructures are consistent across different laboratories and experimental conditions [2]. The primary aims of surface analysis are the quantitative description of surface compositions and microstructures, control of processes to manufacture materials with minimally varying surface properties, and providing data to tailor product properties [2]. Achieving these goals is impossible without reproducible surface modification and preparation techniques. Non-reproducible data can lead to incorrect conclusions about a material's surface properties, undermine research credibility, and result in costly production errors [29] [30]. This guide provides researchers and drug development professionals with a comprehensive framework for achieving reproducibility in surface modification and preparation, with a focus on practical methodologies and rigorous validation.
Fundamental Concepts in Surface Science
The Critical Role of Surface Properties
Surface properties dictate material performance in diverse applications, from biomedical implants to nuclear fuel claddings [31] [2]. In biomaterials, surface characteristics determine biological responses such as protein adsorption and cell adhesion [2]. For nuclear applications, surface modifications provide corrosion and radiation resistance without altering bulk material properties [31]. Surfaces are inherently dynamic, with atoms and molecules often rearranging in response to environmental conditions [2]. This mobility, combined with susceptibility to contamination, makes controlling surface preparation challenging yet critical for reproducibility.
Surface Analysis Techniques
Multiple analytical techniques facilitate surface characterization, each with specific depths of analysis and applications (Table 1) [2]. Selecting the appropriate technique is essential for accurate surface assessment.
Table 1: Common Surface Analysis Techniques and Characteristics
| Method | Principle | Depth Analyzed | Spatial Resolution | Primary Applications |
|---|---|---|---|---|
| Contact Angle | Liquid wetting of surfaces to estimate surface energy | 0.3–2 nm | 1 mm | Wettability, surface energy [2] |
| XPS | X-rays cause emission of electrons with characteristic energy | 1–25 nm | 10–150 μm | Elemental composition, chemical state [2] |
| SIMS | Ion bombardment leads to emission of surface secondary ions | 1 nm-1 μm | 10 nm | Trace element analysis, depth profiling [2] |
| FTIR-ATR | IR radiation adsorption exciting molecular vibrations | 1–5 μm | 10 μm | Chemical bonding, functional groups [2] |
| SPM | Measurement of quantum tunneling current or van der Waals repulsion | 0.5 nm | 0.1 nm | Surface topography, nanoscale features [2] |
Key Challenges to Reproducibility
Contamination and Environmental Factors
Surfaces readily contaminate from atmospheric exposure, handling, or storage conditions [2]. Adventitious carbon layers form quickly on surfaces exposed to air, while hydrophobic environments can cause hydrophobic components to migrate to surfaces [2]. Environmental factors including temperature, humidity, and vibrations significantly impact surface properties and measurements [29]. Maintaining consistent laboratory conditions is essential for reproducible surface preparation and analysis.
Surface Energy and Morphology Variations
Inconsistent surface energy leads to variable binder morphology and material clustering, as demonstrated in cantilever sensors for cadaverine detection [30]. Without controlled surface properties, functionalization layers form unpredictably, causing non-uniform analyte capture and irreproducible results [30]. Surface roughness and chemical heterogeneity further contribute to contact angle hysteresis and measurement variability [29].
Essential Steps for Reproducible Surface Preparation
Surface Cleaning Protocols
Meticulous surface cleaning is the foundational step for reproducibility. Effective cleaning removes organic and inorganic contaminants that compromise surface modifications.
- Solvent Cleaning: Sequential use of acetone, isopropanol, and deionized water effectively removes organic contaminants [30].
- Advanced Techniques: UV-ozone treatment eliminates stubborn organic residues [29].
- Drying Procedures: Nitrogen blow drying prevents water spots and mineral deposits [30].
- Consistency: Identical cleaning steps must be applied across all samples to ensure uniformity [29].
Surface Modification Techniques
Surface modification alters surface properties to achieve desired functionality while maintaining reproducibility across multiple samples.
Table 2: Surface Modification Techniques and Applications
| Modification Type | Materials Used | Deposition Techniques | Performance Achieved |
|---|---|---|---|
| Ion Implantation | Yttrium, Chromium | Sputtering + heavy ion bombardment | Improved corrosion resistance [31] |
| Nonmetallic Coatings | Silicon, Pyrolytic Carbon | Plasma Spray (PS), Thermal Cracking | Improved oxidation resistance [31] |
| Metallic Coatings | Cr, FeCrAl alloy | PVD, Cathodic arc evaporation | Excellent corrosion resistance, reduced hydrogen pickup [31] |
| Ceramic Coatings | Al₂O₃, SiC, Ti₂AlC | Magnetron sputtering, Cold spray | Diffusion barrier, protective oxide layer formation [31] |
| Plasma Treatment | Air, oxygen | Plasma chamber | Introduces hydroxyl groups, enhances hydrophilicity [32] |
Surface Activation for Improved Reproducibility
Surface activation enhances wettability and facilitates consistent functionalization. Plasma treatment introduces functional groups (e.g., hydroxyl groups) that improve surface energy uniformity [32]. For 3D-printed devices, air plasma treatment followed by (3-glycidyloxpropyl) trimethoxyl-silane (GLYMO) modification creates reproducible surfaces for antibody immobilization [32]. This approach improves ELISA performance over passive adsorption alone, demonstrating the value of controlled activation.
Quantitative Measurement and Validation
Ensuring Measurement Reproducibility
Reproducible surface preparation requires validation through quantitative measurements. Contact angle measurement is a cornerstone technique for assessing surface wettability and energy [29]. Key considerations include:
- Environmental Control: Maintain stable temperature and humidity to prevent changes in liquid properties or surface hydration [29].
- Equipment Calibration: Regularly calibrate contact angle instruments using standard reference materials [29].
- Vibration Isolation: Use vibration isolation tables to minimize disruptions during droplet deposition and analysis [29].
- Standardized Deposition: Use droplets with diameters of 5-7 mm for better reproducibility and employ consistent placement techniques [29].
Statistical Analysis for Reproducibility
Robust statistical methods validate surface preparation reproducibility:
- Repeated Measurements: Perform measurements at 3-5 locations on each substrate to account for surface variability [29].
- Gage R&R Studies: Conduct Gage Repeatability and Reproducibility studies to evaluate measurement instrument precision and operator variability [29].
- Frequency Tables: Group quantitative data into appropriate intervals ('bins') to understand data distribution [33].
- Histograms: Display data distribution using histograms with carefully selected bin sizes and boundaries [33].
Experimental Protocols for Reproducible Surface Modification
Protocol: Surface Modification of 3D-Printed Devices for ELISA
This protocol demonstrates a reproducible surface modification approach for 3D-printed microdevices, enabling consistent antibody immobilization [32].
Table 3: Research Reagent Solutions for Surface Modification
| Item | Function | Example Specifications |
|---|---|---|
| Commercial Photocurable Resins | Base material for 3D-printed devices | Nanoclear, Dentrifix, Conjure Rigid [32] |
| Phosphate-Buffered Saline (PBS) | Buffer solution for reagent preparation | Corning, pH 7.4 [32] |
| (3-glycidyloxpropyl) trimethoxyl-silane (GLYMO) | Silane coupling agent for surface functionalization | TCI, 660 mg for 10 mM stock solution [32] |
| Streptavidin | Binding protein for antibody immobilization | Thermo Fisher [32] |
| Biotinylated Antibodies | Capture molecules for ELISA | Anti-activin A antibodies [32] |
Materials and Equipment:
- 3D-printed device (e.g., using Conjure Rigid resin)
- Harrick Plasma Plasma Cleaner PDC-001
- GLYMO stock solution (10 mM in PBS buffer)
- Streptavidin
- Biotinylated antibodies
- PBS buffer
Procedure:
- Surface Activation: Place the 3D-printed device in the plasma cleaner. Evacuate the chamber for 5 minutes, then activate the UV light on high for the optimized duration (device-dependent) [32].
- GLYMO Functionalization: Immediately incubate the plasma-treated device with GLYMO stock solution for 1 hour at room temperature.
- Streptavidin Immobilization: Apply streptavidin solution to the GLYMO-functionalized surface and incubate for 1 hour.
- Antibody Immobilization: Incubate with biotinylated anti-activin A antibodies for final device preparation.
- Validation: Perform ELISA according to standard protocols, comparing results to commercial wells to validate reproducibility.
Workflow Visualization
The following diagram illustrates the experimental workflow for reproducible surface modification:
Documentation and Quality Control
Comprehensive Documentation Practices
Transparent reporting enables reproducibility by other researchers. Document all relevant parameters:
- Surface Preparation: Include cleaning protocols, modification techniques, and storage conditions [29].
- Environmental Conditions: Record temperature, humidity, and any special atmospheric controls [29].
- Measurement Parameters: Detail instrument settings, calibration data, and analysis algorithms [29].
- Reagent Specifications: Document source, purity, and preparation methods for all chemicals used [32].
Quality Control Measures
Implement rigorous quality control procedures:
- Regular Calibration: Establish schedules for equipment calibration using certified standards [29].
- Control Samples: Include reference materials in each batch of experiments to monitor process consistency.
- Interlaboratory Comparisons: Participate in round-robin testing to validate methods across different facilities.
- Contamination Monitoring: Regularly test surfaces for adventitious contamination that could affect results [2].
Reproducibility in surface modification and preparation is achievable through meticulous attention to surface cleaning, controlled modification techniques, rigorous measurement protocols, and comprehensive documentation. By implementing the methodologies outlined in this guide, researchers can ensure reliable surface characterization and performance across diverse applications. In the context of surface analysis terminology research, standardized approaches to surface preparation facilitate clearer communication, more accurate data interpretation, and accelerated innovation in fields ranging from drug development to nuclear energy. As surface science continues to advance, maintaining focus on reproducibility will remain essential for translating laboratory research into practical technological solutions.
Optimizing Experimental Parameters for Desired Surface Behavior
Surface analysis constitutes a critical methodology in materials research, providing invaluable insights into the chemical composition, physical structure, and functional properties of material surfaces. These characteristics directly influence performance metrics including fatigue life, corrosion resistance, and tribological behavior. The paradigm of surface analysis extends beyond mere characterization to encompass the precise control and optimization of surface properties through controlled manufacturing processes. Within this framework, machining parameters emerge as powerful experimental variables that researchers can systematically manipulate to elicit desired surface behaviors. This technical guide establishes the fundamental principles for optimizing these experimental parameters, positioning surface analysis not as a terminal endpoint but as an integral feedback mechanism within the research and development lifecycle for advanced materials, particularly high-performance alloys used in aerospace, automotive, and biomedical applications.
The integrity of a machined surface is not always readily apparent from initial measurements. As identified in recent studies on titanium alloys, an initial surface hardness measurement may fail to account for the instability of machining-induced residual stresses [34]. These stresses inevitably release during service life, disrupting surface equilibrium and altering functional properties like hardness, which can ultimately compromise long-term component reliability and performance [34]. This underscores the necessity for optimization strategies that consider both the immediate (as-produced) and stabilized (in-service) states of the surface. The following sections provide a detailed methodology for designing experiments, executing protocols, and interpreting data to achieve such robust optimization.
Core Concepts and Terminology
A precise understanding of surface analysis terminology is fundamental to designing effective experiments and accurately interpreting results. The following glossary defines key terms used throughout this guide, drawing upon standardized nomenclature.
- Surface Hardness: A measure of a material's resistance to surface indentation or plastic deformation. It is a critical indicator of surface quality and fatigue performance [34].
- Residual Stresses: Stresses that remain within a material after the original cause of the stresses (e.g., machining, heat treatment) has been removed. Their release during service can alter surface properties [34].
- Material Removal Rate (MRR): The volume of material removed per unit time during a machining process, often a key measure of process efficiency [34] [35].
- Surface Roughness (SR): A measure of the texture of a surface, characterized by deviations in the normal vector of a real surface from its ideal form [35].
- Recast Layer (RL): A re-solidified layer of material on a surface that was melted and not fully ejected during a thermal machining process like EDM [35].
- Analysis of Variance (ANOVA): A statistical method used to analyze the differences among group means and their associated procedures, used to determine the significance of process parameters [35].
- Pareto-optimal solutions: In multi-objective optimization, a set of solutions that are non-dominated, meaning that no objective can be improved without worsening another objective [34].
Methodologies for Parameter Optimization
Optimizing experimental parameters for a desired surface behavior requires a structured approach that connects experimental design with statistical analysis. The workflow involves defining objectives, selecting parameters, executing experiments, developing predictive models, and finally, determining optimal parameter sets.
Experimental Workflow and Optimization Logic
The logical sequence for parameter optimization is visualized in the diagram below, which outlines the key stages from problem definition to solution validation.
Detailed Experimental Protocols
The following protocols provide a detailed methodology for implementing the optimization workflow described above, with specific examples from machining research.
Protocol for Multi-Objective Optimization of Surface Hardness
This protocol is adapted from studies on Ti-6Al-4V alloy to optimize surface hardness before and after residual stress release [34].
- Objective Definition: Define the multiple, often competing, objectives. In this case, the goals are to maximize the as-machined surface hardness (H), minimize the potential hardness decrease after residual stress release (ΔH), and maximize the Material Removal Rate (MRR) for efficiency [34].
- Parameter Selection: Select the key machining parameters (e.g., cutting speed, feed rate, depth of cut) that are known to influence the defined objectives.
- Experimental Design: Employ a hybrid experimental design that efficiently explores the multi-dimensional parameter space with a practical number of experimental runs.
- Surface Response Measurement:
- As-Machined Hardness (H): Measure the surface hardness using nanoindentation immediately after machining.
- Hardness Decrease (ΔH): Use the Focused Ion Beam-Digital Image Correlation (FIB-DIC) ring-core method to quantitatively measure the hardness variation caused by a controlled, complete release of residual stress. This involves using an ion beam to create a micro-relief and measuring the resulting surface displacements via DIC to calculate stress relief, followed by nanoindentation at the stress-relieved site to determine ΔH [34].
- Material Removal Rate (MRR): Calculate as the volume of material removed divided by the machining time.
- Model Development: Use Kriging-based models to accurately establish the complex, non-linear relationships between the machining parameters and the three objective responses (H, ΔH, MRR) [34].
- Optimization Execution: Employ a multi-objective evolutionary algorithm, specifically NSGA-III, to resolve the optimization model and generate a set of Pareto-optimal solutions [34].
- Solution Selection: From the Pareto front, select a parameter set that offers the best compromise for the specific application, ensuring high initial hardness with minimal subsequent softening.
Protocol for Parametric Optimization in Wire EDM
This protocol outlines the procedure for optimizing machinability and surface characteristics during Wire Electrical Discharge Machining (WEDM) of Inconel 718, as demonstrated in recent scientific investigations [35].
- Workpiece Preparation: Secure a workpiece of Inconel 718 with a known thickness (e.g., 10 mm). Confirm the material composition using Energy Dispersive X-ray Spectroscopy (EDS) to identify peaks of Ni, Cr, Nb, Ti, and Fe [35].
- Parameter Selection and Ranging: Select key input parameters such as current (A), pulse-on time (Ton), and pulse-off time (Toff). Establish stable machining ranges through pilot experiments. For example:
- Current: 2, 3, 4 A
- Pulse-on time (Ton): 20, 30, 40, 50 µs
- Pulse-off time (Toff): 9, 10, 11, 12 µs [35]
- Experimental Execution: Conduct machining trials using a WEDM setup (e.g., with a molybdenum wire electrode and demineralized water dielectric fluid). For each parameter combination, perform a straight cut of a defined length (e.g., 20 mm) [35].
- Response Measurement:
- Machining Time (MT): Record the time for each cut to complete using a stopwatch.
- Kerf Width (KW): Measure the width of the cut at multiple points along its length using an optical microscope and calculate the average.
- Material Removal Rate (MRR): Calculate MRR using the formula:
MRR = (Kerf width × Length of cut × Thickness of cut) / Machining time[35]. - Surface Roughness (SR): Measure the average surface roughness (Ra) of the machined surface using a profilometer.
- Data Analysis:
- Perform Analysis of Variance (ANOVA) to determine the statistical significance and percentage contribution of each parameter on the responses (MT, MRR, SR) [35].
- Use the Overall Evaluation Criteria (OEC) method to consolidate multiple responses into a single index for optimization, assigning different weightages based on priority (e.g., equal weight to efficiency and surface quality) [35].
- Surface Morphology Examination: Examine the optimized and non-optimized surfaces using Scanning Electron Microscopy (SEM) to evaluate morphological characteristics such as crater formation, micro-pores, globules, and the recast layer [35].
Data Presentation and Analysis
The quantitative results from optimization experiments must be presented clearly to enable effective comparison and decision-making. The following structured tables summarize key parametric influences and outcomes from referenced studies.
Table 1: Influence of Wire EDM Parameters on Machining Responses for Inconel 718 (based on [35])
| Process Parameter | Influence on Material Removal Rate (MRR) | Influence on Surface Roughness (SR) | Influence on Machining Time (MT) |
|---|---|---|---|
| Current (A) | Most influential factor. Increase current increases MRR. | Most influential factor. Increase current increases SR due to larger, deeper craters. | Increase current typically decreases MT. |
| Pulse-on Time (Ton) | Increase Ton generally increases MRR. | Increase Ton significantly increases SR. | A high Ton with insufficient Toff can increase MT due to instability. |
| Pulse-off Time (Toff) | Increase Toff can slightly reduce MRR by reducing spark frequency. | Increase Toff improves surface finish by enabling better debris removal. | Increase Toff generally increases MT. |
Table 2: Example Optimal Parameter Sets from Multi-Objective Optimization Studies
| Study & Material | Primary Objectives | Optimal Parameters | Resulting Performance |
|---|---|---|---|
| WEDM of Inconel 718 [35] | Balance MRR and SR | Current: 2 A, Ton: 40 µs, Toff: 9 µs | Achieved a balance between machining efficiency and surface quality. |
| Machining of Ti-6Al-4V [34] | High initial hardness, minimal softening after stress release | Specific parameters from Pareto-front | High initial hardness (7.12 GPa) with minimized softening (ΔH = 0.62 GPa). |
Table 3: Research Reagent Solutions and Essential Materials for Machining Studies
| Item | Function / Application | Example from Literature |
|---|---|---|
| Molybdenum Wire | Tool electrode in WEDM; conducts electrical discharges to erode the workpiece. | Used as the tool electrode for WEDM of Inconel 718 [35]. |
| Demineralized Water | Dielectric fluid in WEDM; acts as an insulator until ionized, then cools and flushes away eroded debris. | Served as the dielectric medium in WEDM studies [35]. |
| Focused Ion Beam (FIB) | Used for precise site-specific milling and deposition, enabling the creation of micro-reliefs for residual stress measurement. | Integrated with DIC in the ring-core method to measure residual stress-induced hardness variation [34]. |
| Nanoindentation Apparatus | Measures surface mechanical properties (hardness, modulus) at the micro- and nano-scale with high spatial resolution. | Used to measure surface hardness (H) and its decrease (ΔH) after stress release [34]. |
Visualization of Experimental Analysis Pathways
The pathway from raw experimental data to a validated optimal parameter set involves several critical stages of analysis. The diagram below illustrates this pathway, highlighting the tools and decision points involved.
The systematic optimization of experimental parameters is paramount for achieving desired surface behaviors in advanced materials. This guide has detailed methodologies that move beyond single-objective optimization, emphasizing the need to balance initial surface quality with long-term performance stability. The integration of advanced statistical analysis, predictive modeling, and multi-objective optimization algorithms provides a robust framework for researchers to make informed decisions.
Future developments in this field will likely involve the increased use of machine learning and digital twin technologies to create more accurate predictive models with reduced experimental overhead. Furthermore, the integration of in-situ monitoring and real-time adaptive control systems holds the promise of dynamically adjusting parameters to maintain optimal surface quality throughout a manufacturing process. As the demand for high-reliability components in critical applications grows, these sophisticated optimization techniques will become increasingly vital, ensuring that surface behavior is not just measured, but masterfully engineered.
From Lab to Application: Validating Targets and Comparing Techniques in Biomedical Research
The Role of Surface Analysis in Target Identification and Validation for Drug Discovery
In analytical chemistry, surface analysis is defined as the study of the part of a solid that is in contact with a gas or a vacuum [20]. This interface, often just a few atomic layers thick, is critically important because its composition and chemical state almost always differ from the bulk material beneath it [20]. In the context of drug discovery, understanding these surface interactions is fundamental to identifying and validating how small molecule therapeutics interact with their biological targets. Modern surface analysis techniques provide the means to investigate these interactions at the molecular level, offering insights into compound binding, target engagement, and biological activity.
The operational definition of a "surface" is that region of a solid which differs from the bulk. This can range from a native oxide layer on a metal to an intentionally deposited reactive species on a solid support, analogous to a drug compound interacting with a protein target [20]. The thickness of relevant surface layers in biological systems can vary dramatically, from a single molecular layer to hundreds of layers, necessitating analytical techniques with appropriate sampling depths [20].
Key Surface Analysis Techniques in Biological Research
Modern spectroscopic methods for surface analysis operate on a "beam in, beam out" mechanism, where a beam of photons, electrons, or ions impinges on a material and a resulting beam carries information about the surface composition to a detector [20]. The sampling depth—a critical parameter—varies significantly with the technique, determining its suitability for different biological applications.
Table 1: Primary Surface Analysis Techniques Used in Biological Research
| Technique | Acronym | Beam In / Beam Out | Sampling Depth | Key Applications in Drug Discovery |
|---|---|---|---|---|
| X-ray Photoelectron Spectroscopy | XPS/ESCA | Photons / Electrons | ~1-10 nm | Identifying elemental composition and chemical states of surface-immobilized targets |
| Auger Electron Spectroscopy | AES | Electrons / Electrons | ~2 nm | Mapping surface elements at high resolution |
| Secondary Ion Mass Spectroscopy | SIMS | Ions / Ions | ~1 nm | Detecting molecular species and fragmentation patterns at surfaces |
| Ion Scattering Spectroscopy | ISS | Ions / Ions | ~1 nm | Determining top-layer atomic composition |
For drug target identification, the most valuable techniques are those that provide not only elemental composition but also chemical state information, quantitative analysis, and spatial distributions of species across a surface (mapping) or into the bulk from the surface plane (depth profiling) [20]. No single technique typically provides sufficient information to solve complex biological problems; instead, researchers employ complementary methods to build a comprehensive understanding of drug-target interactions.
Surface Analysis in Experimental Target Identification
Target identification is a crucial stage in drug discovery that enables researchers to understand the mechanism of action of bioactive compounds [36]. Surface analysis methodologies play a critical role in two primary experimental approaches: affinity-based pull-down methods and label-free techniques.
Affinity-Based Pull-Down Approaches
Affinity purification is a common method for identifying targets of small molecules where the tested compound is conjugated to an affinity tag or immobilized on a solid support [36]. This chemically modified structure serves as a probe that is incubated with cells or cell lysates, after which bound proteins are purified and identified through electrophoretic separation and mass spectrometry [36].
On-Bead Affinity Matrix Protocol:
- Linker Attachment: A polyethylene glycol (PEG) linker is covalently attached to a solid support (e.g., agarose beads)
- Compound Immobilization: The small molecule is covalently attached to the linker at a specific site that preserves its biological activity
- Incubation: The small molecule affinity matrix is exposed to a cell lysate containing potential target proteins
- Washing: Non-specifically bound proteins are removed through sequential washing
- Elution: Specifically bound target proteins are eluted using conditions that disrupt compound-protein interactions
- Identification: Eluted proteins are identified using mass spectrometry [36]
Table 2: Research Reagent Solutions for Affinity-Based Target Identification
| Reagent/Material | Function | Examples & Specifications |
|---|---|---|
| Agarose Beads | Solid support for compound immobilization | Cross-linked beaded form with activated functional groups (e.g., N-hydroxysuccinimide esters) |
| Polyethylene Glycol (PEG) Linkers | Spacer arm between compound and solid support | Typically 10-20 atoms in length to minimize steric hindrance |
| Biotin Tags | High-affinity handles for purification | Biotin conjugated to small molecule via inert linkers |
| Streptavidin/Avidin Matrices | Capture biotin-tagged complexes | Immobilized on beaded supports with high binding capacity |
| Cell Lysis Buffers | Extract proteins while maintaining native structure | Typically contain detergents (e.g., NP-40), protease inhibitors, and stabilizers |
| Elution Buffers | Release bound proteins from affinity matrix | High salt, competing ligands, or denaturing conditions (SDS) |
Biotin-Tagged Approach: Biotin's strong binding affinity to avidin and streptavidin makes it particularly useful for affinity-based techniques. In this method:
- A biotin tag is attached to the small molecule of interest
- The biotinylated compound is incubated with cell lysates
- Complexes are captured using streptavidin-coated beads
- Bound proteins are eluted and identified [36]
This approach has successfully identified targets for compounds including Withaferin (vimentin), stauprimide (NME2 protein), and epolactaene (Hsp60) [36].
Label-Free Approaches
Label-free methods identify potential targets of small molecules without requiring chemical modification with affinity tags [36]. These techniques rely on detecting changes in protein behavior or stability upon compound binding.
Drug Affinity Responsity Target Stability (DARTS) Protocol:
- Protein Extraction: Prepare cell lysate containing potential target proteins
- Incubation: Incubate lysate with small molecule of interest
- Proteolysis: Treat with pronase or other proteases
- Analysis: Identify protected protein fragments through immunoblotting or mass spectrometry
- Validation: Confirm direct binding through complementary methods [36]
This method has been successfully applied to identify targets for compounds including resveratrol (eIF4A), rapamycin (mTOR/FKBP12), and FK506 (FKBP12/calcineurin) [36].
Computational Surface Analysis in Target Identification
Structure-based computational approaches represent a promising advancement in target identification that can reduce the time required for this critical discovery step [37]. These methods leverage the growing availability of protein structures and computational power to predict small molecule-protein interactions.
Inverse Virtual Screening (IVS) has emerged as a powerful structure-based method that decipheres the protein targets of bioactive compounds by computationally screening a compound against a library of protein structures [37]. This approach can rationalize observed side effects and open new therapeutic strategies by identifying previously unknown targets.
The integration of computational predictions with experimental validation creates a powerful workflow for target identification. Computational methods can prioritize the most promising targets for experimental confirmation, significantly accelerating the drug discovery process.
Experimental Workflows and Visualization
Affinity-Based Target Identification Workflow
Label-Free Target Identification Workflow
Integrated Computational & Experimental Workflow
Surface analysis provides an indispensable toolkit for target identification and validation in modern drug discovery. The complementary approaches of affinity-based methods, label-free techniques, and computational predictions create a powerful paradigm for deconvoluting the mechanisms of action of bioactive compounds. As surface analytical techniques continue to advance in sensitivity and resolution, and computational methods become increasingly sophisticated, the integration of these approaches will further accelerate the identification and validation of novel therapeutic targets. This multidisciplinary framework, bridging physical surface analysis with biological target identification, represents a critical foundation for future innovation in drug development.
The biological performance of biomaterial implants and devices is fundamentally governed by their surface properties. Characteristics such as topography, chemistry, wettability, and energy directly influence critical processes including protein adsorption, cell adhesion, proliferation, and differentiation [38]. Consequently, comprehensive surface analysis is indispensable for understanding biomaterial-tissue interactions, predicting long-term implant success, and guiding the development of advanced medical devices. This technical guide, framed within a broader thesis on surface analysis terminology research, provides an in-depth examination of modern methodologies for validating biomaterial surface properties. It is structured to serve researchers, scientists, and drug development professionals by detailing analytical techniques, experimental protocols, and data interpretation strategies essential for robust biomaterial characterization.
Core Surface Analysis Techniques
A wide array of analytical techniques is available for probing biomaterial surfaces, each providing unique insights into different physical and chemical properties. The selection of an appropriate technique depends on the specific information required, such as chemical composition, topographical features, or mechanical performance [2].
Table 1: Core Surface Analysis Techniques for Biomaterials [39] [2]
| Technique | Acronym | Principle of Operation | Depth Analyzed | Lateral Resolution | Key Information Provided |
|---|---|---|---|---|---|
| X-ray Photoelectron Spectroscopy | XPS | X-rays cause emission of electrons with characteristic kinetic energy. | 1–25 nm | 10–150 μm | Elemental and chemical state composition. |
| Secondary Ion Mass Spectrometry | SIMS | Ion bombardment leads to emission of surface secondary ions. | 1 nm - 1 μm | ≥ 10 nm | Elemental and molecular composition, extreme surface sensitivity. |
| Scanning Electron Microscopy | SEM | Focused electron beam generates secondary electrons for imaging. | 0.5 nm (signal depth) | ~4 nm | High-resolution surface topography and morphology. |
| Atomic Force Microscopy | AFM (a type of SPM) | Measures van der Waals forces between a sharp tip and the surface. | 0.5 nm | ~0.1 nm | 3D surface topography and nanomechanical properties. |
| Contact Angle Goniometry | CA | Measures liquid wetting angle to estimate surface energy. | 0.3–2 nm | ~1 mm | Surface wettability and hydrophilicity/hydrophobicity. |
| Fourier Transform Infrared Spectroscopy - Attenuated Total Reflectance | FTIR-ATR | IR radiation adsorption excites molecular vibrations. | 1–5 μm | ~10 μm | Chemical bonding and molecular functional groups. |
The data in Table 1 highlights the complementarity of these techniques. For instance, while XPS provides quantitative chemical state information from the top ~10 nm, FTIR-ATR probes a much deeper layer, making it suitable for analyzing bulk polymer chemistry or thicker coatings [2]. A comprehensive validation strategy often requires a multi-technique approach to correlate chemical information with topographical and physical property data.
Advanced Imaging for Biomaterial-Tissue Interaction
Beyond surface characterization, evaluating how the biomaterial interacts with biological systems in vitro and in vivo is crucial. Modern biomedical imaging modalities allow for non-invasive or minimally invasive assessment of these interactions [39].
Table 2: Imaging Modalities for Characterizing Biomaterial-Tissue Interactions [39]
| Imaging Modality | Contrast Mechanism | Typical Spatial Resolution | Typical Penetration Depth | Advantages | Disadvantages | Representative Applications |
|---|---|---|---|---|---|---|
| Scanning Electron Microscopy | Electron scattering | 1 nm | 0.1 μm | Nano-scale resolution | Invasiveness, requires sample fixation and vacuum | Intimate cell-material interaction, mineralization [39] |
| Confocal / Multi-Photon Microscopy | Fluorescent emission, scattering | 1 μm | 1 mm | Cellular-level resolution, high chemical sensitivity | Superficial penetration | Cell attachment to scaffolds, gene expression [39] |
| Ultrasound Imaging | Acoustic reflection | 0.3 mm | 10 cm | Deep penetration, high speed, safe | Low resolution, low chemical sensitivity | Mechanics, flow dynamics, scaffold cavitation [39] |
| Micro-Computed Tomography (X-ray) | X-ray absorption | 0.1 mm | 40 cm | Non-invasive, deep penetration, high resolution for hard tissues | Ionizing radiation, low soft-tissue sensitivity | Engineered bone, 3D pore structure analysis [39] [40] |
| Magnetic Resonance Imaging | Proton magnetization and relaxation | 1 mm | 50 cm | Non-invasive, excellent soft-tissue contrast | Expensive, low imaging speed | Water content and transport in hydrogels [39] |
These imaging techniques enable researchers to monitor phenomena such as scaffold degradation, vascularization, and cell migration over time, providing a dynamic picture of biomaterial performance within a biological context [39]. For example, SEM is instrumental in visualizing cell morphology and attachment on a material surface, while µ-CT is ideal for quantifying bone ingrowth into porous scaffolds [39] [40].
Experimental Protocol: Validating Laser-Modified Biomaterial Surfaces
The following detailed protocol is adapted from a recent study investigating biomaterial surfaces modified by a High-Focus Laser Scanning (HFLS) system to create specific hydrophilic and hydrophobic patterns ("Line" and "Grid") [38]. This serves as a concrete example of an integrated validation workflow.
Surface Modification and Morphological Analysis
- Surface Patterning with HFLS: Polystyrene (PS) substrates (30 mm diameter) are irradiated using the HFLS system. Key parameters include a wavelength of 1030 nm, power of 700 mW, scan speed of 100 mm/s, frequency of 100 kHz, and pulse duration of 250 femtoseconds. The "Line" pattern is created with a single irradiation pass, while the "Grid" pattern is formed with an additional pass along the cross-axis [38].
- Scanning Electron Microscopy (SEM): To visualize the topographical features created by the laser, samples are sputter-coated with a thin layer of platinum to enhance conductivity. Imaging is performed using an SEM at an accelerating voltage between 5–15 kV [38].
Surface Property Investigation
- Contact Angle Measurements: Surface wettability is quantitatively assessed using a contact angle goniometer. A droplet of water is dispensed onto the modified surface, and an image is captured. The contact angle is measured using accompanying software, with higher angles indicating greater hydrophobicity. For the HFLS study, the "Grid" pattern yielded a super-hydrophobic surface with a contact angle of 158.63° ± 1.26 [38].
Biological Functionality Assessment
- Cell Culture: Human Gingival Fibroblasts (HGFs) are used as a model system, particularly relevant for dental implant applications. Cells are cultured in Dulbecco's Modified Eagle's Medium (DMEM) supplemented with 10% Fetal Bovine Serum (FBS) and 1% penicillin, maintained in a humidified incubator at 37°C with 5% CO₂ [38].
- Cell Adhesion and Morphology via Fluorescence Microscopy:
- Seeding: HGFs are cultured on the test surfaces ("None," "Line," "Grid") for 4 hours.
- Fixation: Cells are fixed with 4% paraformaldehyde for 15 minutes.
- Permeabilization: Cell membranes are permeabilized with 0.5% Triton X-100 for 10 minutes.
- Blocking: Non-specific binding sites are blocked with 2% Bovine Serum Albumin (BSA) for 30 minutes.
- Staining: Samples are incubated with primary antibodies targeting vinculin (a focal adhesion protein) for 24 hours at 4°C, followed by incubation with a fluorescently-labeled secondary antibody (e.g., Alexa Fluor 488) for 1 hour. Actin filaments are stained with phalloidin, and cell nuclei are stained with DAPI.
- Imaging: Samples are mounted and imaged using a fluorescence microscope (e.g., Nikon Eclipse Ni-U). This protocol allows for visualization of initial cell adhesion, spreading, and the development of focal adhesion complexes [38].
- Drug Delivery Functionality: To evaluate the modified surfaces as drug carriers, the anti-inflammatory drug Prednisolone (PDS) is loaded onto the surfaces. The PDS holding capacity and its release kinetics are measured using analytical methods such as UV-Vis spectroscopy. The biological activity of the released PDS is confirmed through Western Blot analysis to assess the reduction of key inflammatory cytokines [38].
The following workflow diagram summarizes this experimental process:
The Scientist's Toolkit: Essential Research Reagents and Materials
Table 3: Key Reagents and Materials for Surface Validation Experiments [38]
| Item | Function / Application |
|---|---|
| Polystyrene (PS) Substrates | A model biomaterial substrate, ideal for cell culture, used for surface modification. |
| High-Focus Laser Scanning (HFLS) System | Equipment for precise, high-speed surface patterning to create micro/nano-topographies. |
| Primary Antibodies (e.g., anti-Vinculin) | Target specific intracellular proteins (e.g., in focal adhesions) for fluorescence microscopy. |
| Fluorescent Secondary Antibodies (e.g., Alexa Fluor 488) | Bind to primary antibodies to enable visualization of specific targets under a microscope. |
| Phalloidin (e.g., Rhodamine-labeled) | A high-affinity probe used to stain filamentous actin (F-actin) in the cytoskeleton. |
| DAPI (4',6-diamidino-2-phenylindole) | A fluorescent stain that binds strongly to DNA, used to visualize cell nuclei. |
| Prednisolone (PDS) | A model anti-inflammatory drug used to test the drug delivery functionality of the modified surface. |
| Cell Culture Media (e.g., DMEM with FBS) | Provides essential nutrients to maintain cells (e.g., Human Gingival Fibroblasts) during biological assays. |
| Paraformaldehyde | A cross-linking fixative used to preserve and immobilize cellular structures for microscopy. |
| Triton X-100 | A detergent used to permeabilize cell membranes, allowing antibodies to access intracellular targets. |
| Bovine Serum Albumin (BSA) | Used as a blocking agent to prevent non-specific binding of antibodies during staining procedures. |
Data Analysis and Interpretation Framework
Effective validation requires a structured approach to data analysis. The relationship between surface properties and biological responses can be modeled and optimized using statistical design of experiments (DoE).
For instance, a Definitive Screening Design (DSD) can be employed to model the relationship between bioink composition factors (e.g., sodium alginate %, MGS-1 %, CMC %) and response variables (e.g., cell viability, calcium carbonate formation) [41]. This approach uses multivariate analysis to identify main effect estimates and optimize the system with a reduced number of experimental runs, making the R&D process more efficient and cost-effective [41].
The validation of biomaterial surface properties is a multi-faceted process that integrates sophisticated analytical techniques, robust biological assays, and statistical data analysis. As demonstrated in the laser surface modification case study, a systematic approach—from topographical and chemical characterization to functional biological assessment—is critical for establishing reliable structure-property-function relationships. This rigorous validation framework ensures that biomaterial implants and devices perform as intended, with predictable and favorable interactions in the complex biological environment, ultimately guiding their successful translation from the laboratory to clinical application.
Leveraging Surface Analysis for Quality Control and Clinical Translation
Surface analysis encompasses a suite of analytical techniques dedicated to examining the outermost layers of a material, typically the top 1 to 10 atomic layers [42] [6]. This region is critically important because it is the portion of a material that first interacts with its environment, governing key properties such as chemical reactivity, adhesion, wetness, electrical properties, optical properties, corrosion-resistance, friction, and biocompatibility [42] [6]. In the context of pharmaceuticals and biotechnology, surface analysis provides an indispensable means to correlate a product's performance with its surface composition and structure, thereby accelerating the development of new therapies and improving the performance and reliability of existing ones [42].
The global surface analysis market, valued at $6 billion in 2024 and projected to grow to $9.38 billion by 2029, reflects the critical and expanding role of these techniques across industries, with significant growth drivers in the life sciences and pharmaceutical sectors [43] [44]. This guide details how these powerful techniques are applied to overcome specific challenges in quality control and the complex journey of clinical translation.
Core Surface Analysis Techniques and Their Principles
Surface analysis is performed by stimulating the surface of a sample with a primary probe—such as photons, X-rays, ions, or electrons—in an ultra-high vacuum (UHV) environment [42] [6]. The interaction of this probe with the surface generates various signals (electrons, ions) that escape from the top few atomic layers. By analyzing the properties of these emitted particles (e.g., their energy or mass), detailed information about the surface's chemical composition and structure can be determined [42] [6]. When information from deeper layers (from several dozen to several hundred nanometers) is required, depth profiling is employed, where an ion beam is used to sequentially remove thin layers of material for subsequent analysis of the newly exposed surface [42] [6].
The following table summarizes the three main surface analysis techniques, their operating principles, key characteristics, and primary applications in the life sciences.
Table 1: Key Surface Analysis Techniques for Life Sciences Applications
| Technique | Acronym | Primary Probe / Detected Signal | Key Characteristics | Primary Applications in Life Sciences |
|---|---|---|---|---|
| X-ray Photoelectron Spectroscopy [6] [45] [44] | XPS | X-rays / Electrons | Quantitative elemental composition and chemical bonding states; analysis area down to several microns; suitable for organic and inorganic materials. | Analysis of surface compositions, chemical states of excipients/APIs, and identification of surface contamination. |
| Time-of-Flight Secondary Ion Mass Spectrometry [6] | TOF-SIMS | Ions / Ions | Extremely high surface sensitivity; provides organic compound molecular mass information; high-sensitivity inorganic element analysis. | Distribution analysis of organic matter, high-sensitivity detection of contaminants, and imaging of drug distribution on surfaces. |
| Auger Electron Spectroscopy [6] | AES | Electrons / Electrons | Very high spatial resolution for micro-analysis; functions as a scanning electron microscope. | Analysis of micro-level foreign substances and defects on medical device surfaces or packaging. |
The logical relationship and typical application workflow for these core techniques in a quality control investigation can be visualized as follows:
Figure 1: Decision Workflow for Surface Analysis Techniques in Quality Control
Surface Analysis in Pharmaceutical Quality Control
Quality control (QC) in pharmaceutical manufacturing demands rigorous characterization to ensure product safety, efficacy, and consistency. Surface analysis techniques provide a window into critical quality attributes (CQAs) that are often invisible to bulk analysis methods.
Contamination Identification and Analysis
In semiconductor and pharmaceutical manufacturing, even minimal surface contamination can lead to product failure [6]. TOF-SIMS, with its exceptional sensitivity for both organic and inorganic species, is ideally suited for identifying unknown contaminants on device surfaces, packaging, or even drug products themselves [6]. Its ability to provide molecular mass information allows analysts to not only detect the presence of a contaminant but also to hypothesize its chemical identity, which is the first step in eliminating the root cause.
Chemical State and Composition Analysis
The surface composition of a drug product or excipient can directly influence its stability, dissolution, and bioavailability. XPS excels in this area by providing quantitative data on the elemental composition and chemical state of the surface [6] [45]. For instance, XPS can determine the oxidation state of an element in an active pharmaceutical ingredient (API) or identify the presence of process-related impurities that have segregated to the surface. This information is vital for understanding batch-to-batch variability and ensuring the chemical integrity of the product.
Surface Characterization of Complex Biologics: The Case of Extracellular Vesicles
The translation of novel biologics, such as extracellular vesicles (EVs), highlights advanced applications of surface analysis. EVs are powerful but complex, with their natural diversity making them tricky to study and standardize [46]. Their surface characteristics, including the presence and abundance of specific markers (e.g., CD63, CD81, CD9, CD73), are critical for their biological function and identity.
Traditional bulk analysis methods often mask the heterogeneity within EV populations. Innovative tools like nanoflow cytometry enable single-vesicle analysis, allowing for the precise quantification of surface markers on individual EVs [46]. This high-resolution profiling can reveal tissue- and marker-specific differences, deepening our understanding of EV diversity, enhancing the interpretation of their bioactivity, and informing strategies for enriching specific therapeutic EV subtypes [46]. A functional assay like the CD73 activity assay can further demonstrate how enzymatic activity on the EV surface varies significantly depending on the cell source, donor, and manufacturing process [46].
The Role of Surface Analysis in Clinical Translation
The path from research to an approved clinical product is fraught with challenges, particularly in demonstrating consistent and well-characterized product quality. Surface analysis is a critical component in building the chemistry, manufacturing, and controls (CMC) data package required by regulators.
Addressing Heterogeneity and Ensuring Consistency
A central challenge in developing complex products like MSC-derived EVs (MSC-EVs) is inherent heterogeneity, which originates from the secreting cells and is reflected in their EVs [46]. This variability can stem from the MSC tissue source, donor-to-donor differences, and production platform (e.g., 2D vs. 3D culture) [46]. Surface analysis techniques, particularly single-vesicle methods, are essential for quantifying this heterogeneity and establishing critical quality attributes (CQAs). As the field advances, there is a broad consensus on the need for standardized and consistent manufacturing processes to control this variability [46].
Meeting Regulatory Standards
For any therapeutic product, consistency in manufacturing and product characteristics is the unifying principle for regulatory approval [46]. As EV-based therapeutics move toward the clinic, developers are encouraged to engage early with regulators, sharing details of their manufacturing processes and the scientific rationale behind their analytical methods [46].
The analytical characterization for regulatory evaluation rests on assessments of identity, purity, potency, and safety [46].
- Identity: For MSC-EVs, this involves demonstrating the presence of EV markers (e.g., CD63, TSG101) and MSC-specific surface markers to confirm the cellular source [46].
- Purity: This remains a significant challenge, as the field has not yet reached a consensus on what constitutes a "pure" EV preparation [46]. Surface analysis is key to defining and monitoring purity-related CQAs.
Adhering to Quality-by-Design (QbD) principles, as highlighted in nanomedicine translational research, involves identifying Critical Material Attributes (CMAs) and Critical Process Parameters (CPPs) that link directly to CQAs [47]. Surface analysis provides the data necessary to establish these vital links, ensuring the product is consistently produced to the required quality standard.
Experimental Protocols and Methodologies
To ensure reproducibility and generate high-quality data, standardized experimental protocols are essential. Below are detailed methodologies for key surface analysis applications.
Protocol: XPS Analysis of a Pharmaceutical Tablet Surface
Objective: To determine the elemental composition and chemical state of the outermost surface of a tablet to identify potential lubricant or contaminant layers.
Materials and Reagents:
- Sample: Pharmaceutical tablet
- Reference Samples: Pure samples of suspected materials (e.g., magnesium stearate, API)
- Mounting: Conductive double-sided adhesive tape or a sample holder suitable for powders/tablets
Procedure:
- Sample Preparation:
- Carefully place the intact tablet onto the conductive tape mounted on the XPS sample stub. Avoid touching the analysis surface.
- If cross-section analysis is needed, the tablet may be carefully fractured in a controlled environment and the fresh surface mounted.
- Insert the sample into the fast-entry load-lock chamber of the XPS instrument.
Sample Pump-Down and Transfer:
- Evacuate the load-lock chamber to a medium vacuum (typically ~10⁻⁵ mbar).
- Once the base pressure is reached, transfer the sample into the main analysis chamber, which is under ultra-high vacuum (UHV, ≤ 10⁻⁹ mbar).
Data Acquisition:
- Survey Scan: Acquire a wide energy range survey spectrum (e.g., 0-1200 eV binding energy) to identify all elements present on the surface.
- High-Resolution Scan: For each element of interest identified in the survey scan, acquire a high-resolution spectrum over a narrow energy range. This is necessary for determining chemical states and accurate quantification.
- Charge Neutralization: As pharmaceutical samples are often electrically insulating, use the instrument's low-energy electron flood gun and/or argon ion source to neutralize surface charging during analysis.
- Analysis Conditions: Typical parameters include a monochromatic Al Kα X-ray source (1486.6 eV), a pass energy of 160 eV for survey scans and 20-50 eV for high-resolution scans, and a photoelectron take-off angle of 45° relative to the sample surface.
Data Analysis:
- Process the spectra using dedicated software, including background subtraction (e.g., Shirley or Tougaard) and peak fitting for the high-resolution spectra.
- Quantify atomic concentrations from the survey scan using elemental sensitivity factors.
- Identify chemical states by comparing the binding energies of high-resolution peaks to reference databases.
Protocol: Single-Vesicle Surface Protein Analysis via Nanoflow Cytometry
Objective: To quantitatively characterize the surface marker profile (CD63, CD81, CD73) of individual extracellular vesicles within a heterogeneous population.
Materials and Reagents:
- Sample: Purified EV suspension in PBS or a suitable buffer.
- Antibodies: Fluorescently-labeled antibodies against CD63, CD81, and CD73. Use isotype-matched antibodies as negative controls.
- Buffer: Phosphate-Buffered Saline (PBS) with 0.1% Bovine Serum Albumin (BSA) for dilution and washing.
- Size Standards: Nanometer-sized polystyrene beads of known size (e.g., 100 nm, 200 nm) for instrument calibration.
Procedure:
- EV Staining:
- Aliquot a volume of EV suspension (e.g., containing ~10⁹ particles) into a microcentrifuge tube.
- Add the predetermined optimal concentration of fluorescently-labeled antibodies.
- Incubate the mixture in the dark for 30-60 minutes at room temperature or 4°C.
Removal of Unbound Antibodies:
- To separate stained EVs from unbound antibodies, use size-exclusion chromatography (e.g., qEV columns) or perform ultracentrifugation (e.g., 100,000g for 70 minutes).
- Resuspend the final EV pellet in a known volume of PBS with 0.1% BSA.
Instrument Setup and Calibration:
- Turn on the nanoflow cytometer and its associated laser sources.
- Run the standard size beads to calibrate the scatter detection and ensure the instrument is detecting particles in the expected size range.
Data Acquisition:
- Dilute the stained EV sample to an appropriate concentration to avoid particle coincidence in the detector.
- Run the sample, collecting data for side scatter (indicative of particle size) and fluorescence in the channels corresponding to each antibody fluorophore.
- Acquire data for a minimum of 10,000 individual particle events.
Data Analysis:
- Use the instrument's software to gate on the EV population based on scatter signals.
- Analyze fluorescence-positive populations for each marker relative to the isotype control gates.
- Quantify the percentage of EVs positive for each marker and the intensity of marker expression.
Table 2: The Scientist's Toolkit: Essential Reagents for Surface Characterization Experiments
| Item / Reagent | Function / Application | Technical Notes |
|---|---|---|
| Conductive Adhesive Tape | Mounting non-conductive samples (e.g., tablets, polymers) for XPS/AES to facilitate charge neutralization. | Carbon-based tapes are preferred to avoid interfering elemental signals. |
| Monoclonal Antibodies (Fluorescently-labeled) | Tagging specific protein epitopes on biological nanoparticles (e.g., EVs) for detection via nanoflow cytometry. | Antibody specificity and titration are critical for accurate quantification. |
| Size Exclusion Chromatography (SEC) Columns | Purifying stained EV samples by removing unbound antibodies and aggregates post-labeling. | Ensures fluorescence signal is vesicle-associated, reducing background noise. |
| Phosphate-Buffered Saline (PBS) | A universal buffer for sample dilution, washing, and resuspension in biological preparations. | Should be particle-free and may require filtration (0.1 µm) before use with EVs. |
| Reference Material Standards | Calibrating instrumentation (e.g., XPS, nanoflow cytometer) for accurate size and signal quantification. | Includes polystyrene beads for flow cytometry and certified reference samples for XPS. |
The integrated role of these materials and techniques in the development and quality control of a complex biologic therapeutic is summarized in the following workflow:
Figure 2: Integrated Workflow for Biologic Therapeutic Production and Quality Control
Surface analysis has evolved from a specialized research tool into a cornerstone of modern quality control and a critical enabler of clinical translation. Techniques like XPS, TOF-SIMS, and AES provide unparalleled insights into the chemical and molecular properties of surfaces that dictate product performance. The emergence of high-resolution methods like nanoflow cytometry allows the field to tackle the inherent heterogeneity of complex biologics such as extracellular vesicles. By rigorously applying these techniques within a QbD and GMP framework, and by defining CQAs related to identity, purity, and potency, developers can build the robust data packages needed to ensure product consistency, satisfy regulatory requirements, and ultimately, bring safer and more effective therapies to patients.
Conclusion
A firm grasp of surface analysis terminology and methodologies is no longer a niche skill but a fundamental requirement for success in modern biomedical research and drug development. From ensuring the reproducibility of experimental surfaces to validating the interface of a new implant or drug target, surface analysis provides the critical data needed to bridge the gap between academic discovery and clinical application. As the field advances, the integration of multiple, complementary techniques will be key to solving complex biological problems, improving R&D productivity, and ultimately tailoring surface properties for the next generation of biomedical innovations.
References
- 1. Surface Analysis Tools for Characterizing Biological ... [https://pmc.ncbi.nlm.nih.gov/articles/PMC7337324/]
- 2. Surface Analysis - an overview [https://www.sciencedirect.com/topics/materials-science/surface-analysis]
- 3. Color contrast - Accessibility - MDN Web Docs - Mozilla [https://developer.mozilla.org/en-US/docs/Web/Accessibility/Guides/Understanding_WCAG/Perceivable/Color_contrast]
- 4. Text has enhanced contrast | ACT Rule | WAI [https://www.w3.org/WAI/standards-guidelines/act/rules/09o5cg/]
- 5. Elements must meet minimum color contrast ratio thresholds [https://dequeuniversity.com/rules/axe/4.8/color-contrast]
- 6. What is Surface Analysis? [https://www.ulvac-phi.com/en/surface-analysis/analysis/]
- 7. Glossary of methods and terms used in surface chemical ... [https://www.degruyterbrill.com/document/doi/10.1515/ci-2021-0119/html?srsltid=AfmBOoomICQwJ4gc0Po8guPBZ10EguBjg9vlRit2nEER5oy8tRrUo7sI]
- 8. Vocabulary for Surface Chemical Analysis (ISO 18115:2013.) [https://www.aist.go.jp/aist_e/dept/iso.html]
- 9. Glossary of surface science terms [https://www.kruss-scientific.com/en-US/know-how/glossary]
- 10. Advancements in SERS: Revolutionizing Biomedical ... [https://pubmed.ncbi.nlm.nih.gov/40959485/]
- 11. Emerging biomedical applications of surface-enhanced ... [https://www.sciencedirect.com/science/article/abs/pii/S1386142525005918]
- 12. Surface-Enhanced Raman Spectroscopy for Biomedical ... [https://www.tropmedres.ac/publications/2092173]
- 13. Introduction to Surface Analysis - Biointerface [https://biointerface.org/surface/]
- 14. 7.6: Scanning Probe Microscopy - STM and AFM [https://chem.libretexts.org/Bookshelves/Physical_and_Theoretical_Chemistry_Textbook_Maps/Surface_Science_(Nix)/07%3A_Surface_Imaging_and_Depth_Profiling/7.06%3A_Scanning_Probe_Microscopy_-_STM_and_AFM]
- 15. SPM, STM, AFM | SPECSGROUP [https://www.specs-group.com/specsgroup/knowledge/methods/detail/spm-stm-afm/]
- 16. Atomic force microscopy [https://en.wikipedia.org/wiki/Atomic_force_microscopy]
- 17. Contrast and brightness - SEM [https://myscope.training/SEM_Contrast_and_brightness]
- 18. Choosing the Right Nanoscale Imaging Technique [https://www.nanosurf.com/insights/choosing-the-right-nanoscale-imaging-technique]
- 19. Scanning probe microscopy of metal–organic coordination ... [https://pubs.rsc.org/en/content/articlehtml/2025/cs/d4cs01303d]
- 20. Surface analysis | Definition, Methods, Chemistry, & Facts [https://www.britannica.com/science/surface-analysis]
- 21. Understanding contamination control in pharmacy aseptic ... [https://www.sps.nhs.uk/articles/understanding-contamination-control-in-pharmacy-aseptic-services/]
- 22. Contamination Control Strategies: A Path for Quality & Safety [https://www.pda.org/pda-letter-portal/home/full-article/contamination-control-strategies-a-path-for-quality-safety]
- 23. Challenges in surface analysis [https://www.frontiersin.org/journals/analytical-science/articles/10.3389/frans.2023.1234943/full]
- 24. Common Contamination Detection and Analysis Techniques [https://capitalresin.com/common-contamination-detection-and-analysis-techniques/]
- 25. Evaluation of a hazardous drug surface contamination ... [https://pubmed.ncbi.nlm.nih.gov/39953987/]
- 26. Fact Sheet: Extraction and Determinative Methods [https://www.epa.gov/pcbs/fact-sheet-extraction-and-determinative-methods]
- 27. Faster methods for detecting viruses in food, water | MSUToday [https://msutoday.msu.edu/news/2025/08/detecting-water-contamination-earlier]
- 28. statistical uncertainty near the detection limit [https://pmc.ncbi.nlm.nih.gov/articles/PMC5907527/]
- 29. 10 Essential Steps for Achieving Reproducible Contact Angle [https://dropletlab.com/blog/10-steps-reproducible-contact-angle/]
- 30. Surface Modification Enabling Reproducible Cantilever ... [https://pmc.ncbi.nlm.nih.gov/articles/PMC8472552/]
- 31. Use of Surface Modification to Expand Existing Materials ... [https://www.anl.gov/ntns/use-of-surface-modification-to-expand-existing-materials-performance]
- 32. A Facile Surface Modification Strategy for Antibody ... [https://pmc.ncbi.nlm.nih.gov/articles/PMC12024930/]
- 33. 11 Summarising quantitative data | Scientific Research and ... [https://bookdown.org/pkaldunn/SRM-Textbook/SummariseQuantData.html]
- 34. Synergistic Optimization of Machining Parameters for ... [https://www.sciencedirect.com/science/article/pii/S2238785425026481]
- 35. Experimental investigation and parametric optimization of ... [https://www.nature.com/articles/s41598-025-11188-3]
- 36. Target identification of small molecules - PubMed Central - NIH [https://pmc.ncbi.nlm.nih.gov/articles/PMC10566111/]
- 37. Target identification by structure-based computational ... [https://www.sciencedirect.com/science/article/pii/S0960894X23000495]
- 38. Evaluation of biological functionality of biomaterial surface ... [https://link.springer.com/article/10.1007/s10856-025-06954-8]
- 39. Imaging Biomaterial-Tissue Interactions - PMC [https://pmc.ncbi.nlm.nih.gov/articles/PMC5837919/]
- 40. Imaging Techniques for Biomaterials Characterization [https://www.sciencedirect.com/journal/biomaterials/vol/28/issue/15]
- 41. Bioink: Model Validation - 2025 UBC iGEM Wiki [https://2025.igem.wiki/ubc-vancouver/bioprinter/bioink-model-validation]
- 42. Surface Analysis Applications | Physical Electronics Inc. [https://www.phi.com/surface-analysis-applications.html]
- 43. Surface Analysis Market Report 2025 [https://www.researchandmarkets.com/reports/5980501/surface-analysis-market-report?srsltid=AfmBOooAmuT1J6b_A8kwxYCo4eaE3qgjZyc7OaLHhyau5xDCaFmDbA1R]
- 44. Surface Analysis Global Market Report 2025 [https://www.thebusinessresearchcompany.com/report/surface-analysis-global-market-report]
- 45. Comprehensive 2025 Surface Analysis Market Overview: Trends, Forecasts, and Growth Drivers [https://www.openpr.com/news/4127780/comprehensive-2025-surface-analysis-market-overview-trends]
- 46. The Complex Journey of EVs Toward Clinical Translation [https://www.roosterbio.com/blog/heterogeneous-but-advancing-the-complex-journey-of-evs-toward-clinical-translation/]
- 47. Navigating translational research in nanomedicine [https://www.sciencedirect.com/science/article/pii/S0378517325000389]